132 E Rosedale Ave #134 · Milwaukee, WI
Flood risk 1/10 · Minimal
- FEMA flood zone
- X (unshaded)
- Chance of flooding over 30 yrs
- 0.0%
- Est. flood insurance / yr
- $473 – $860
Fire risk 1/10 · Minimal
- Est. fire insurance / yr
- $636 – $1,182
Heat risk 2/10 · Minimal
- Hot days now (above 96°F)
- 7 days/yr
- Hot days in 30 yrs
- 13 days/yr
Wind risk 2/10 · Minimal
- Chance of severe wind over 30 yrs
- —
Air-quality risk 3/10 · Minor
- Unhealthy air days now
- 3 days/yr
- Unhealthy air days in 30 yrs
- 3 days/yr
Risk factors via First Street. Map © Google.
Why this score? — see what drove the C- grade
The composite is a weighted blend of 9 inputs, each scored 0–100. Each bar is that input's sub-score; the figure is the points it added to the 100-point composite (weight × sub-score).
- Cash flow +21.4/30.0
- ARV discount +7.5/15.0
- DSCR +6.8/10.0
- 1% rule +5.6/10.0
- Livability +4.0/5.0
- Rent growth +3.1/5.0
- Schools +1.2/10.0
- Condition / age +1.0/5.0
- Appreciation +0.0/10.0
$149,900
🖨 Deal sheet 📄 Offer letter ✓ Due diligence
Listing remarks
Bay View duplex that has been used as single family for over 40 years seeks new owner. Bring your ideas and liven up this set-back home with front yard and two slabs for parking in back.
Key facts
- Bay view duplex
- Front yard
- 3,484 sq ft lot
Tags
Property features AI
Finance
- Other: Property contains 2 units; Sellers' personal property excluded
Exterior
- Parking: 1 parking space
- Utilities: Municipal water; Municipal sewer
- Home design: 2-story duplex; Multi-family property
- Construction: Information source lists year built from assessor/public record
- Exterior features: Other exterior; Lot is approximately 0.08 acre (less than 1/2 acre); Zoned residential
Interior
- Kitchen: Unit 2 kitchen on upper level (approx. 7 x 5)
- Bedrooms: Unit 1: 1 bedroom; Unit 2: 1 bedroom (master on upper level, approx. 9 x 9)
- Bathrooms: Unit 1: 1 full bath; Unit 2: 1 full bath
- Interior features: Brick basement
Neighborhood map
What this means for you Summary
Snapshot
- This is a 2-bed/2.0-bath condo listed at $150k. Condition is rated poor.
Deal economics
- At list price, monthly cash flow is $222 ($3k/yr) — positive.
- The deal already cash-flows at list — no discount required.
- Meets the 1% rule at list price ($2k rent vs $150k).
- Cap rate 8.1% vs local median 5.1% in Milwaukee — top-decile yield for the area; either an underpriced asset or a hidden risk that comps aren't pricing in. Stress-test before assuming the spread holds.
Location & tenants
- Location reads 81/100 on livability (#55 in WI, #1,534 nationally) — a professional / high-income tenant draw. Strengths: amenities A+, commute A+, cost of living A+; Watch: employment D+, schools F, crime F.
- Milwaukee School District (urban): math 10% / reading 18% proficiency, ranked #337 of 342 in WI (top 98%) — low school quality limits family demand, transient renter base, plan for 1-2y turnover; 77% free/reduced lunch — lower-income household profile, screen leases tightly.
- Market conditions: Rents rising (+2.4%/yr); 91 active listings in the ZIP; 16 comparable units currently listed for rent nearby; rentals at typical pace (median 24d on market — plan ~3-4 weeks tenant-placement turnaround); 44% of comp listings sitting > 30 days — soft ceiling on asking rent; solid renter incomes; 1,017 units permitted in Milwaukee County in 2024 (803 in 5+ unit buildings).
Forward outlook
- Local home prices are declining (-3.0%/yr); year-one equity from $1k of loan paydown is wiped out by about $4k of value loss. Plan a longer hold.
- Milwaukee County population projected at +4% by 2050 — modest demand growth; plan on rents tracking national, not racing it.
Negotiation context
- Only 1 days on market — expect competitive offers; lowballing is unlikely to land.
Risks & watch-outs
- Watch-outs: built in 1898 — expect roof / HVAC / electrical / plumbing capex.
Questions for the listing agent
- Have any recent inspections been done? Can we get a copy of the seller's disclosures and any deferred-maintenance estimates?
- Built in 1898 — when were the roof, HVAC, electrical panel, plumbing, and water heater last replaced?
- Any open or pending special assessments — roof, HVAC, plumbing, elevator, façade? What's the per-unit balance and payoff schedule, and is the seller paying it off at close or rolling it to the buyer?
- Is there a deadline driving the sale (1031 exchange, divorce, estate, relocation)? That informs how much negotiation room exists.
- Schools are F-rated, which usually means shorter tenancies and higher turnover. Who's the typical renter profile here, and what's been the actual vacancy rate?
- Crime grade is F in this area — have there been break-ins, vandalism, or insurance claims at this property in the last 3 years? What carrier currently insures it and at what premium?
- What's the average days-on-market for RENTAL listings here right now (not sales)? A rising rental-DOM trend means longer vacancies and softer asking-rent achievability than the comps imply.
- What's the recent tenant-quality profile in this submarket — average credit score on applications, eviction rate, late-payment / NSF rate, and stable-employment percentage? A property-management company in the area should have these aggregated.
- How much new apartment / multifamily construction is in the pipeline within 1–3 miles? Heavy new supply (>2% of stock underway) typically softens rents 12–24 months out; light construction supports rent growth.
Investment metrics
- 1% rule
- 1.06% ✓
- Cap rate
- 8.07%
- Cash-on-cash
- 6.33%
- DSCR
- 1.28
- GRM
- 7.8
CMA / ARV
- ARV (on-the-fly)
- $346,632
- Comps found
- 2
Show comp detail 2 sales within ~0.75 mi
| Address | Dist | Beds/Ba | Sqft | Sold | Price | $/sf | Match |
|---|---|---|---|---|---|---|---|
| 132 E Rosedale Ave #134 | 0.00mi | 2/2.0 | 1,313 (0%) | 0mo | $155,000 | $118 | 100 |
| 602 E Dover St Unit 602A | 0.41mi | 3/2.0 (+1) | 1,444 (+10%) | 21mo | $381,000 | $264 | 42 |
Match score weights: distance 35% · size 25% · config 20% · recency 20%. Top-matched comps best support the ARV.
Projected returns pro-forma
-3.0% appreciation · 2.39% rent growth · sell at horizon
- IRR
- -7.2%
- Equity multiple
- 0.73×
- Total profit
- $-11,129
- Equity at exit
- $22,351
- IRR
- 1.6%
- Equity multiple
- 1.11×
- Total profit
- $4,638
- Equity at exit
- $12,961
Cash invested: $41,972 (down + closing). Projections, not guarantees.
Landlord ↔ Tenant lean methodology
- Overall (STATE)
- 73 Landlord-Friendly
- State Wisconsin
- 73 Landlord-Friendly · R+2
- County
- — inherits STATE
- City
- — inherits STATE
ZIP-level market 53207
- Rents YoY
- 2.4%
- Active inventory
- 91
- Price-to-rent
- 7.8×
Monthly cashflow live
- Estimated rent
- $1,592 high interval (Pro) →
- Mortgage (P&I)
- −$786
- Tax est. 1.5%
- −$187 /mo · $2,248/yr
- Insurance
- −$62
- HOA
- −$0
- Vacancy / Maint / Mgmt
- −$334
- Net cashflow
- $222
Break-even live
UW: 25.0% down · 7.5% · 30yr · 1.5% tax · 5.0% vac · 8.0% maint · 8.0% mgmt
Financing live
Cash to close
- Down payment
- $37,475
- Closing costs
- $4,497
- Reserves months
- —
- Total cash needed
- —
Loan-product check · same deal, 3 products live
Conventional
25% down · 7.5% · 30yr
- Down + closing
- —
- Monthly P&I
- —
- Monthly cashflow
- —
- DSCR
- —
- Eligible?
- —
Personal DTI + credit; lowest rate.
DSCR
20% down · 8.5% · 30yr
- Down + closing
- —
- Monthly P&I
- —
- Monthly cashflow
- —
- DSCR
- —
- Eligible?
- —
No personal income docs; deal must DSCR.
Hard money
10% down · 12.0% · 12mo
- Down + closing
- —
- Monthly P&I
- —
- Monthly cashflow
- —
- DSCR
- —
- Eligible?
- —
Short-term bridge; refi at stabilization.
Rent comps 16 comps
| Address | Beds | Baths | Sqft | Rent | $/sqft | DOM | Units | Dist |
|---|---|---|---|---|---|---|---|---|
| 2445 S Austin St Milwaukee, WI | 3.0 | 1.0 | 1000 | $1,598 | $1.60 | 14d | 1 | 0.38mi |
| 2437 S Howell Ave Unit 2nd Milwaukee, WI | 3.0 | 1.0 | 1550 | $1,895 | $1.22 | 4d | 1 | 0.44mi |
| 2482 S 5th St Milwaukee, WI | 2.0 | 1.0 | 900 | $1,095 | $1.22 | 24d | 1 | 0.47mi |
| 2562 S 9th St Milwaukee, WI | 2.0 | 1.0 | 1000 | $995 | $0.99 | 44d | 1 | 0.65mi |
| 923 E Otjen St Milwaukee, WI | 3.0 | 2.0 | 1451 | $3,175 | $2.19 | 44d | 1 | 0.68mi |
| 2614 S Logan Ave Unit 2614 Milwaukee, WI | 2.0 | 1.0 | 1200 | $1,350 | $1.12 | 17d | 1 | 0.70mi |
| 2141 S Robinson Ave Milwaukee, WI | 3.0 | 1.0–2.0 | 1006 | $2,272 | $2.26 | 2d | 20 | 0.72mi |
| 2435 S 9th St Unit 2435A Milwaukee, WI | 2.0 | 1.0 | 900 | $1,025 | $1.14 | 44d | 1 | 0.75mi |
| 2435 S 9th St Milwaukee, WI | 2.0 | 1.0 | 900 | $895 | $0.99 | 24d | 1 | 0.75mi |
| 2435 S 9th St Unit 2435 Milwaukee, WI | 2.0 | 1.0 | 900 | $895 | $0.99 | 44d | 1 | 0.75mi |
| 2252 S 7th St Unit Upper Front Milwaukee, WI | 2.0 | 1.0 | 900 | $1,200 | $1.33 | 44d | 1 | 0.77mi |
| 2460 S Delaware Ave Unit 1 Milwaukee, WI | 2.0 | 1.0 | 1100 | $1,600 | $1.45 | 44d | 1 | 0.94mi |
| 1304 E Potter Ave Milwaukee, WI | 2.0 | 1.0 | 900 | $1,650 | $1.83 | 44d | 1 | 0.94mi |
| 1301 E Oklahoma Ave Unit 2 Milwaukee, WI | 2.0 | 1.0 | 1000 | $3,200 | $3.20 | 2d | 1 | 0.99mi |
| 1812 S 7th St Milwaukee, WI | 3.0 | 1.5 | 1703 | $2,100 | $1.23 | 24d | 1 | 1.19mi |
| 3756 S Whitnall Ave Unit Lower Duplex Milwaukee, WI | 2.0 | 1.5 | 900 | $1,850 | $2.06 | 2d | 1 | 1.32mi |
HOA detail condo
- Monthly dues
- $0 · $0/yr
- Assessments
- None detected in remarks — confirm with the listing agent.
Listing history 1 events
-
2026-05-24$149,900 Active
ⓘ Source: listings_history table (triggers on properties + properties_extension) + one-shot
backfill from property_details.listing_events for pre-trigger history.
Climate risk First Street
- Flood 1/10 Low FEMA zone X (unshaded) · 0% chance over 30 yrs
- Wildfire 1/10 Low
- Heat 2/10 Low 7 d/yr ≥96°F today · 13 d/yr by 30 yrs out
- Wind 2/10 Low
- Air quality 3/10 Moderate 3 unhealthy d/yr today · 3 by 30 yrs out
Nearby sold comps map
Loading sold comps map…
Walkable amenities ~0.75 mi
Loading nearby amenities…
Taxation est. · year 1
- Rental income
- $19,100
- − Mortgage interest
- −$8,397
- − Property taxes
- −$2,248
- − Insurance
- −$750
- − Repairs & maintenance
- −$1,528
- − Management
- −$1,528
- − Depreciation
- −$4,361
- Taxable income
- $289
- Est. tax owed @ 24.0%
- −$69
- After-tax cash flow
- $2,589/yr
For passive investors: Depreciation is non-cash, so a rental often shows a tax loss while cash-flowing — sheltering income. Rental losses are passive: they offset passive income freely, and up to $25,000/yr can offset ordinary (W-2) income if you actively participate and your MAGI is under $100k (phasing out to $0 by $150k); unused losses carry forward. On sale, claimed depreciation is recaptured at up to 25%, and gains may owe capital-gains tax (a 1031 exchange can defer both). Figures are a year-1 estimate at your 24.0% rate — not tax advice; consult a CPA.
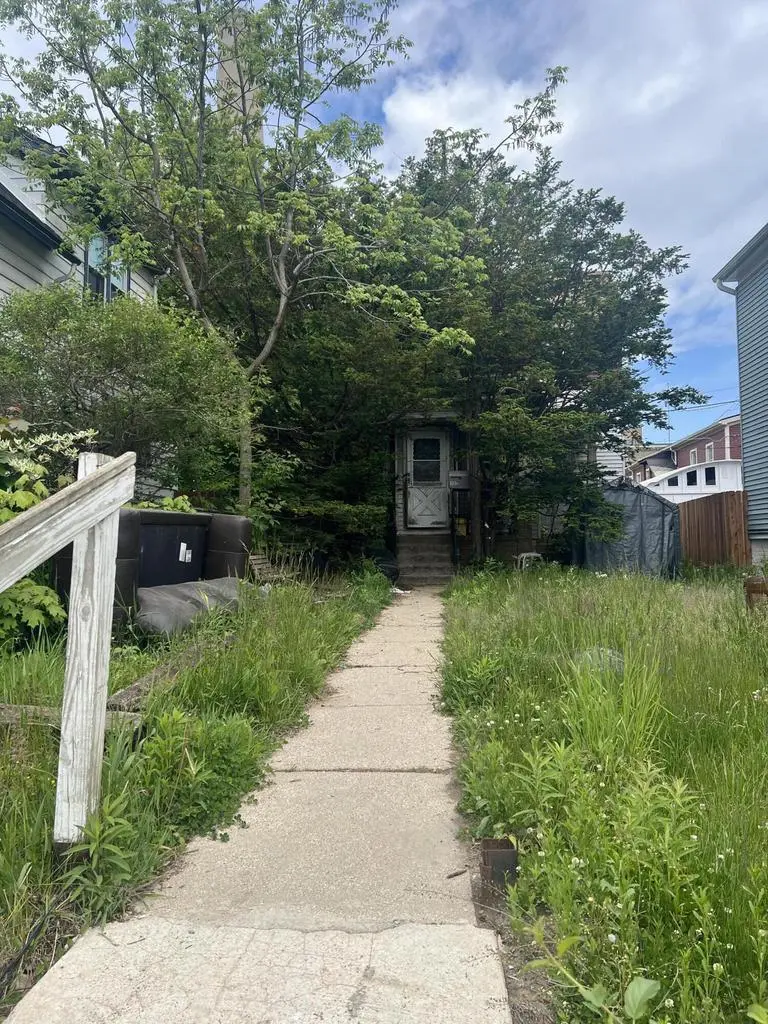
Condition & rehab AI · 1 photo
This Bay View duplex has been used as a single-family home for over 40 years and requires extensive renovations, including landscaping and exterior painting, to improve its resale and rental value.
Repairs flagged
- Major front yard landscaping — The front yard is overgrown and needs significant landscaping to improve curb appeal.
- Major backyard concrete slab — The back yard has a concrete slab with no visible landscaping, which could be improved with a garden or patio area.
Value-add opportunities
- Both landscaping and curb appeal improvements — Improving the front yard and back yard with landscaping would enhance the home's appearance and attract potential buyers or renters.
- Both exterior painting — Painting the exterior could improve the home's curb appeal and make it more attractive to potential buyers or renters.
Renovation cost estimate screening
| Repair item | Severity | Est. cost |
|---|---|---|
| front yard landscaping · The front yard is overgrown and needs significant landscaping to improve curb appeal. | Major | $15,000–50,000 |
| backyard concrete slab · The back yard has a concrete slab with no visible landscaping, which could be improved with a garden or patio area. | Major | $15,000–50,000 |
| Total estimated repair cost · 2 items | $30,000–100,000 |
Value-add ROI direction
- Both landscaping and curb appeal improvements — Improving the front yard and back yard with landscaping would enhance the home's appearance and attract potential buyers or renters. ↑
- Both exterior painting — Painting the exterior could improve the home's curb appeal and make it more attractive to potential buyers or renters. ↑
ⓘ Cost ranges are severity-bucket heuristics (US national rule-of-thumb). Get contractor quotes + a written scope before underwriting a rehab budget.
Schools (NCES district)
- District
- Milwaukee School District
- NCES district ID
- 5509600
- Math proficiency
- 10% ▼ -5.00%
- Reading proficiency
- 18% ▬ 0.00%
- Median HH income
- $36,339
- Composite
- 11.61/100
- National rank
- #9696
- State rank
- #337 of 342 in WI
Livability — Milwaukee
- Score
- 81/100
- State rank
- #55
- US rank
- #1534
Category grades
Schools grade is shown separately in the Schools card above.
Census & demographics
- Census place
- Milwaukee, WI
- County
- Milwaukee County · 926,379 people
- City population
- 573,768
- Metro
- Milwaukee-Waukesha, WI
- Population (ZIP)
- 34,313
- Household income
- $79,117
- Rent vs Own
- Severe rent burden
- 821.0
Population outlook (Milwaukee County) Hauer SSP2
- Today (2025)
- 995,758 people
- By 2030
- 1,009,124 · +1.3%
- By 2040
- 1,028,128 · +3.3%
- By 2050
- 1,040,066 · +4.4%
- By 2075
- 1,057,849 · +6.2%
- By 2100
- 1,039,774 · +4.4%
Race, ethnicity, and origin ACS 2023
- Neighborhood character
- Predominantly White (74%)
- Race & ethnicity
- White 74% Hispanic / Latino 16% Two or more races 10% Black 5% Asian 1%
- Hispanic origin (detail)
- Mexican 10% Puerto Rican 5%
- Common ancestry
- Romanian 15% Portuguese 4% Italian 3%
- Foreign-born
- 5% · Canada
- Languages at home
- 89% English-only · Spanish 9% German/W. Germanic 1%
Political lean MEDSL · Milwaukee
- 2024 margin
- Solid D (+38.5) · D 68.3% · R 29.8% · Other 1.8%
- 2008→2024 swing
- +2.7pp toward D · 2008: 35.9pp · 2024: 38.5pp
- All cycles
- 2024: D+38.5 2020: D+39.9 2016: D+37.5 2012: D+34.6 2008: D+35.9
Not yet ingested
- Civics
- —
Market trends
- HPI YoY
- ▼ -261.93%
- Current HPI
- 324.5284
- Rent YoY
- ▲ 2.39%
- Metro
- Milwaukee-Waukesha, WI
- State GDP YoY
- ▲ 2.10%
- F500 in state
- 20
Industry mix (Fortune 500 HQ in WI)
| Industry | F500 HQs | Revenue |
|---|---|---|
| Industrial Machinery | 4 | $23B |
|
||
| Industrial Technology | 2 | $36B |
|
||
| Insurance | 1 | $36B |
|
||
| Professional Services | 1 | $19B |
|
||
| Utilities | 1 | $9B |
|
||
| Consumer Goods | 1 | $3B |
|
||
Price history
1 event — show timeline
- 2026-05-24 Listed $149,900 METROMLS
Cash-flow waterfall
monthlySold comps — $/sqft
last 12 mo · ≤1 miLoading sold comps…