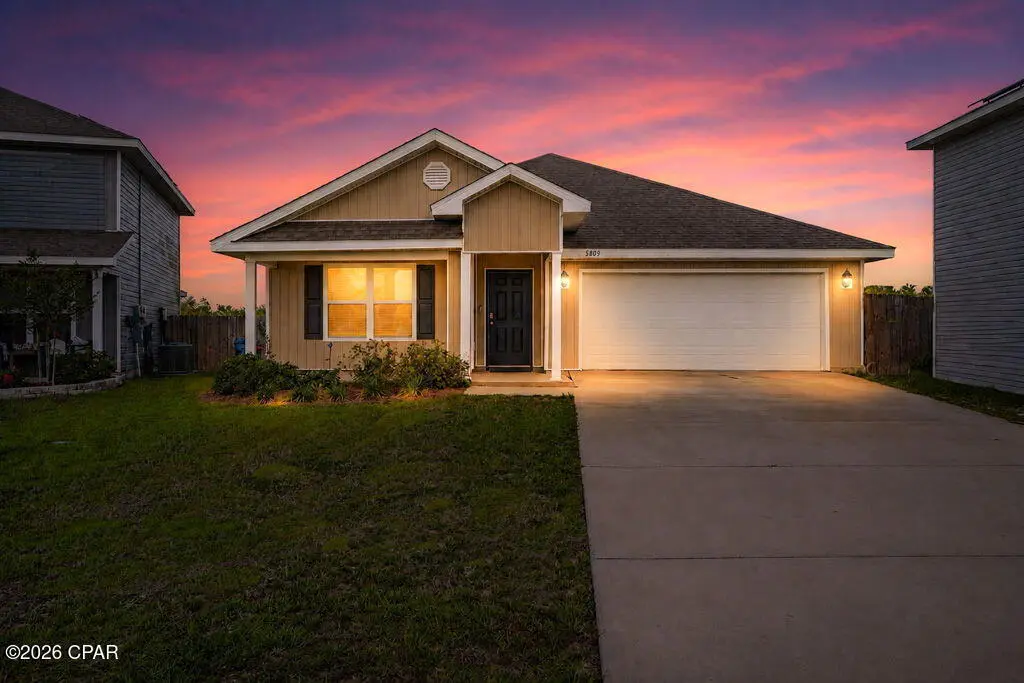
5809 Tiagra Dr · Panama City, FL
Flood risk 1/10 · Minimal
- FEMA flood zone
- X (unshaded)
- Chance of flooding over 30 yrs
- 0.0%
- Est. flood insurance / yr
- $507 – $1,088
Fire risk 6/10 · Moderate
- Est. fire insurance / yr
- $947 – $1,759
Heat risk 9/10 · Severe
- Hot days now (above 104°F)
- 7 days/yr
- Hot days in 30 yrs
- 21 days/yr
Wind risk 9/10 · Severe
- Chance of severe wind over 30 yrs
- 99.0%
Air-quality risk 2/10 · Minimal
- Unhealthy air days now
- 1 days/yr
- Unhealthy air days in 30 yrs
- 1 days/yr
Risk factors via First Street. Map © Google.
Why this score? — see what drove the D- grade
The composite is a weighted blend of 9 inputs, each scored 0–100. Each bar is that input's sub-score; the figure is the points it added to the 100-point composite (weight × sub-score).
- Cash flow +12.2/30.0
- ARV discount +7.4/15.0
- Schools +4.3/10.0
- DSCR +3.6/10.0
- Livability +3.6/5.0
- 1% rule +2.8/10.0
- Rent growth +2.8/5.0
- Condition / age +2.5/5.0
- Appreciation +0.0/10.0
$299,500
🖨 Deal sheet (PDF) 📄 Offer letter ✓ Due diligence
Listing remarks
Located in one of Panama City's most desirable and growing residential communities, this home offers the perfect blend of comfort, convenience, and Florida Gulf Coast living. This beautifully situated home provides an inviting atmosphere ideal for families, professionals, or anyone looking to enjoy a peaceful neighborhood while remaining close to everything Panama City has to offer. From the moment you arrive, the property stands out with its welcoming curb appeal and prime location within a quiet, well-maintained community. Inside, the home offers the space, functionality, and warmth that today's buyers are searching for, creating the ideal setting for everyday living and entertaining alik
Key facts
- 0.25 acre lot
- 2 garage spots
- Built 2022
Property features AI
Finance
- Financial info: Property has a land lease (expires 2026-06-30)
- HOA & community: Homeowners association present
Exterior
- Parking: Has garage; 2-car garage
- Utilities: Public sewer; Cable connected; High-speed internet available
- Home design: Vinyl siding exterior
- Construction: Composition / shingle roof; Slab foundation; Vinyl siding construction; Mobile dimensions reported in feet
- Exterior features: Covered porch; Fenced yard; Paved lot; Located on a cul-de-sac
Interior
- Kitchen: Electric oven; Electric range
- Bedrooms: Four bedrooms on the first level
- Bathrooms: Two full bathrooms
- Heating & cooling: Central heating (heat pump); Central air (heat pump)
- Interior features: Total of 8 rooms; Dining room; Living room; Covered porch
- Laundry & utility: Electric water heater
Neighborhood map
What this means for you Summary
Snapshot
- This is a 4-bed/2.0-bath single-family listed at $300k.
Deal economics
- At list price, monthly cash flow is $-60 ($-725/yr) — negative.
- To cash-flow at today's rent, offer at most $289k (3.6% below list).
- To meet the 1% rule (rent ≥ 1% of price), the offer needs to be $233k (22.1% below list).
- Recommended offer: $233k (22.1% below list) — sets the bar for 1% rule.
- Cap rate 6.1% vs local median 4.7% in Panama City — meaningfully above typical; check what's discounted (condition, days-on-market, listing class) to confirm the premium yield is real.
Location & tenants
- Location reads 72/100 on livability (#350 in FL) — a middle-class / working-renter tenant base. Strengths: cost of living A+, housing A+, health & safety A+; Watch: crime F, amenities F, commute F.
- Bay (suburban): math 51% / reading 51% proficiency, ranked #29 of 73 in FL (top 40%) — acceptable for families but not a draw, mixed tenant base, ~2y average lease.
- Zoned schools: Tommy Smith Elementary School (math 46% / reading 51%, grade D, #1,152 of 2,144 statewide, top 55%, 639 students, 53% FRL); Merritt Brown Middle School (math 38% / reading 38%, grade F, #388 of 571 statewide, top 69%, 701 students, 55% FRL); Rutherford High School (math 24% / reading 29%, grade F, #489 of 667 statewide, top 74%, 1,337 students, 63% FRL).
- Zoned-school proficiency averages 38% at this address vs 51% district-wide (-13 pts) — the specific schools serving this property underperform the Bay average; the district grade overstates school quality for this exact location.
- Market conditions: Rents rising (+1.1%/yr); 983 active listings in the ZIP; 1 comparable units currently listed for rent nearby; 2,473 units permitted in Bay County in 2024 (559 in 5+ unit buildings).
- This rent runs 37% of the median local income ($75k/yr) — at the standard rent-burdened threshold; future hikes will face affordability resistance.
Forward outlook
- Local home prices are declining (-3.0%/yr); year-one equity from $2k of loan paydown is wiped out by about $9k of value loss. Plan a longer hold.
- Bay County population projected at +24% by 2050 — long-run rental-demand tailwind backs the buy-and-hold thesis.
Negotiation context
- It's been on market 31 days — a 3% lower offer ($291k) is reasonable based on typical stale-listing flexibility.
Risks & watch-outs
- Climate carrying-cost: severe wind risk, 99% chance of damaging wind over 30y; major wildfire risk; extreme-heat days projected 7→21/yr by 2055 (HVAC capex compounding) — expect insurance premiums to compound above CPI over the hold.
Questions for the listing agent
- What do current leases actually rent for vs. the listed asking? Can we see a recent rent roll and the last 12 months of T-12 income?
- It's been on market 31 days. Have you received any prior offers? Is the seller open to a 22% concession, seller financing, or rate buy-down credit?
- Is there a deadline driving the sale (1031 exchange, divorce, estate, relocation)? That informs how much negotiation room exists.
- Schools are B-rated — typically a magnet for longer-tenancy family renters. What's the average tenant stay here, and is there a school-zone premium baked into asking?
- Crime grade is F in this area — have there been break-ins, vandalism, or insurance claims at this property in the last 3 years? What carrier currently insures it and at what premium?
- The area grade is low — what's the realistic commute time and amenity access for the typical tenant pool here? Any planned neighborhood developments (good or bad) we should know about?
- What's the average days-on-market for RENTAL listings here right now (not sales)? A rising rental-DOM trend means longer vacancies and softer asking-rent achievability than the comps imply.
- What's the recent tenant-quality profile in this submarket — average credit score on applications, eviction rate, late-payment / NSF rate, and stable-employment percentage? A property-management company in the area should have these aggregated.
- How much new for-sale + rental construction is in the pipeline within 1–3 miles? Heavy new supply typically softens prices + rents 12–24 months out; constrained supply supports both.
Investment metrics
- 1% rule
- 0.78% ✗
- Cap rate
- 6.05%
- Cash-on-cash
- -0.86%
- DSCR
- 0.96
- GRM
- 10.7
CMA / ARV
- ARV (on-the-fly)
- $298,596
- Comps found
- 12
Show comp detail 12 sales within ~0.75 mi
| Address | Dist | Beds/Ba | Sqft | Sold | Price | $/sf | Match |
|---|---|---|---|---|---|---|---|
| 5817 Tiagra Dr | 0.02mi | 4/2.0 | 1,787 (-0%) | 2mo | $342,750 | $192 | 98 |
| 7304 Ellie B Dr | 0.20mi | 4/2.0 | 1,788 (0%) | 0mo | $258,000 | $144 | 90 |
| 7106 Penn Way | 0.24mi | 4/2.0 | 1,789 (+0%) | 2mo | $275,000 | $154 | 87 |
| 7141 Hatteras Blvd | 0.17mi | 4/2.0 | 1,813 (+1%) | 6mo | $292,500 | $161 | 85 |
| 5821 Viking Way | 0.17mi | 4/2.0 | 1,827 (+2%) | 4mo | $305,000 | $167 | 85 |
| 7229 Ellie B | 0.22mi | 4/2.0 | 1,787 (-0%) | 11mo | $305,000 | $171 | 81 |
| 5918 Nordic Dr | 0.40mi | 4/2.0 | 1,768 (-1%) | 7mo | $279,900 | $158 | 74 |
| 7121 Riverbrooke St | 0.58mi | 4/2.0 | 1,768 (-1%) | 2mo | $290,000 | $164 | 70 |
| 7121 Shimano Way | 0.12mi | 3/2.0 (-1) | 1,538 (-14%) | 5mo | $275,000 | $179 | 62 |
| 5536 Lexa Ln | 0.48mi | 4/2.0 | 1,620 (-9%) | 4mo | $290,000 | $179 | 58 |
| 5240 Salvation St | 0.67mi | 3/2.0 (-1) | 1,711 (-4%) | 1mo | $351,437 | $205 | 55 |
| 7112 Riverbrooke St | 0.54mi | 3/2.0 (-1) | 1,618 (-10%) | 6mo | $255,000 | $158 | 49 |
Match score weights: distance 35% · size 25% · config 20% · recency 20%. Top-matched comps best support the ARV.
Projected returns pro-forma
-3.0% appreciation · 1.12% rent growth · sell at horizon
- IRR
- -19.7%
- Equity multiple
- 0.32×
- Total profit
- $-56,779
- Equity at exit
- $44,656
- IRR
- -16.7%
- Equity multiple
- 0.14×
- Total profit
- $-71,787
- Equity at exit
- $25,895
Cash invested: $83,860 (down + closing). Projections, not guarantees.
Landlord ↔ Tenant lean methodology
- Overall (STATE)
- 87 Strongly Landlord-Friendly
- State Florida
- 87 Strongly Landlord-Friendly · R+3
- County
- — inherits STATE
- City
- — inherits STATE
ZIP-level market 32404
- Home prices YoY
- -16.1%
- Rents YoY
- 1.1%
- Active inventory
- 983
- Price-to-rent
- 10.7×
Monthly cashflow live
- Estimated rent
- $2,333 medium interval (Pro) →
- Mortgage (P&I)
- −$1,571
- Tax from tax record
- −$208 /mo · $2,498/yr
- Insurance
- −$125
- HOA
- −$0
- Lot rent
- −$0
- Vacancy / Maint / Mgmt
- −$490
- Net cashflow
- $-60
Break-even live
Sensitivity live
| Price | -10% $109 | -5% $24 | +0% $-60 | +5% $-145 | +10% $-230 |
|---|---|---|---|---|---|
| Rent | -10% $-245 | -5% $-153 | +0% $-60 | +5% $32 | +10% $124 |
| Rate | -1.0pp $90 | -0.5pp $16 | base $-60 | +0.5pp $-138 | +1.0pp $-217 |
UW: 25.0% down · 7.5% · 30yr · 1.5% tax · 5.0% vac · 8.0% maint · 8.0% mgmt
Financing live
Cash to close
- Down payment
- $74,875
- Closing costs
- $8,985
- Reserves months
- —
- Total cash needed
- —
Loan-product check · same deal, 3 products live
Conventional
25% down · 7.5% · 30yr
- Down + closing
- —
- Monthly P&I
- —
- Monthly cashflow
- —
- DSCR
- —
- Eligible?
- —
Personal DTI + credit; lowest rate.
DSCR
20% down · 8.5% · 30yr
- Down + closing
- —
- Monthly P&I
- —
- Monthly cashflow
- —
- DSCR
- —
- Eligible?
- —
No personal income docs; deal must DSCR.
Hard money
10% down · 12.0% · 12mo
- Down + closing
- —
- Monthly P&I
- —
- Monthly cashflow
- —
- DSCR
- —
- Eligible?
- —
Short-term bridge; refi at stabilization.
Rent comps 1 comps
| Address | Beds | Baths | Sqft | Rent | $/sqft | DOM | Units | Dist |
|---|---|---|---|---|---|---|---|---|
| 5832 Viking Way Panama City, FL | 5.0 | 3.0 | 2593 | $2,595 | $1.00 | 15d | 1 | 0.22mi |
Listing history 19 events
-
2026-06-21days on market $299,500 Active 31 DOM
-
2026-06-19days on market $299,500 Active 29 DOM
-
2026-06-18days on market $299,500 Active 28 DOM
-
2026-06-17days on market $299,500 Active 27 DOM
-
2026-06-16days on market $299,500 Active 26 DOM
-
2026-06-15days on market $299,500 Active 25 DOM
-
2026-06-14days on market $299,500 Active 23 DOM
-
2026-06-13pricedays on market $299,500 Active 22 DOM
-
2026-06-10days on market $308,000 Active 20 DOM
-
2026-06-09days on market $308,000 Active 19 DOM
-
2026-06-08days on market $308,000 Active 18 DOM
-
2026-06-07days on market $308,000 Active 17 DOM
-
2026-06-05days on market $308,000 Active 14 DOM
-
2026-06-03days on market $308,000 Active 13 DOM
-
2026-06-02days on market $308,000 Active 12 DOM
-
2026-06-01days on market $308,000 Active 11 DOM
-
2026-05-31days on market $308,000 Active 10 DOM
-
2026-05-30days on market $308,000 Active 9 DOM
-
2026-05-21$308,000 Active
ⓘ Source: listings_history table (triggers on properties + properties_extension) + one-shot
backfill from property_details.listing_events for pre-trigger history.
Tax reassessment forecast FL · Resets to sale price
- Current annual tax
- $2,498 · $208/mo
- Projected year-2 tax
- $2,498 · $208/mo
- Expected delta
- $0/yr ($0/mo · -0.0%)
ⓘ Screening estimate from a state-policy table — verify with the county assessor before closing.
Climate risk First Street
- Flood 1/10 Low FEMA zone X (unshaded) · 0% chance over 30 yrs
- Wildfire 6/10 Major
- Heat 9/10 Extreme 7 d/yr ≥104°F today · 21 d/yr by 30 yrs out
- Wind 9/10 Extreme 99% chance of damaging wind over 30 yrs
- Air quality 2/10 Low 1 unhealthy d/yr today · 1 by 30 yrs out
Nearby sold comps map
Loading sold comps map…
Walkable amenities ~0.75 mi
Loading nearby amenities…
Taxation est. · year 1
- Rental income
- $27,997
- − Mortgage interest
- −$16,777
- − Property taxes
- −$2,498
- − Insurance
- −$1,498
- − Repairs & maintenance
- −$2,240
- − Management
- −$2,240
- − Depreciation
- −$8,713
- Taxable loss
- −$5,967
- Est. tax savings @ 24.0%
- +$1,432
- After-tax cash flow
- $707/yr
For passive investors: Depreciation is non-cash, so a rental often shows a tax loss while cash-flowing — sheltering income. Rental losses are passive: they offset passive income freely, and up to $25,000/yr can offset ordinary (W-2) income if you actively participate and your MAGI is under $100k (phasing out to $0 by $150k); unused losses carry forward. On sale, claimed depreciation is recaptured at up to 25%, and gains may owe capital-gains tax (a 1031 exchange can defer both). Figures are a year-1 estimate at your 24.0% rate — not tax advice; consult a CPA.
Schools (NCES district)
- District
- Bay
- NCES district ID
- 1200090
- Math proficiency
- 51% ▼ -8.00%
- Reading proficiency
- 51% ▼ -7.00%
- Median HH income
- $47,740
- Composite
- 43.41/100
- National rank
- #3014
- State rank
- #29 of 73 in FL
Livability — Panama City
- Score
- 72/100
- State rank
- #350
- US rank
- #5823
Category grades
Schools grade is shown separately in the Schools card above.
Census & demographics
- County
- Bay County · 163,593 people
- City population
- 91,445
- Metro
- Panama City, FL
- Population (ZIP)
- 42,514
- Household income
- $74,708
- Rent vs Own
- Severe rent burden
- 1218.0
Population outlook (Bay County) Hauer SSP2
- Today (2025)
- 206,264 people
- By 2030
- 217,740 · +5.6%
- By 2040
- 238,738 · +15.7%
- By 2050
- 255,545 · +23.9%
- By 2075
- 288,295 · +39.8%
- By 2100
- 288,638 · +39.9%
Race, ethnicity, and origin ACS 2023
- Neighborhood character
- Predominantly White (69%)
- Race & ethnicity
- White 69% Black 12% Two or more races 10% Hispanic / Latino 9% Asian 3%
- Hispanic origin (detail)
- Mexican 2% Puerto Rican 3%
- Common ancestry
- Lithuanian 3% Slovak 2% Italian 2%
- Foreign-born
- 7% · Canada, Vietnam, Mexico
- Languages at home
- 90% English-only · Spanish 6% Vietnamese 1% Other Asian/Pacific 1%
Political lean MEDSL · Bay
- 2024 margin
- Solid R (+47.4) · D 25.8% · R 73.1% · Other 1.1%
- 2008→2024 swing
- -6.6pp toward R · 2008: -40.7pp · 2024: -47.4pp
- All cycles
- 2024: R+47.4 2020: R+43.5 2016: R+46.3 2012: R+43.6 2008: R+40.7
Not yet ingested
- Civics
- —
Market trends
- HPI YoY
- ▼ -50.59%
- Current HPI
- 263.7178
- Rent YoY
- ▲ 1.12%
- Metro
- Panama City, FL
- State GDP YoY
- ▲ 3.28%
- F500 in state
- 36
Industry mix (Fortune 500 HQ in FL)
| Industry | F500 HQs | Revenue |
|---|---|---|
| Industrial Technology | 2 | $29B |
|
||
| Insurance | 2 | $17B |
|
||
| Retail | 1 | $60B |
|
||
| Technology Distribution | 1 | $58B |
|
||
| Homebuilding | 1 | $35B |
|
||
| Technology Manufacturing | 1 | $35B |
|
||
Price history
-2.8% since first listed2 events — show timeline
- 2026-06-12 Price Changed $299,500 CPARMLS
- 2026-05-21 Listed $308,000 CPARMLS
Property tax history
+53.9%/yrLatest (2025): $2,498 · -3.6% YoY. Source: county tax records.
Cash-flow waterfall
monthlySold comps — $/sqft
last 12 mo · ≤1 miLoading sold comps…