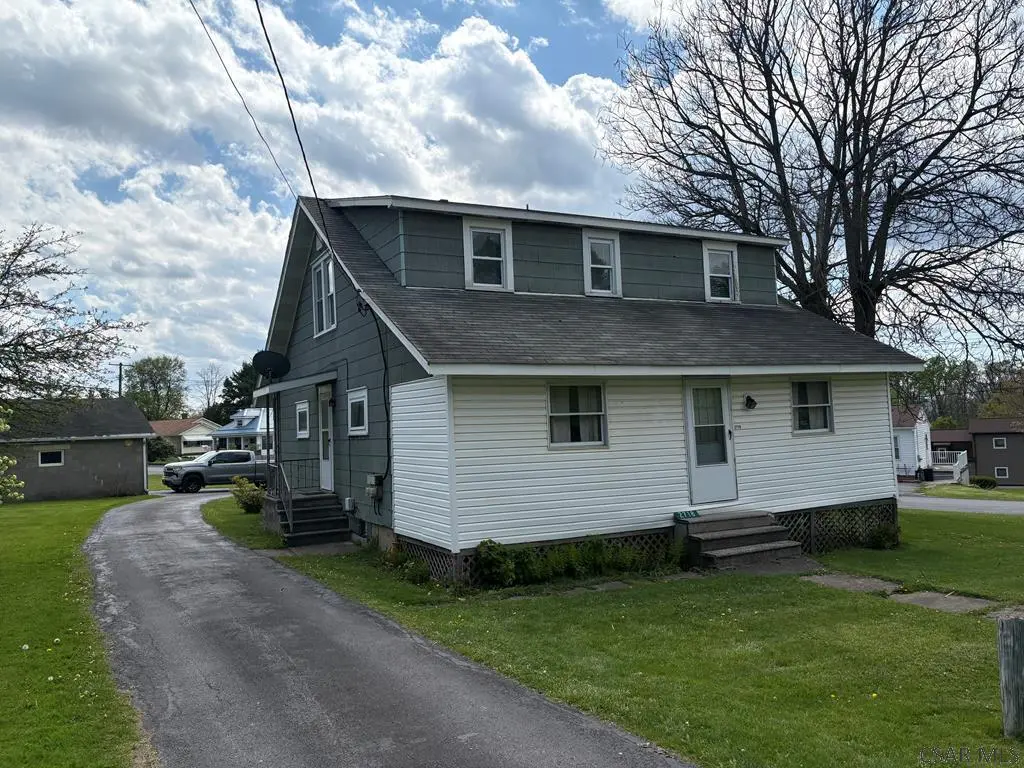
2718 Bedford St · Geistown, PA
Flood risk 1/10 · Minimal
- FEMA flood zone
- X (unshaded)
- Chance of flooding over 30 yrs
- 0.0%
- Est. flood insurance / yr
- $473 – $860
Fire risk 1/10 · Minimal
- Est. fire insurance / yr
- $511 – $949
Heat risk 2/10 · Minimal
- Hot days now (above 91°F)
- 7 days/yr
- Hot days in 30 yrs
- 17 days/yr
Wind risk 2/10 · Minimal
- Chance of severe wind over 30 yrs
- —
Air-quality risk 2/10 · Minimal
- Unhealthy air days now
- 1 days/yr
- Unhealthy air days in 30 yrs
- 2 days/yr
Risk factors via First Street. Map © Google.
Why this score? — see what drove the C+ grade
The composite is a weighted blend of 9 inputs, each scored 0–100. Each bar is that input's sub-score; the figure is the points it added to the 100-point composite (weight × sub-score).
- Cash flow +25.8/30.0
- DSCR +8.6/10.0
- ARV discount +7.5/15.0
- 1% rule +6.8/10.0
- Schools +5.5/10.0
- Livability +3.9/5.0
- Rent growth +2.5/5.0
- Condition / age +2.5/5.0
- Appreciation +0.0/10.0
$135,000
🖨 Deal sheet 📄 Offer letter ✓ Due diligence
Listing remarks
Spacious Geistown 2 unit apartment. each unit has 2 bedrooms & 1 bath. This investment has a spacious rear deck and a 2 car garage. Richland Schools!! with an amazingly convenient location. This property has 2 extra lots that can be purchased with this property for an additional $35,000.
Key facts
- 0.43 acre lot
- Garage
- Listed 15 days
Property features AI
Finance
- Financial info: Property operated as residential income (multi-family); One unit currently rents for $750
Exterior
- Parking: Detached parking
- Security: Smoke detectors
- Utilities: Public sewer
- Home design: Multi-family residential property; Single-story building; Irregular lot; Corner lot location (Bedford and Euclid)
- Construction: Brick and vinyl siding exterior; Shingle roof
- Exterior features: Covered porch; Deck
Interior
- Kitchen: Refrigerator; Range; Oven
- Bedrooms: Two 2-bedroom units
- Flooring: Hardwood; Carpet; Wood
- Bathrooms: Each unit has 1 bathroom
- Heating & cooling: Coal heating; Natural gas heating; Hot water heating; Ceiling fans
- Interior features: Eat-in kitchen; Full basement
Neighborhood map
What this means for you Summary
Snapshot
- This is a 4-bed/2.0-bath single-family listed at $135k.
Deal economics
- At list price, monthly cash flow is $328 ($4k/yr) — positive.
- The deal already cash-flows at list — no discount required.
- Meets the 1% rule at list price ($2k rent vs $135k).
- Recommended offer: $133k (1.5% below list) — sets the bar for market timing.
Location & tenants
- Location reads 77/100 on livability (#332 in PA, #2,915 nationally) — a middle-class / working-renter tenant base. Strengths: crime A+, cost of living A+, housing A+; Watch: amenities F, commute F.
- Richland SD (suburban): math 57% / reading 72% proficiency, ranked #54 of 539 in PA (top 10%) — acceptable for families but not a draw, mixed tenant base, ~2y average lease; only 19% free/reduced lunch — higher-income household profile.
- Market conditions: 50 active listings in the ZIP; 64 units permitted in Cambria County in 2024 (0 in 5+ unit buildings).
Forward outlook
- Local home prices are declining (-3.0%/yr); year-one equity from $933 of loan paydown is wiped out by about $4k of value loss. Plan a longer hold.
- Cambria County population projected at -28% by 2050 — secular population decline; favor cash flow + early exit over multi-decade hold.
Negotiation context
- It's been on market 15 days — a 2% lower offer ($133k) is reasonable based on typical stale-listing flexibility.
- Current owner paid $57k; list at $135k implies a 137% gain — meaningful room to come down on a strong offer.
Risks & watch-outs
- Watch-outs: built in 1930 — expect roof / HVAC / electrical / plumbing capex.
Questions for the listing agent
- Built in 1930 — when were the roof, HVAC, electrical panel, plumbing, and water heater last replaced?
- Is there a deadline driving the sale (1031 exchange, divorce, estate, relocation)? That informs how much negotiation room exists.
- What's the average days-on-market for RENTAL listings here right now (not sales)? A rising rental-DOM trend means longer vacancies and softer asking-rent achievability than the comps imply.
- What's the recent tenant-quality profile in this submarket — average credit score on applications, eviction rate, late-payment / NSF rate, and stable-employment percentage? A property-management company in the area should have these aggregated.
- How much new for-sale + rental construction is in the pipeline within 1–3 miles? Heavy new supply typically softens prices + rents 12–24 months out; constrained supply supports both.
Investment metrics
- 1% rule
- 1.18% ✓
- Cap rate
- 9.21%
- Cash-on-cash
- 10.42%
- DSCR
- 1.46
- GRM
- 7.0
CMA / ARV
No comps found within radius.
Projected returns pro-forma
-3.0% appreciation · 3.0% rent growth · sell at horizon
- IRR
- -0.7%
- Equity multiple
- 0.98×
- Total profit
- $-937
- Equity at exit
- $20,129
- IRR
- 9.0%
- Equity multiple
- 1.69×
- Total profit
- $26,216
- Equity at exit
- $11,672
Cash invested: $37,800 (down + closing). Projections, not guarantees.
Landlord ↔ Tenant lean methodology
- Overall (STATE)
- 62 Landlord-Friendly
- State Pennsylvania
- 62 Landlord-Friendly · EVEN
- County
- — inherits STATE
- City
- — inherits STATE
ZIP-level market 15904
- Active inventory
- 50
- Price-to-rent
- 7.0×
Monthly cashflow live
- Estimated rent
- $1,598 medium interval (Pro) →
- Mortgage (P&I)
- −$708
- Tax from tax record
- −$170 /mo · $2,036/yr
- Insurance
- −$56
- HOA
- −$0
- Vacancy / Maint / Mgmt
- −$336
- Net cashflow
- $328
Break-even live
UW: 25.0% down · 7.5% · 30yr · 1.5% tax · 5.0% vac · 8.0% maint · 8.0% mgmt
Financing live
Cash to close
- Down payment
- $33,750
- Closing costs
- $4,050
- Reserves months
- —
- Total cash needed
- —
Loan-product check · same deal, 3 products live
Conventional
25% down · 7.5% · 30yr
- Down + closing
- —
- Monthly P&I
- —
- Monthly cashflow
- —
- DSCR
- —
- Eligible?
- —
Personal DTI + credit; lowest rate.
DSCR
20% down · 8.5% · 30yr
- Down + closing
- —
- Monthly P&I
- —
- Monthly cashflow
- —
- DSCR
- —
- Eligible?
- —
No personal income docs; deal must DSCR.
Hard money
10% down · 12.0% · 12mo
- Down + closing
- —
- Monthly P&I
- —
- Monthly cashflow
- —
- DSCR
- —
- Eligible?
- —
Short-term bridge; refi at stabilization.
Listing history 2 events
-
2026-05-04$135,000 Active 294-char remark
-
1980-02-01soldstatus $57,000
ⓘ Source: listings_history table (triggers on properties + properties_extension) + one-shot
backfill from property_details.listing_events for pre-trigger history.
Tax reassessment forecast PA · Partial reset (capped growth)
- Current annual tax
- $2,036 · $170/mo
- Projected year-2 tax
- $2,084 · $174/mo
- Expected delta
- +$49/yr (+$4/mo · 2.4%)
ⓘ Screening estimate from a state-policy table — verify with the county assessor before closing.
Climate risk First Street
- Flood 1/10 Low FEMA zone X (unshaded) · 0% chance over 30 yrs
- Wildfire 1/10 Low
- Heat 2/10 Low 7 d/yr ≥91°F today · 17 d/yr by 30 yrs out
- Wind 2/10 Low
- Air quality 2/10 Low 1 unhealthy d/yr today · 2 by 30 yrs out
Nearby sold comps map
Loading sold comps map…
Walkable amenities ~0.75 mi
Loading nearby amenities…
Taxation est. · year 1
- Rental income
- $19,173
- − Mortgage interest
- −$7,562
- − Property taxes
- −$2,036
- − Insurance
- −$675
- − Repairs & maintenance
- −$1,534
- − Management
- −$1,534
- − Depreciation
- −$3,927
- Taxable income
- $1,905
- Est. tax owed @ 24.0%
- −$457
- After-tax cash flow
- $3,483/yr
For passive investors: Depreciation is non-cash, so a rental often shows a tax loss while cash-flowing — sheltering income. Rental losses are passive: they offset passive income freely, and up to $25,000/yr can offset ordinary (W-2) income if you actively participate and your MAGI is under $100k (phasing out to $0 by $150k); unused losses carry forward. On sale, claimed depreciation is recaptured at up to 25%, and gains may owe capital-gains tax (a 1031 exchange can defer both). Figures are a year-1 estimate at your 24.0% rate — not tax advice; consult a CPA.
Schools (NCES district)
- District
- Richland SD
- NCES district ID
- 4220250
- Math proficiency
- 57% ▼ -4.00%
- Reading proficiency
- 72% ▼ -1.00%
- Median HH income
- $49,705
- Composite
- 54.72/100
- National rank
- #1322
- State rank
- #54 of 539 in PA
Livability — Geistown
- Score
- 77/100
- State rank
- #332
- US rank
- #2915
Category grades
Schools grade is shown separately in the Schools card above.
Census & demographics
- Census place
- Geistown, PA
- Population (ZIP)
- 16,283
Population outlook (Cambria County) Hauer SSP2
- Today (2025)
- 122,754 people
- By 2030
- 115,827 · -5.6%
- By 2040
- 101,309 · -17.5%
- By 2050
- 88,379 · -28.0%
- By 2075
- 65,237 · -46.9%
- By 2100
- 46,909 · -61.8%
Race, ethnicity, and origin ACS 2023
- Neighborhood character
- Predominantly White (93%)
- Race & ethnicity
- White 93% Two or more races 3% Hispanic / Latino 2% Black 2% Asian 1%
- Common ancestry
- Romanian 10% Slovak 2% Lithuanian 2%
- Foreign-born
- 2% · Canada
- Languages at home
- 97% English-only · Spanish 1% Other Indo-European 1%
Political lean MEDSL · Cambria
- 2024 margin
- Solid R (+39.7) · D 29.8% · R 69.5%
- 2008→2024 swing
- -40.4pp toward R · 2008: 0.7pp · 2024: -39.7pp
- All cycles
- 2024: R+39.7 2020: R+37.3 2016: R+37.8 2012: R+17.8 2008: D+0.7
Not yet ingested
- Civics
- —
Market trends
- HPI YoY
- ▼ -96.96%
- Current HPI
- 151.6715
- Rent YoY
- —
- Metro
- —
- State GDP YoY
- ▲ 1.68%
- F500 in state
- 34
Industry mix (Fortune 500 HQ in PA)
| Industry | F500 HQs | Revenue |
|---|---|---|
| Healthcare | 2 | $309B |
|
||
| Insurance | 2 | $27B |
|
||
| Telecommunications / Media | 1 | $124B |
|
||
| Industrial Distribution | 1 | $22B |
|
||
| Financial Services | 1 | $20B |
|
||
| Chemicals / Materials | 1 | $18B |
|
||
Price history
+136.8% since first listed3 events — show timeline
- 2026-05-20 Pending — CSMLS
- 2026-05-04 Listed $135,000 CSMLS
- 1980-02-01 Sold (Public Records) $57,000 Public Records
Property tax history
+1.4%/yrLatest (2026): $2,036 · +2.7% YoY. Source: county tax records.
Cash-flow waterfall
monthlySold comps — $/sqft
last 12 mo · ≤1 miLoading sold comps…