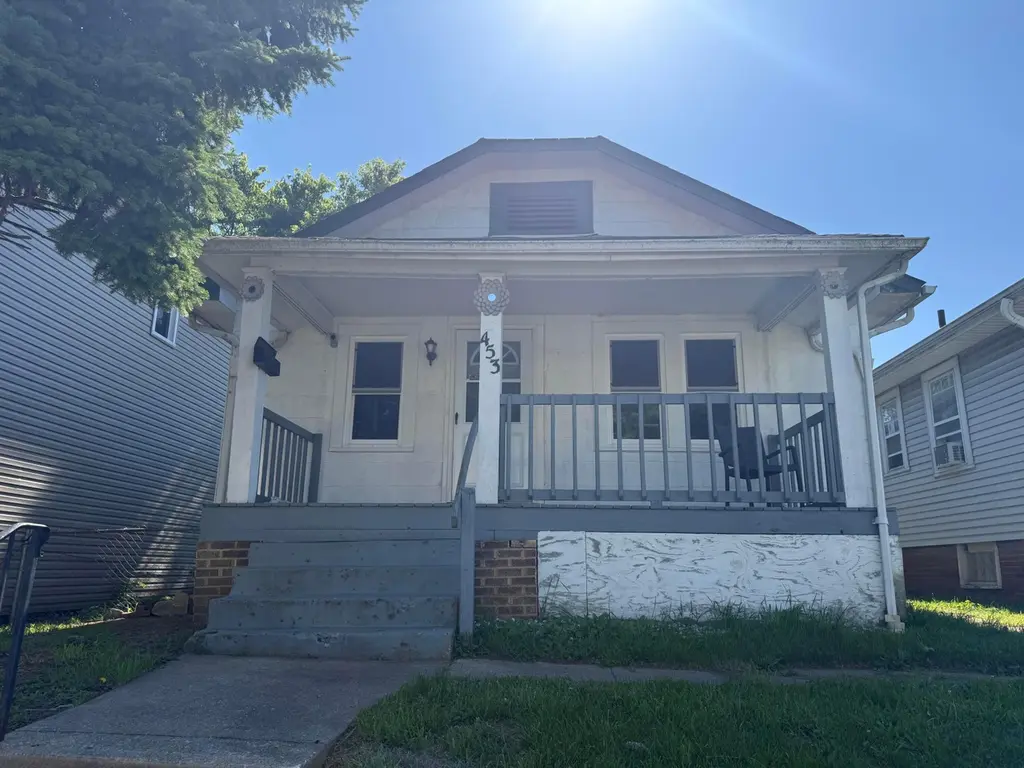
453 Catherine St · Columbus, OH
Flood risk 1/10 · Minimal
- FEMA flood zone
- X (unshaded)
- Chance of flooding over 30 yrs
- 0.0%
- Est. flood insurance / yr
- $473 – $860
Fire risk 1/10 · Minimal
- Est. fire insurance / yr
- $713 – $1,323
Heat risk 4/10 · Minor
- Hot days now (above 100°F)
- 7 days/yr
- Hot days in 30 yrs
- 18 days/yr
Wind risk 2/10 · Minimal
- Chance of severe wind over 30 yrs
- 1.0%
Air-quality risk 3/10 · Minor
- Unhealthy air days now
- 2 days/yr
- Unhealthy air days in 30 yrs
- 3 days/yr
Risk factors via First Street. Map © Google.
Why this score? — see what drove the B grade
The composite is a weighted blend of 9 inputs, each scored 0–100. Each bar is that input's sub-score; the figure is the points it added to the 100-point composite (weight × sub-score).
- Cash flow +29.0/30.0
- ARV discount +14.9/15.0
- DSCR +10.0/10.0
- 1% rule +8.0/10.0
- Livability +4.0/5.0
- Rent growth +3.7/5.0
- Condition / age +2.5/5.0
- Schools +1.7/10.0
- Appreciation +0.0/10.0
$104,900
🖨 Deal sheet 📄 Offer letter ✓ Due diligence
Listing remarks MLS
Great Investment property or starter home. Currently rented low @$600mo. Ready for your re-hab skills. Selling ''As-Is '' as systems older but seem to be in good working order. Seller may provide a home warranty program. Buyer may elect to have inspections/tests at their own expense for their own information. Main bath ready for an update. Kitchen has a neat breakfast nook/eating space. Cute front porch. Solid foundation. Great two gar block garage.
Key facts
- 3,920 sq ft lot
- 2 garage spots
- Built 1928
Property features AI
Exterior
- Parking: Detached 2-car garage; On-street parking available
- Utilities: Public water; Public sewer
- Home design: Single-family residence; Built in 1928; One story; No shared/common walls
- Construction: Block foundation; Built in 1928
- Exterior features: Block foundation
Interior
- Bedrooms: Three main-level bedrooms
- Flooring: Carpet; Other flooring types
- Bathrooms: One full bathroom; One half bathroom (1.5 total)
- Heating & cooling: Central air conditioning; Forced air heating
- Interior features: Insulated partial windows; Full basement with crawl space
Neighborhood map
What this means for you Summary
Snapshot
- This is a 3-bed/1.5-bath single-family listed at $105k.
Deal economics
- At list price, monthly cash flow is $360 ($4k/yr) — positive.
- The deal already cash-flows at list — no discount required.
- Meets the 1% rule at list price ($1k rent vs $105k).
- Cap rate 10.4% vs local median 3.8% in Columbus — top-decile yield for the area; either an underpriced asset or a hidden risk that comps aren't pricing in. Stress-test before assuming the spread holds.
Location & tenants
- Location reads 81/100 on livability (#97 in OH, #1,491 nationally) — a professional / high-income tenant draw. Strengths: commute A+, cost of living A+, housing A+; Watch: employment C-, crime F.
- Columbus City School District (urban): math 15% / reading 26% proficiency, ranked #626 of 656 in OH (top 95%) — low school quality limits family demand, transient renter base, plan for 1-2y turnover; 72% free/reduced lunch — lower-income household profile, screen leases tightly.
- Market conditions: Rents rising fast (+4.6%/yr); 144 active listings in the ZIP; 40 comparable units currently listed for rent nearby; rentals at typical pace (median 24d on market — plan ~3-4 weeks tenant-placement turnaround); 45% of comp listings sitting > 30 days — soft ceiling on asking rent; 8,139 units permitted in Franklin County in 2024 (5,940 in 5+ unit buildings).
- This rent runs 35% of the median local income ($47k/yr) — at the standard rent-burdened threshold; future hikes will face affordability resistance.
Forward outlook
- Local home prices are declining (-3.0%/yr); year-one equity from $725 of loan paydown is wiped out by about $3k of value loss. Plan a longer hold.
- Franklin County population projected at +34% by 2050 — long-run rental-demand tailwind backs the buy-and-hold thesis.
- At projected returns (-3.0% appreciation + 4.6% rent growth), your $29k cash investment doubles in ~8 years — after that, you're playing with house money.
Negotiation context
- Only 6 days on market — expect competitive offers; lowballing is unlikely to land.
- 3 sale attempts since 32y ago with the ask held roughly flat each time — persistent listings suggest the price (not the market) is what's stuck; bring a comps-based counter.
- Current owner paid $60k; list at $105k implies a 75% gain — meaningful room to come down on a strong offer.
Risks & watch-outs
- Watch-outs: built in 1928 — expect roof / HVAC / electrical / plumbing capex.
Questions for the listing agent
- Built in 1928 — when were the roof, HVAC, electrical panel, plumbing, and water heater last replaced?
- Is there a deadline driving the sale (1031 exchange, divorce, estate, relocation)? That informs how much negotiation room exists.
- Crime grade is F in this area — have there been break-ins, vandalism, or insurance claims at this property in the last 3 years? What carrier currently insures it and at what premium?
- What's the average days-on-market for RENTAL listings here right now (not sales)? A rising rental-DOM trend means longer vacancies and softer asking-rent achievability than the comps imply.
- What's the recent tenant-quality profile in this submarket — average credit score on applications, eviction rate, late-payment / NSF rate, and stable-employment percentage? A property-management company in the area should have these aggregated.
- How much new for-sale + rental construction is in the pipeline within 1–3 miles? Heavy new supply typically softens prices + rents 12–24 months out; constrained supply supports both.
Investment metrics
- 1% rule
- 1.30% ✓
- Cap rate
- 10.42%
- Cash-on-cash
- 14.73%
- DSCR
- 1.66
- GRM
- 6.4
CMA / ARV
- ARV (on-the-fly)
- $125,550
- Comps found
- 12
Show comp detail 12 sales within ~0.75 mi
| Address | Dist | Beds/Ba | Sqft | Sold | Price | $/sf | Match |
|---|---|---|---|---|---|---|---|
| 470 Woodbury Ave | 0.26mi | 2/1.0 (-1) | 816 (+5%) | 15mo | $146,000 | $179 | 59 |
| 1704 Thomas Ave | 0.11mi | 2/1.0 (-1) | 726 (-6%) | 23mo | $180,000 | $248 | 58 |
| 510 Belvidere Ave | 0.60mi | 2/1.0 (-1) | 820 (+6%) | 2mo | $124,900 | $152 | 54 |
| 244 Wrexham Ave | 0.60mi | 2/1.0 (-1) | 748 (-4%) | 9mo | $70,000 | $94 | 52 |
| 1958 W Mound St | 0.54mi | 3/1.0 | 844 (+9%) | 11mo | $160,000 | $190 | 49 |
| 1943 Hunt Ave | 0.68mi | 3/1.0 | 760 (-2%) | 20mo | $99,000 | $130 | 46 |
| 282 S Princeton Ave | 0.59mi | 2/1.0 (-1) | 736 (-5%) | 14mo | $145,000 | $197 | 45 |
| 648 Whitethorne Ave | 0.74mi | 2/1.0 (-1) | 732 (-6%) | 7mo | $80,000 | $109 | 43 |
| 303 S Yale Ave | 0.70mi | 2/1.0 (-1) | 832 (+7%) | 7mo | $125,000 | $150 | 43 |
| 610 Whitethorne Ave | 0.73mi | 2/1.0 (-1) | 732 (-6%) | 14mo | $143,000 | $195 | 38 |
| 425 S Glenwood Ave | 0.75mi | 2/1.0 (-1) | 880 (+14%) | 1mo | $142,500 | $162 | 35 |
| 471 Whitethorne Ave | 0.75mi | 2/1.0 (-1) | 866 (+12%) | 14mo | $90,000 | $104 | 27 |
Match score weights: distance 35% · size 25% · config 20% · recency 20%. Top-matched comps best support the ARV.
Projected returns pro-forma
-3.0% appreciation · 4.61% rent growth · sell at horizon
- IRR
- 7.0%
- Equity multiple
- 1.28×
- Total profit
- $8,210
- Equity at exit
- $15,641
- IRR
- 17.7%
- Equity multiple
- 2.57×
- Total profit
- $46,259
- Equity at exit
- $9,070
Cash invested: $29,372 (down + closing). Projections, not guarantees.
Landlord ↔ Tenant lean methodology
- Overall (STATE)
- 73 Landlord-Friendly
- State Ohio
- 73 Landlord-Friendly · R+6
- County
- — inherits STATE
- City
- — inherits STATE
ZIP-level market 43223
- Rents YoY
- 4.6%
- Active inventory
- 144
- Price-to-rent
- 6.4×
Monthly cashflow live
- Estimated rent
- $1,360 high interval (Pro) →
- Mortgage (P&I)
- −$550
- Tax from tax record
- −$120 /mo · $1,444/yr
- Insurance
- −$44
- HOA
- −$0
- Vacancy / Maint / Mgmt
- −$286
- Net cashflow
- $360
Break-even live
UW: 25.0% down · 7.5% · 30yr · 1.5% tax · 5.0% vac · 8.0% maint · 8.0% mgmt
Financing live
Cash to close
- Down payment
- $26,225
- Closing costs
- $3,147
- Reserves months
- —
- Total cash needed
- —
Loan-product check · same deal, 3 products live
Conventional
25% down · 7.5% · 30yr
- Down + closing
- —
- Monthly P&I
- —
- Monthly cashflow
- —
- DSCR
- —
- Eligible?
- —
Personal DTI + credit; lowest rate.
DSCR
20% down · 8.5% · 30yr
- Down + closing
- —
- Monthly P&I
- —
- Monthly cashflow
- —
- DSCR
- —
- Eligible?
- —
No personal income docs; deal must DSCR.
Hard money
10% down · 12.0% · 12mo
- Down + closing
- —
- Monthly P&I
- —
- Monthly cashflow
- —
- DSCR
- —
- Eligible?
- —
Short-term bridge; refi at stabilization.
Rent comps 40 comps
| Address | Beds | Baths | Sqft | Rent | $/sqft | DOM | Units | Dist |
|---|---|---|---|---|---|---|---|---|
| 436 Catherine St Columbus, OH | 2.0 | 1.5 | 960 | $1,300 | $1.35 | 7d | 1 | 0.03mi |
| 432 Catherine St Columbus, OH | 3.0 | 1.0 | 1073 | $1,325 | $1.23 | 14d | 1 | 0.04mi |
| 432 Catherine St Columbus, OH | 3.0 | 1.0 | 1073 | $1,325 | $1.23 | 12d | 1 | 0.04mi |
| 490 Helen St Columbus, OH | 2.0 | 1.0 | 840 | $1,200 | $1.43 | 43d | 1 | 0.07mi |
| 1485 Walsh Ave Columbus, OH | 2.0 | 1.0 | 720 | $1,450 | $2.01 | 23d | 1 | 0.25mi |
| 190 Nashoba Ave Columbus, OH | 2.0 | 1.0 | 1030 | $1,450 | $1.41 | 11d | 1 | 0.52mi |
| 190 Nashoba Ave Columbus, OH | 2.0 | 1.0 | 1030 | $1,450 | $1.41 | 19d | 1 | 0.52mi |
| 1287 Sullivant Ave Unit 1 Columbus, OH | 2.0 | 1.0 | 650 | $1,200 | $1.85 | 23d | 1 | 0.54mi |
| 1287 Sullivant Ave Unit 3 Columbus, OH | 2.0 | 1.0 | 650 | $1,250 | $1.92 | 23d | 1 | 0.54mi |
| 108 Columbian Ave Unit B Columbus, OH | 2.0 | 1.0 | 820 | $900 | $1.10 | 7d | 1 | 0.55mi |
| 1928-1930 Vaughn St Unit 1928 Columbus, OH | 2.0 | 1.0 | 919 | $957 | $1.04 | 43d | 1 | 0.55mi |
| 120 S Central Ave Columbus, OH | 1.0–3.0 | 1.0–2.0 | 944 | $1,295 | $1.37 | 14d | 12 | 0.60mi |
| 142 Dana Ave Unit 142 Columbus, OH | 2.0 | 1.0 | 700 | $825 | $1.18 | 43d | 1 | 0.65mi |
| 87-89 Dana Ave Columbus, OH | 2.0 | 1.0 | 948 | $1,100 | $1.16 | 21d | 1 | 0.68mi |
| 411 S Yale Ave Columbus, OH | 2.0 | 1.0 | 784 | $1,425 | $1.82 | 43d | 1 | 0.71mi |
| 85 Stevens Ave Columbus, OH | 2.0 | 1.0 | 816 | $995 | $1.22 | 43d | 1 | 0.77mi |
| 2203 Clarendon Ln Unit 2203 Columbus, OH | 2.0 | 1.0 | 835 | $1,000 | $1.20 | 12d | 1 | 0.79mi |
| 791-793 Butler Ave Unit 791 Columbus, OH | 3.0 | 1.0 | 1000 | $1,395 | $1.40 | 2d | 1 | 0.80mi |
| 73 Hayden Ave Columbus, OH | 2.0 | 1.0 | 894 | $1,350 | $1.51 | 7d | 1 | 0.84mi |
| 2157 W Mound St Unit C Columbus, OH | 2.0 | 1.0 | 825 | $900 | $1.09 | 43d | 1 | 0.85mi |
| 100 N Central Ave Columbus, OH | 2.0 | 1.0 | 932 | $1,043 | $1.12 | 43d | 1 | 0.85mi |
| 257 Clarendon Ave Unit 257,259,261,263 Columbus, OH | 2.0 | 1.0 | 1000 | $1,200 | $1.20 | 43d | 1 | 0.86mi |
| 2167 W Mound St Unit C Columbus, OH | 2.0 | 1.0 | 825 | $900 | $1.09 | 43d | 1 | 0.88mi |
| 2173 W Mound St Unit A Columbus, OH | 2.0 | 1.0 | 825 | $900 | $1.09 | 43d | 1 | 0.89mi |
| 185 S Cypress Ave Columbus, OH | 2.0 | 1.0 | 1104 | $1,695 | $1.54 | 43d | 1 | 0.90mi |
| 163 N Central Ave Columbus, OH | 2.0 | 2.5 | 1100 | $1,650 | $1.50 | 43d | 1 | 0.92mi |
| 1137 W Broad St Columbus, OH | 1.0–2.0 | 1.0 | 770 | $1,860 | $2.42 | 43d | 1 | 0.93mi |
| 170 S Highland Ave Columbus, OH | 2.0 | 1.0 | 950 | $895 | $0.94 | 43d | 1 | 0.96mi |
| 735 Canonby Pl Apt B Columbus, OH | 3.0 | 1.5 | 950 | $1,095 | $1.15 | 19d | 1 | 1.07mi |
| 548 S Wayne Ave Columbus, OH | 3.0 | 1.0 | 1008 | $1,225 | $1.22 | 19d | 1 | 1.09mi |
| 252-254 S Wayne Ave Unit 254 Columbus, OH | 3.0 | 1.0 | 1120 | $1,300 | $1.16 | 17d | 1 | 1.10mi |
| 731 Canonby Pl Unit B Columbus, OH | 3.0 | 1.5 | 950 | $1,095 | $1.15 | 43d | 1 | 1.11mi |
| 717 Canonby Pl Unit B Columbus, OH | 3.0 | 1.5 | 950 | $1,095 | $1.15 | 43d | 1 | 1.11mi |
| 755 Canonby Pl Columbus, OH | 3.0 | 1.5 | 950 | $1,095 | $1.15 | 43d | 1 | 1.12mi |
| 521-523 S Wayne Ave Columbus, OH | 3.0 | 1.0 | 1092 | $1,195 | $1.09 | 3d | 1 | 1.12mi |
| 329 S Wayne Ave Columbus, OH | 3.0 | 1.0 | 1120 | $1,425 | $1.27 | 2d | 1 | 1.12mi |
| 1475 Stimmel Rd Columbus, OH | 1.0–4.0 | 1.0 | 868 | $1,395 | $1.61 | 16d | 1 | 1.16mi |
| 947 E Forest Creek Dr Columbus, OH | 2.0 | 1.5 | 950 | $1,200 | $1.26 | 43d | 2 | 1.17mi |
| 827 W Rich St Unit 827 Columbus, OH | 2.0 | 1.0 | 1078 | $1,175 | $1.09 | 23d | 1 | 1.21mi |
| 821 W Rich St Unit 821 Columbus, OH | 2.0 | 1.0 | 1078 | $1,175 | $1.09 | 23d | 1 | 1.22mi |
Listing history 6 events
-
2026-06-18days on market $104,900 Active 6 DOM
-
2026-06-17days on market $104,900 Active 5 DOM
-
2026-06-16days on market $104,900 Active 4 DOM
-
2026-06-15days on market $104,900 Active 3 DOM
-
2026-06-13remarks 606-char remark
-
2026-06-13$104,900 Active 1 DOM
ⓘ Source: listings_history table (triggers on properties + properties_extension) + one-shot
backfill from property_details.listing_events for pre-trigger history.
Tax reassessment forecast OH · Partial reset (capped growth)
- Current annual tax
- $1,444 · $120/mo
- Projected year-2 tax
- $1,540 · $128/mo
- Expected delta
- +$96/yr (+$8/mo · 6.7%)
ⓘ Screening estimate from a state-policy table — verify with the county assessor before closing.
Climate risk First Street
- Flood 1/10 Low FEMA zone X (unshaded) · 0% chance over 30 yrs
- Wildfire 1/10 Low
- Heat 4/10 Moderate 7 d/yr ≥100°F today · 18 d/yr by 30 yrs out
- Wind 2/10 Low 100% chance of damaging wind over 30 yrs
- Air quality 3/10 Moderate 2 unhealthy d/yr today · 3 by 30 yrs out
Nearby sold comps map
Loading sold comps map…
Walkable amenities ~0.75 mi
Loading nearby amenities…
Taxation est. · year 1
- Rental income
- $16,323
- − Mortgage interest
- −$5,876
- − Property taxes
- −$1,444
- − Insurance
- −$524
- − Repairs & maintenance
- −$1,306
- − Management
- −$1,306
- − Depreciation
- −$3,052
- Taxable income
- $2,815
- Est. tax owed @ 24.0%
- −$676
- After-tax cash flow
- $3,650/yr
For passive investors: Depreciation is non-cash, so a rental often shows a tax loss while cash-flowing — sheltering income. Rental losses are passive: they offset passive income freely, and up to $25,000/yr can offset ordinary (W-2) income if you actively participate and your MAGI is under $100k (phasing out to $0 by $150k); unused losses carry forward. On sale, claimed depreciation is recaptured at up to 25%, and gains may owe capital-gains tax (a 1031 exchange can defer both). Figures are a year-1 estimate at your 24.0% rate — not tax advice; consult a CPA.
Schools (NCES district)
- District
- Columbus City School District
- NCES district ID
- 3904380
- Math proficiency
- 15% ▼ -17.00%
- Reading proficiency
- 26% ▼ -12.00%
- Median HH income
- $38,483
- Composite
- 17.19/100
- National rank
- #9105
- State rank
- #626 of 656 in OH
Livability — Columbus
- Score
- 81/100
- State rank
- #97
- US rank
- #1491
Category grades
Schools grade is shown separately in the Schools card above.
Census & demographics
- Census place
- Columbus, OH
- County
- Franklin County · 1,351,780 people
- City population
- 612,189
- Metro
- Columbus, OH
- Population (ZIP)
- 28,187
- Household income
- $46,911
- Rent vs Own
- Severe rent burden
- 1689.0
Population outlook (Franklin County) Hauer SSP2
- Today (2025)
- 1,456,139 people
- By 2030
- 1,556,890 · +6.9%
- By 2040
- 1,757,349 · +20.7%
- By 2050
- 1,950,539 · +34.0%
- By 2075
- 2,376,171 · +63.2%
- By 2100
- 2,636,796 · +81.1%
Race, ethnicity, and origin ACS 2023
- Neighborhood character
- Diverse neighborhood (Simpson 0.55)
- Race & ethnicity
- White 63% Black 22% Two or more races 8% Hispanic / Latino 8%
- Hispanic origin (detail)
- Mexican 4% Puerto Rican 3%
- Common ancestry
- Romanian 4% Italian 1% Slovak 1%
- Foreign-born
- 5% · Canada
- Languages at home
- 91% English-only · Spanish 5%
Political lean MEDSL · Franklin
- 2024 margin
- Strong D (+28.4) · D 63.7% · R 35.3% · Other 1.0%
- 2008→2024 swing
- +7.7pp toward D · 2008: 20.7pp · 2024: 28.4pp
- All cycles
- 2024: D+28.4 2020: D+31.4 2016: D+25.9 2012: D+21.7 2008: D+20.7
Not yet ingested
- Civics
- —
Market trends
- HPI YoY
- ▼ -135.33%
- Current HPI
- 211.6742
- Rent YoY
- ▲ 4.61%
- Metro
- Columbus, OH
- State GDP YoY
- ▲ 1.98%
- F500 in state
- 48
Industry mix (Fortune 500 HQ in OH)
| Industry | F500 HQs | Revenue |
|---|---|---|
| Insurance | 3 | $145B |
|
||
| Industrial Machinery | 3 | $49B |
|
||
| Financial Services | 3 | $24B |
|
||
| Consumer Goods | 2 | $93B |
|
||
| Aerospace / Defense | 2 | $47B |
|
||
| Utilities | 2 | $33B |
|
||
Price history
+352.2% since first listed12 events — show timeline
- 2026-06-12 Listed $104,900 CBRMLS
- 2020-07-27 Sold (Public Records) $60,000 Public Records
- 2020-07-21 Sold (MLS) $60,000 CBRMLS
- 2020-07-03 Pending — CBRMLS
- 2020-06-30 Listed $69,900 CBRMLS
- 1995-06-23 Sold (Public Records) $42,500 Public Records
- 1995-06-20 Sold (MLS) $42,500 CBRMLS
- 1995-04-21 Listing Removed — CBRMLS
- 1994-08-20 Listed $42,500 CBRMLS
- 1989-02-06 Sold (Public Records) $32,000 Public Records
- 1987-11-06 Sold (Public Records) $25,090 Public Records
- 1979-09-01 Sold (Public Records) $23,200 Public Records
Property tax history
+5.2%/yrLatest (2024): $1,444 · +1.3% YoY. Source: county tax records.
Cash-flow waterfall
monthlySold comps — $/sqft
last 12 mo · ≤1 miLoading sold comps…