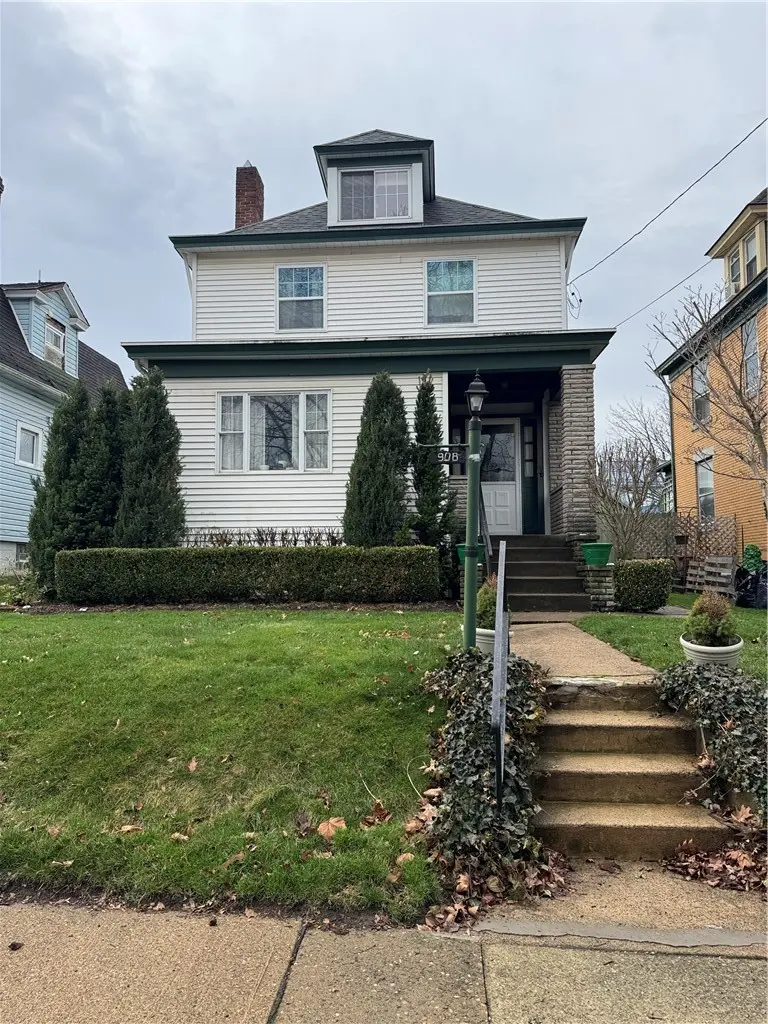
908 Franklin St · McKeesport, PA
Flood risk 1/10 · Minimal
- FEMA flood zone
- X (unshaded)
- Chance of flooding over 30 yrs
- 0.0%
- Est. flood insurance / yr
- $473 – $860
Fire risk 1/10 · Minimal
- Est. fire insurance / yr
- $511 – $949
Heat risk 4/10 · Minor
- Hot days now (above 97°F)
- 7 days/yr
- Hot days in 30 yrs
- 18 days/yr
Wind risk 2/10 · Minimal
- Chance of severe wind over 30 yrs
- 0.0%
Air-quality risk 4/10 · Minor
- Unhealthy air days now
- 5 days/yr
- Unhealthy air days in 30 yrs
- 7 days/yr
Risk factors via First Street. Map © Google.
Why this score? — see what drove the B- grade
The composite is a weighted blend of 9 inputs, each scored 0–100. Each bar is that input's sub-score; the figure is the points it added to the 100-point composite (weight × sub-score).
- Cash flow +30.0/30.0
- 1% rule +10.0/10.0
- DSCR +10.0/10.0
- ARV discount +7.5/15.0
- Livability +3.3/5.0
- Rent growth +2.5/5.0
- Condition / age +2.5/5.0
- Schools +1.6/10.0
- Appreciation +0.0/10.0
$79,900
🖨 Deal sheet (PDF) 📄 Offer letter ✓ Due diligence
Listing remarks
Investment opportunity in McKeesport, bordering Whitehall! This spacious 3-bedroom, 1-bath home offers over 1,700 square feet of living space and strong upside potential. Features include a two-car detached garage and a solid layout ready for updates. Primarily in need of cosmetic improvements—ideal for investors looking to add value through renovation. Great potential for flip or rental!
Key facts
- Solid layout
- Detached garage
- 4,800 sq ft lot
Tags
Property features AI
Exterior
- Parking: Detached garage; 2 parking spaces (total)
- Utilities: Public water; Public sewer
- Home design: 3-story property; Resale
- Construction: Frame construction; Asphalt roof
- Exterior features: Public transportation access
Interior
- Kitchen: Dishwasher; Refrigerator
- Bathrooms: 1 full bathroom
- Heating & cooling: Forced air heating; Gas heating
- Interior features: Basement
Neighborhood map
What this means for you Summary
Snapshot
- This is a 3-bed/1.0-bath single-family listed at $80k.
Deal economics
- At list price, monthly cash flow is $468 ($6k/yr) — positive.
- The deal already cash-flows at list — no discount required.
- Meets the 1% rule at list price ($1k rent vs $80k).
- Cap rate 13.3% vs local median 10.3% in McKeesport — meaningfully above typical; check what's discounted (condition, days-on-market, listing class) to confirm the premium yield is real.
Location & tenants
- Location reads 66/100 on livability (#1,089 in PA) — a middle-class / working-renter tenant base. Strengths: commute A+, cost of living A+, housing A+; Watch: schools D+, health & safety D, crime F.
- Mckeesport Area SD (suburban): math 11% / reading 28% proficiency, ranked #499 of 539 in PA (top 93%) — low school quality limits family demand, transient renter base, plan for 1-2y turnover; 66% free/reduced lunch — lower-income household profile, screen leases tightly.
- Market conditions: 115 active listings in the ZIP; 11 comparable units currently listed for rent nearby; rentals at typical pace (median 25d on market — plan ~3-4 weeks tenant-placement turnaround); 45% of comp listings sitting > 30 days — soft ceiling on asking rent; lower-income renter base — watch delinquency; 2,996 units permitted in Allegheny County in 2024 (1,588 in 5+ unit buildings).
- At $1,376/mo this rent would consume 47% of the median local household income ($35k/yr) (locally 1239% of renters already pay >50% of income on rent) — very limited rent-growth headroom before tenants either downsize or default.
Forward outlook
- Local home prices are declining (-3.0%/yr); year-one equity from $552 of loan paydown is wiped out by about $2k of value loss. Plan a longer hold.
- At projected returns (-3.0% appreciation + 3.0% rent growth), your $22k cash investment doubles in ~5 years — after that, you're playing with house money.
Negotiation context
- Only 7 days on market — expect competitive offers; lowballing is unlikely to land.
Risks & watch-outs
- Watch-outs: property tax is 2.5% of price; built in 1919 — expect roof / HVAC / electrical / plumbing capex.
Questions for the listing agent
- Built in 1919 — when were the roof, HVAC, electrical panel, plumbing, and water heater last replaced?
- Property tax is high relative to price — has the assessment been appealed recently, and will the sale trigger a re-assessment?
- Is there a deadline driving the sale (1031 exchange, divorce, estate, relocation)? That informs how much negotiation room exists.
- Schools are D-rated, which usually means shorter tenancies and higher turnover. Who's the typical renter profile here, and what's been the actual vacancy rate?
- Crime grade is F in this area — have there been break-ins, vandalism, or insurance claims at this property in the last 3 years? What carrier currently insures it and at what premium?
- What's the average days-on-market for RENTAL listings here right now (not sales)? A rising rental-DOM trend means longer vacancies and softer asking-rent achievability than the comps imply.
- What's the recent tenant-quality profile in this submarket — average credit score on applications, eviction rate, late-payment / NSF rate, and stable-employment percentage? A property-management company in the area should have these aggregated.
- How much new for-sale + rental construction is in the pipeline within 1–3 miles? Heavy new supply typically softens prices + rents 12–24 months out; constrained supply supports both.
Investment metrics
- 1% rule
- 1.72% ✓
- Cap rate
- 13.32%
- Cash-on-cash
- 25.09%
- DSCR
- 2.12
- GRM
- 4.8
CMA / ARV
- ARV (on-the-fly)
- $195,730
- Comps found
- 12
Show comp detail 12 sales within ~0.75 mi
| Address | Dist | Beds/Ba | Sqft | Sold | Price | $/sf | Match |
|---|---|---|---|---|---|---|---|
| 908 Franklin St | 0.00mi | 3/1.0 | 1,702 (0%) | 1mo | $70,000 | $41 | 99 |
| 915 Summit St | 0.09mi | 4/2.0 (+1) | 1,803 (+6%) | 9mo | $225,000 | $125 | 69 |
| 1121 Monongahela Blvd | 0.42mi | 4/3.0 (+1) | 1,708 (+0%) | 3mo | $333,000 | $195 | 64 |
| 1002 Summit St | 0.16mi | 3/2.0 | 1,462 (-14%) | 2mo | $157,000 | $107 | 63 |
| 537 Mccully St | 0.35mi | 3/1.5 | 1,548 (-9%) | 9mo | $30,000 | $19 | 59 |
| 1140 Franklin St | 0.31mi | 3/2.0 | 1,525 (-10%) | 8mo | $140,000 | $92 | 57 |
| 2220 Cronemeyer St | 0.51mi | 2/1.0 (-1) | 1,568 (-8%) | 8mo | $40,000 | $26 | 51 |
| 1217 Monongahela Blvd | 0.52mi | 3/2.0 | 1,900 (+12%) | 1mo | $245,000 | $129 | 51 |
| 1409 Lincoln Way | 0.58mi | 3/1.5 | 1,578 (-7%) | 9mo | $218,000 | $138 | 51 |
| 2927 State St | 0.44mi | 2/2.0 (-1) | 1,476 (-13%) | 1mo | $200,000 | $136 | 47 |
| 1414 Lincoln Way #1 | 0.57mi | 3/1.5 | 1,456 (-14%) | 4mo | $152,000 | $104 | 44 |
| 3032 Highland | 0.46mi | 4/3.0 (+1) | 1,900 (+12%) | 7mo | $219,000 | $115 | 40 |
Match score weights: distance 35% · size 25% · config 20% · recency 20%. Top-matched comps best support the ARV.
Projected returns pro-forma
-3.0% appreciation · 3.0% rent growth · sell at horizon
- IRR
- 18.6%
- Equity multiple
- 1.76×
- Total profit
- $16,907
- Equity at exit
- $11,913
- IRR
- 27.0%
- Equity multiple
- 3.38×
- Total profit
- $53,336
- Equity at exit
- $6,908
Cash invested: $22,372 (down + closing). Projections, not guarantees.
Landlord ↔ Tenant lean methodology
- Overall (STATE)
- 62 Landlord-Friendly
- State Pennsylvania
- 62 Landlord-Friendly · EVEN
- County
- — inherits STATE
- City
- — inherits STATE
ZIP-level market 15132
- Home prices YoY
- -32.9%
- Active inventory
- 115
- Price-to-rent
- 4.8×
Monthly cashflow live
- Estimated rent
- $1,376 high interval (Pro) →
- Mortgage (P&I)
- −$419
- Tax from tax record
- −$167 /mo · $2,007/yr
- Insurance
- −$33
- HOA
- −$0
- Vacancy / Maint / Mgmt
- −$289
- Net cashflow
- $468
Break-even live
Sensitivity live
| Price | -10% $513 | -5% $490 | +0% $468 | +5% $445 | +10% $423 |
|---|---|---|---|---|---|
| Rent | -10% $359 | -5% $413 | +0% $468 | +5% $522 | +10% $576 |
| Rate | -1.0pp $508 | -0.5pp $488 | base $468 | +0.5pp $447 | +1.0pp $426 |
UW: 25.0% down · 7.5% · 30yr · 1.5% tax · 5.0% vac · 8.0% maint · 8.0% mgmt
Financing live
Cash to close
- Down payment
- $19,975
- Closing costs
- $2,397
- Reserves months
- —
- Total cash needed
- —
Loan-product check · same deal, 3 products live
Conventional
25% down · 7.5% · 30yr
- Down + closing
- —
- Monthly P&I
- —
- Monthly cashflow
- —
- DSCR
- —
- Eligible?
- —
Personal DTI + credit; lowest rate.
DSCR
20% down · 8.5% · 30yr
- Down + closing
- —
- Monthly P&I
- —
- Monthly cashflow
- —
- DSCR
- —
- Eligible?
- —
No personal income docs; deal must DSCR.
Hard money
10% down · 12.0% · 12mo
- Down + closing
- —
- Monthly P&I
- —
- Monthly cashflow
- —
- DSCR
- —
- Eligible?
- —
Short-term bridge; refi at stabilization.
Rent comps 11 comps
| Address | Beds | Baths | Sqft | Rent | $/sqft | DOM | Units | Dist |
|---|---|---|---|---|---|---|---|---|
| 2212 Cronemeyer St McKeesport, PA | 3.0 | 1.0 | 1720 | $1,375 | $0.80 | 44d | 1 | 0.50mi |
| 3710 Mayfair St McKeesport, PA | 3.0 | 1.5 | 1314 | $1,095 | $0.83 | 4d | 1 | 1.05mi |
| 1506 Freemont St McKeesport, PA | 3.0 | 2.0 | 1250 | $1,295 | $1.04 | 24d | 1 | 1.11mi |
| 1217 Scott St McKeesport, PA | 3.0 | 1.0 | 1500 | $1,165 | $0.78 | 44d | 1 | 1.17mi |
| 2710 Henderson Rd White Oak, PA | 3.0 | 1.5 | 1676 | $1,675 | $1.00 | 2d | 1 | 1.20mi |
| 2807 Beaver St McKeesport, PA | 4.0 | 2.0 | 1700 | $1,200 | $0.71 | 44d | 1 | 1.30mi |
| 827 Hinnerman St Duquesne, PA | 3.0 | 1.0 | 1136 | $1,250 | $1.10 | 24d | 1 | 1.35mi |
| 201 S 4th St Duquesne, PA | 3.0 | 1.0 | 1200 | $1,385 | $1.15 | 44d | 1 | 1.43mi |
| 2618 Poinsettia Dr White Oak, PA | 4.0 | 1.0 | 1225 | $1,599 | $1.31 | 24d | 1 | 1.44mi |
| 2408 McCarrell St McKeesport, PA | 4.0 | 1.0 | 1430 | $1,195 | $0.84 | 24d | 1 | 1.44mi |
| 1318 Maryland Ave West Mifflin, PA | 3.0 | 1.0 | 1408 | $1,695 | $1.20 | 44d | 1 | 1.45mi |
Listing history 2 events
-
2026-04-16status Pending
-
2026-04-09$79,900 Active
ⓘ Source: listings_history table (triggers on properties + properties_extension) + one-shot
backfill from property_details.listing_events for pre-trigger history.
Tax reassessment forecast PA · Partial reset (capped growth)
- Current annual tax
- $2,007 · $167/mo
- Projected year-2 tax
- $2,007 · $167/mo
- Expected delta
- $0/yr ($0/mo · 0.0%)
ⓘ Screening estimate from a state-policy table — verify with the county assessor before closing.
Climate risk First Street
- Flood 1/10 Low FEMA zone X (unshaded) · 0% chance over 30 yrs
- Wildfire 1/10 Low
- Heat 4/10 Moderate 7 d/yr ≥97°F today · 18 d/yr by 30 yrs out
- Wind 2/10 Low 0% chance of damaging wind over 30 yrs
- Air quality 4/10 Moderate 5 unhealthy d/yr today · 7 by 30 yrs out
Nearby sold comps map
Loading sold comps map…
Walkable amenities ~0.75 mi
Loading nearby amenities…
Taxation est. · year 1
- Rental income
- $16,515
- − Mortgage interest
- −$4,476
- − Property taxes
- −$2,007
- − Insurance
- −$400
- − Repairs & maintenance
- −$1,321
- − Management
- −$1,321
- − Depreciation
- −$2,324
- Taxable income
- $4,667
- Est. tax owed @ 24.0%
- −$1,120
- After-tax cash flow
- $4,493/yr
For passive investors: Depreciation is non-cash, so a rental often shows a tax loss while cash-flowing — sheltering income. Rental losses are passive: they offset passive income freely, and up to $25,000/yr can offset ordinary (W-2) income if you actively participate and your MAGI is under $100k (phasing out to $0 by $150k); unused losses carry forward. On sale, claimed depreciation is recaptured at up to 25%, and gains may owe capital-gains tax (a 1031 exchange can defer both). Figures are a year-1 estimate at your 24.0% rate — not tax advice; consult a CPA.
Schools (NCES district)
- District
- Mckeesport Area SD
- NCES district ID
- 4214940
- Math proficiency
- 11% ▼ -9.00%
- Reading proficiency
- 28% ▼ -10.00%
- Median HH income
- $33,779
- Composite
- 15.88/100
- National rank
- #9257
- State rank
- #499 of 539 in PA
Livability — McKeesport
- Score
- 66/100
- State rank
- #1089
- US rank
- #12321
Category grades
Schools grade is shown separately in the Schools card above.
Census & demographics
- Census place
- McKeesport, PA
- County
- Allegheny County · 1,022,028 people
- City population
- 25,010
- Metro
- Pittsburgh, PA
- Population (ZIP)
- 18,898
- Household income
- $35,397
- Rent vs Own
- Severe rent burden
- 1239.0
Population outlook (Allegheny County) Hauer SSP2
- Today (2025)
- 1,250,282 people
- By 2030
- 1,256,482 · +0.5%
- By 2040
- 1,256,318 · +0.5%
- By 2050
- 1,244,169 · -0.5%
- By 2075
- 1,197,693 · -4.2%
- By 2100
- 1,093,187 · -12.6%
Race, ethnicity, and origin ACS 2023
- Neighborhood character
- Diverse neighborhood (Simpson 0.62)
- Race & ethnicity
- White 50% Black 35% Two or more races 10% Hispanic / Latino 4% Asian 1%
- Common ancestry
- Romanian 5% Serbian 2% Scotch-Irish 2%
- Foreign-born
- 2% · Canada, China
- Languages at home
- 96% English-only · Spanish 3%
Political lean MEDSL · Allegheny
- 2024 margin
- Strong D (+20.3) · D 59.7% · R 39.4%
- 2008→2024 swing
- +4.8pp toward D · 2008: 15.5pp · 2024: 20.3pp
- All cycles
- 2024: D+20.3 2020: D+20.4 2016: D+16.4 2012: D+14.4 2008: D+15.5
Not yet ingested
- Civics
- —
Market trends
- HPI YoY
- ▼ -71.01%
- Current HPI
- 145.195
- Rent YoY
- —
- Metro
- Pittsburgh, PA
- State GDP YoY
- ▲ 1.68%
- F500 in state
- 34
Industry mix (Fortune 500 HQ in PA)
| Industry | F500 HQs | Revenue |
|---|---|---|
| Healthcare | 2 | $309B |
|
||
| Insurance | 2 | $27B |
|
||
| Telecommunications / Media | 1 | $124B |
|
||
| Industrial Distribution | 1 | $22B |
|
||
| Financial Services | 1 | $20B |
|
||
| Chemicals / Materials | 1 | $18B |
|
||
Price history
2 events — show timeline
- 2026-04-16 Pending — West Penn MLS
- 2026-04-09 Listed $79,900 West Penn MLS
Property tax history
+5.2%/yrLatest (2026): $2,007 · +0.0% YoY. Source: county tax records.
Cash-flow waterfall
monthlySold comps — $/sqft
last 12 mo · ≤1 miLoading sold comps…