 Multi-family
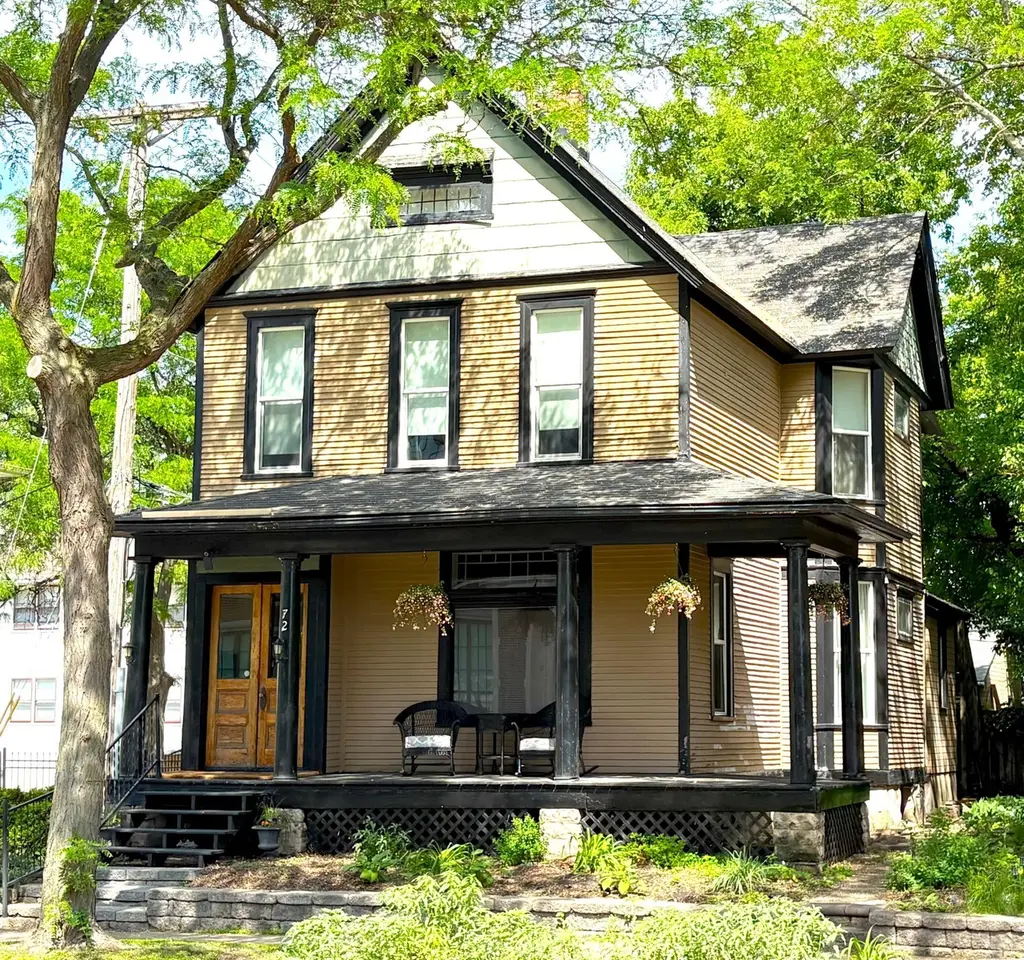
72 Saint Albans St N · St. Paul, MN
Flood risk 1/10 · Minimal
- FEMA flood zone
- X (unshaded)
- Chance of flooding over 30 yrs
- 0.0%
- Est. flood insurance / yr
- $473 – $860
Fire risk 1/10 · Minimal
- Est. fire insurance / yr
- $888 – $1,650
Heat risk 2/10 · Minimal
- Hot days now (above 99°F)
- 7 days/yr
- Hot days in 30 yrs
- 14 days/yr
Wind risk 2/10 · Minimal
- Chance of severe wind over 30 yrs
- —
Air-quality risk 2/10 · Minimal
- Unhealthy air days now
- 1 days/yr
- Unhealthy air days in 30 yrs
- 1 days/yr
Risk factors via First Street. Map © Google.
Why this score? — see what drove the B- grade
The composite is a weighted blend of 9 inputs, each scored 0–100. Each bar is that input's sub-score; the figure is the points it added to the 100-point composite (weight × sub-score).
- Cash flow +30.0/30.0
- 1% rule +10.0/10.0
- DSCR +10.0/10.0
- ARV discount +7.5/15.0
- Rent growth +3.1/5.0
- Livability +2.5/5.0
- Condition / age +2.5/5.0
- Schools +2.4/10.0
- Appreciation +0.0/10.0
$395,000
🖨 Deal sheet 📄 Offer letter ✓ Due diligence
Multi-family units
County records classify this as Multi-Family (2-4 Unit). Listing-text estimate: 1 unit. estimate disagrees with records
Key facts
- 4,800 sq ft lot
- 2 garage spots
- Built 1900
Property features AI
Finance
- Other: Property is not owner-occupied; Not fractional ownership
- Financial info: Tenant pays fuel and trash collection
- HOA & community: Porch listed as an association amenity
Exterior
- Parking: Detached/attached garage with garage door opener; 2-car garage (22 x 20)
- Security: Garage door opener
- Utilities: City water (connected); City sewer (connected); Natural gas service
- Home design: Residential income property (duplex, up-and-down configuration); Two levels
- Construction: Built on a stone foundation; Foundation area approximately 846 (below grade area noted)
- Exterior features: Deck; Full wood fencing; Wood exterior
Interior
- Kitchen: Unit 1 appliances: Range, Refrigerator; Unit 2 appliances: Range, Refrigerator
- Bedrooms: Total of 3 bedrooms (across units): one 1-bed unit and one 2-bed unit
- Flooring: Foundation finished area noted (stone foundation) — specific flooring not listed
- Bathrooms: Unit 1: 1 three-quarter bathroom; Unit 2: 1 full bathroom
- Heating & cooling: Hot water heating; No cooling systems listed for either unit
- Interior features: Full basement; Wood exterior (noted in exterior features)
- Laundry & utility: In-unit laundry (washer and dryer in Unit 2); Laundry in basement
Neighborhood map
What this means for you Summary
Snapshot
- This is a 3-bed/2.0-bath multifamily listed at $395k.
Deal economics
- At list price, monthly cash flow is $3k ($35k/yr) — positive.
- The deal already cash-flows at list — no discount required.
- Meets the 1% rule at list price ($7k rent vs $395k).
Location & tenants
- Location reads: area grade B — affects rentability + tenant quality, not the cash-flow math above.
- St. Paul Public School District (urban): math 21% / reading 33% proficiency, ranked #270 of 301 in MN (top 90%) — low school quality limits family demand, transient renter base, plan for 1-2y turnover; 64% free/reduced lunch — lower-income household profile, screen leases tightly.
- Market conditions: Rents rising (+2.5%/yr); 191 active listings in the ZIP; 5 comparable units currently listed for rent nearby; rentals leasing fast (median 3d on market — plan ~1-2 weeks tenant-placement turnaround); solid renter incomes; 1,202 units permitted in Ramsey County in 2024 (880 in 5+ unit buildings).
- At $7,377/mo this rent would consume 117% of the median local household income ($76k/yr) (locally 2116% of renters already pay >50% of income on rent) — very limited rent-growth headroom before tenants either downsize or default.
Forward outlook
- Local home prices are declining (-3.0%/yr); year-one equity from $3k of loan paydown is wiped out by about $12k of value loss. Plan a longer hold.
- Ramsey County population projected at +27% by 2050 — long-run rental-demand tailwind backs the buy-and-hold thesis.
- At projected returns (-3.0% appreciation + 2.5% rent growth), your $111k cash investment doubles in ~4 years — after that, you're playing with house money.
Negotiation context
- Only 9 days on market — expect competitive offers; lowballing is unlikely to land.
- Current owner paid $145k; list at $395k implies a 172% gain — meaningful room to come down on a strong offer.
Risks & watch-outs
- Watch-outs: built in 1900 — expect roof / HVAC / electrical / plumbing capex.
Questions for the listing agent
- Built in 1900 — when were the roof, HVAC, electrical panel, plumbing, and water heater last replaced?
- Is there a deadline driving the sale (1031 exchange, divorce, estate, relocation)? That informs how much negotiation room exists.
- What's the average days-on-market for RENTAL listings here right now (not sales)? A rising rental-DOM trend means longer vacancies and softer asking-rent achievability than the comps imply.
- What's the recent tenant-quality profile in this submarket — average credit score on applications, eviction rate, late-payment / NSF rate, and stable-employment percentage? A property-management company in the area should have these aggregated.
- How much new apartment / multifamily construction is in the pipeline within 1–3 miles? Heavy new supply (>2% of stock underway) typically softens rents 12–24 months out; light construction supports rent growth.
Investment metrics
- 1% rule
- 1.87% ✓
- Cap rate
- 15.15%
- Cash-on-cash
- 31.63%
- DSCR
- 2.41
- GRM
- 4.5
CMA / ARV
No comps found within radius.
Projected returns pro-forma
-3.0% appreciation · 2.5% rent growth · sell at horizon
- IRR
- 26.0%
- Equity multiple
- 2.07×
- Total profit
- $118,202
- Equity at exit
- $58,896
- IRR
- 33.4%
- Equity multiple
- 3.96×
- Total profit
- $327,926
- Equity at exit
- $34,152
Cash invested: $110,600 (down + closing). Projections, not guarantees.
Landlord ↔ Tenant lean methodology
- Overall (STATE)
- 46 Balanced
- State Minnesota
- 46 Balanced · D+2
- County
- — inherits STATE
- City
- — inherits STATE
ZIP-level market 55104
- Rents YoY
- 2.5%
- Active inventory
- 191
- Price-to-rent
- 8.9×
Monthly cashflow live
- Estimated rent
- $7,377 high interval (Pro) →
- Mortgage (P&I)
- −$2,071
- Tax from tax record
- −$676 /mo · $8,118/yr
- Insurance
- −$165
- HOA
- −$0
- Vacancy / Maint / Mgmt
- −$1,549
- Net cashflow
- $2,915
Break-even live
2-unit breakdown (identical units grouped — click to expand)
| Units | Beds | Baths | Est. rent |
|---|---|---|---|
| 2× units | 3 | 2 | $7,376 |
| #1 | 3 | 2 | $3,688 |
| #2 | 3 | 2 | $3,688 |
| Total (2 units) | $7,377 | ||
UW: 25.0% down · 7.5% · 30yr · 1.5% tax · 5.0% vac · 8.0% maint · 8.0% mgmt
Financing live
Cash to close
- Down payment
- $98,750
- Closing costs
- $11,850
- Reserves months
- —
- Total cash needed
- —
Loan-product check · same deal, 3 products live
Conventional
25% down · 7.5% · 30yr
- Down + closing
- —
- Monthly P&I
- —
- Monthly cashflow
- —
- DSCR
- —
- Eligible?
- —
Personal DTI + credit; lowest rate.
DSCR
20% down · 8.5% · 30yr
- Down + closing
- —
- Monthly P&I
- —
- Monthly cashflow
- —
- DSCR
- —
- Eligible?
- —
No personal income docs; deal must DSCR.
Hard money
10% down · 12.0% · 12mo
- Down + closing
- —
- Monthly P&I
- —
- Monthly cashflow
- —
- DSCR
- —
- Eligible?
- —
Short-term bridge; refi at stabilization.
Rent comps 5 comps
| Address | Beds | Baths | Sqft | Rent | $/sqft | DOM | Units | Dist |
|---|---|---|---|---|---|---|---|---|
| 695 Grand Ave Saint Paul, MN | 1.0–2.0 | 1.0–2.0 | 1130 | $5,795 | $5.13 | 17d | 10 | 0.27mi |
| 255 Western Ave N Saint Paul, MN | 3.0 | 1.0–2.0 | 1049 | $3,700 | $3.53 | 1d | 23 | 0.69mi |
| 253 Kellogg Blvd W Saint Paul, MN | 2.0 | 1.0–2.0 | 1208 | $3,198 | $2.65 | 2d | 12 | 1.28mi |
| 400 Spring St Saint Paul, MN | 1.0–2.0 | 1.0–2.0 | 1205 | $3,275 | $2.72 | 2d | 31 | 1.30mi |
| 470 Lexington Pkwy S Saint Paul, MN | 2.0 | 1.0–2.0 | 1175 | $3,500 | $2.98 | 1d | 19 | 1.41mi |
Listing history 6 events
-
2026-06-18days on market $395,000 Coming Soon 9 DOM
-
2026-06-17days on market $395,000 Coming Soon 8 DOM
-
2026-06-16days on market $395,000 Coming Soon 7 DOM
-
2026-06-15days on market $395,000 Coming Soon 6 DOM
-
2026-06-13days on market $395,000 Coming Soon 4 DOM
-
2026-06-10$395,000 Coming Soon 1 DOM
ⓘ Source: listings_history table (triggers on properties + properties_extension) + one-shot
backfill from property_details.listing_events for pre-trigger history.
Tax reassessment forecast MN · Partial reset (capped growth)
- Current annual tax
- $8,118 · $676/mo
- Projected year-2 tax
- $8,118 · $676/mo
- Expected delta
- $0/yr ($0/mo · 0.0%)
ⓘ Screening estimate from a state-policy table — verify with the county assessor before closing.
Climate risk First Street
- Flood 1/10 Low FEMA zone X (unshaded) · 0% chance over 30 yrs
- Wildfire 1/10 Low
- Heat 2/10 Low 7 d/yr ≥99°F today · 14 d/yr by 30 yrs out
- Wind 2/10 Low
- Air quality 2/10 Low 1 unhealthy d/yr today · 1 by 30 yrs out
Nearby sold comps map
Loading sold comps map…
Walkable amenities ~0.75 mi
Loading nearby amenities…
Taxation est. · year 1
- Rental income
- $88,524
- − Mortgage interest
- −$22,126
- − Property taxes
- −$8,118
- − Insurance
- −$1,975
- − Repairs & maintenance
- −$7,082
- − Management
- −$7,082
- − Depreciation
- −$11,491
- Taxable income
- $30,650
- Est. tax owed @ 24.0%
- −$7,356
- After-tax cash flow
- $27,628/yr
For passive investors: Depreciation is non-cash, so a rental often shows a tax loss while cash-flowing — sheltering income. Rental losses are passive: they offset passive income freely, and up to $25,000/yr can offset ordinary (W-2) income if you actively participate and your MAGI is under $100k (phasing out to $0 by $150k); unused losses carry forward. On sale, claimed depreciation is recaptured at up to 25%, and gains may owe capital-gains tax (a 1031 exchange can defer both). Figures are a year-1 estimate at your 24.0% rate — not tax advice; consult a CPA.
Schools (NCES district)
- District
- St. Paul Public School District
- NCES district ID
- 2733840
- Math proficiency
- 21% ▼ -11.00%
- Reading proficiency
- 33% ▼ -7.00%
- Median HH income
- $48,316
- Composite
- 23.51/100
- National rank
- #7868
- State rank
- #270 of 301 in MN
Livability — St. Paul
No livability data for this city. (Only ~50 U.S. cities are tracked.)
Census & demographics
- Census place
- St. Paul, MN
- County
- Ramsey County · 542,837 people
- City population
- 280,599
- Metro
- Minneapolis-St. Paul-Bloomington, MN-WI
- Population (ZIP)
- 45,762
- Household income
- $75,712
- Rent vs Own
- Severe rent burden
- 2116.0
Population outlook (Ramsey County) Hauer SSP2
- Today (2025)
- 603,431 people
- By 2030
- 636,459 · +5.5%
- By 2040
- 700,596 · +16.1%
- By 2050
- 765,819 · +26.9%
- By 2075
- 929,297 · +54.0%
- By 2100
- 1,053,924 · +74.7%
Race, ethnicity, and origin ACS 2023
- Neighborhood character
- Diverse neighborhood (Simpson 0.60)
- Race & ethnicity
- White 60% Black 19% Two or more races 10% Asian 7% Hispanic / Latino 7%
- Hispanic origin (detail)
- Mexican 4%
- Common ancestry
- Portuguese 8% Romanian 3% Lithuanian 3%
- Foreign-born
- 12% · Canada, Vietnam, China
- Languages at home
- 83% English-only · Spanish 4% Other Asian/Pacific 4% French/Haitian/Cajun 1%
Political lean MEDSL · Ramsey
- 2024 margin
- Solid D (+43.3) · D 70.5% · R 27.2% · Other 2.3%
- 2008→2024 swing
- +9.4pp toward D · 2008: 33.9pp · 2024: 43.3pp
- All cycles
- 2024: D+43.3 2020: D+45.4 2016: D+39.4 2012: D+35.3 2008: D+33.9
Not yet ingested
- Civics
- —
Market trends
- HPI YoY
- ▼ -532.26%
- Current HPI
- 245.6146
- Rent YoY
- ▲ 2.50%
- Metro
- Minneapolis-St. Paul-Bloomington, MN-WI
- State GDP YoY
- ▲ 2.41%
- F500 in state
- 34
Industry mix (Fortune 500 HQ in MN)
| Industry | F500 HQs | Revenue |
|---|---|---|
| Healthcare | 2 | $407B |
|
||
| Retail | 2 | $150B |
|
||
| Consumer Goods | 2 | $32B |
|
||
| Industrial Machinery | 2 | $6B |
|
||
| Agriculture | 1 | $40B |
|
||
| Healthcare / Medical Devices | 1 | $32B |
|
||
Price history
+887.5% since first listed5 events — show timeline
- 2026-06-09 Coming Soon $395,000 NORTHSTARMLS as Distributed by MLS Grid
- 1999-11-19 Sold (Public Records) $145,000 Public Records
- 1992-04-04 Sold (MLS) $73,300 NORTHSTARMLS as Distributed by MLS Grid
- 1991-09-19 Listed $75,900 NORTHSTARMLS as Distributed by MLS Grid
- 1990-06-08 Sold (Public Records) $40,000 Public Records
Property tax history
+6.8%/yrLatest (2025): $8,118 · +21.6% YoY. Source: county tax records.
Cash-flow waterfall
monthlySold comps — $/sqft
last 12 mo · ≤1 miLoading sold comps…