7200 MO State Hwy 72 · Millersville, MO
Flood risk No data
- FEMA flood zone
- —
- Chance of flooding over 30 yrs
- —
- Est. flood insurance / yr
- —
Fire risk No data
- Est. fire insurance / yr
- —
Heat risk No data
- Hot days now (above threshold)
- —
- Hot days in 30 yrs
- —
Wind risk No data
- Chance of severe wind over 30 yrs
- —
Air-quality risk No data
- Unhealthy air days now
- —
- Unhealthy air days in 30 yrs
- —
Risk factors via First Street. Map © Google.
Why this score? — see what drove the D- grade
The composite is a weighted blend of 9 inputs, each scored 0–100. Each bar is that input's sub-score; the figure is the points it added to the 100-point composite (weight × sub-score).
- ARV discount +15.0/15.0
- Cash flow +7.9/30.0
- Schools +4.0/10.0
- Rent growth +3.6/5.0
- Livability +2.5/5.0
- Condition / age +2.5/5.0
- 1% rule +2.4/10.0
- DSCR +1.9/10.0
- Appreciation +0.0/10.0
$199,000
🖨 Deal sheet (PDF) 📄 Offer letter ✓ Due diligence
Listing remarks
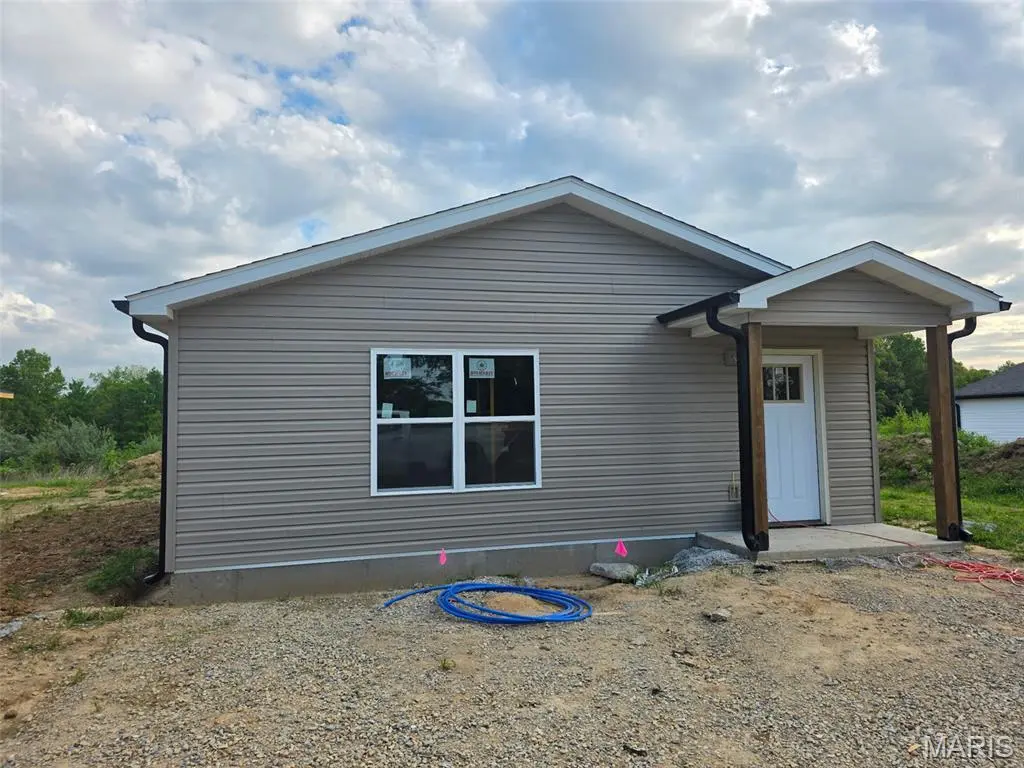
Experience the ease of brand-new construction with this soon-to-be-completed home, ready for move-in in just a few weeks. This thoughtfully planned 3-bedroom, 2-bath residence offers efficient living space that feels open, comfortable, and well-balanced. The layout is designed with everyday living in mind, featuring a seamless flow between main living areas and well-proportioned bedrooms. Modern finishes and solid craftsmanship throughout provide a clean, contemporary look while maintaining practical functionality. Ideal for a wide range of buyers, this home offers a low-maintenance lifestyle without sacrificing comfort or style. Take advantage of this opportunity to own a newly built home
Key facts
- 0.3 acre lot
- Built 2026
- Listed 58 days
Property features AI
Finance
- Financial info: Seller may consider concessions; Lease not considered
Exterior
- Parking: Panel doors
- Utilities: Public water; Septic tank sewer; Single-phase electric; Cable available
- Home design: Single-family residence; One-story house; New construction; Central living area
- Construction: Frame construction with vinyl siding; Shingle roof; Attic/crawl hatchway(s) insulated; Blown-in insulation; Ducts professionally air-sealed; Concrete elements
- Exterior features: Awning-covered patio/porch; Exterior lighting; No-step entry; Back yard; Gently rolling lot; Paved road access; Highway frontage
Interior
- Kitchen: Electric cooktop; Dishwasher; Refrigerator; Plumbed for ice maker
- Bedrooms: 3 bedrooms on the main level; Master suite on the main level with attached master bathroom and closet
- Flooring: Concrete floors
- Bathrooms: 2 full bathrooms (both on the main level); Hall bathroom
- Heating & cooling: Forced air heating; Central air conditioning; Ceiling fans for additional cooling
- Interior features: Ceiling fans; Vaulted ceilings; Double-pane windows
- Laundry & utility: Washer hookup (main level); Electric dryer hookup (main level); Laundry/utility room on main level
Neighborhood map
What this means for you Summary
Snapshot
- This is a 3-bed/2.0-bath single-family listed at $199k.
Deal economics
- At list price, monthly cash flow is $-215 ($-3k/yr) — negative.
- To cash-flow at today's rent, offer at most $168k (15.6% below list).
- To meet the 1% rule (rent ≥ 1% of price), the offer needs to be $147k (26.2% below list).
- Recommended offer: $147k (26.2% below list) — sets the bar for 1% rule.
Location & tenants
- Location reads: area grade D — affects rentability + tenant quality, not the cash-flow math above.
- Jackson R-II (suburban): math 41% / reading 51% proficiency, ranked #73 of 324 in MO (top 22%) — families likely to look elsewhere, expect single-tenant / working-renter base with shorter leases.
- Zoned schools: Millersville Attendance Ctr. (44 students, 54% FRL); Jackson Sr. High (math 45% / reading 62%, grade C-, #83 of 521 statewide, top 16%, 1,764 students, 30% FRL).
- Market conditions: Rents rising fast (+4.5%/yr); 177 active listings in the ZIP; solid renter incomes; 81 units permitted in Cape Girardeau County in 2024 (0 in 5+ unit buildings).
Forward outlook
- Local home prices are declining (-3.0%/yr); year-one equity from $1k of loan paydown is wiped out by about $6k of value loss. Plan a longer hold.
- Cape Girardeau County population projected at +17% by 2050 — long-run rental-demand tailwind backs the buy-and-hold thesis.
Negotiation context
- It's been on market 58 days — a 3% lower offer ($193k) is reasonable based on typical stale-listing flexibility.
Questions for the listing agent
- What do current leases actually rent for vs. the listed asking? Can we see a recent rent roll and the last 12 months of T-12 income?
- It's been on market 58 days. Have you received any prior offers? Is the seller open to a 26% concession, seller financing, or rate buy-down credit?
- Is there a deadline driving the sale (1031 exchange, divorce, estate, relocation)? That informs how much negotiation room exists.
- The area grade is low — what's the realistic commute time and amenity access for the typical tenant pool here? Any planned neighborhood developments (good or bad) we should know about?
- What's the average days-on-market for RENTAL listings here right now (not sales)? A rising rental-DOM trend means longer vacancies and softer asking-rent achievability than the comps imply.
- What's the recent tenant-quality profile in this submarket — average credit score on applications, eviction rate, late-payment / NSF rate, and stable-employment percentage? A property-management company in the area should have these aggregated.
- How much new for-sale + rental construction is in the pipeline within 1–3 miles? Heavy new supply typically softens prices + rents 12–24 months out; constrained supply supports both.
Investment metrics
- 1% rule
- 0.74% ✗
- Cap rate
- 5.00%
- Cash-on-cash
- -4.63%
- DSCR
- 0.79
- GRM
- 11.3
CMA / ARV
- ARV (median comp)
- $254,773
- List price
- $199,000
- Delta
- -21.89%
- Verdict
- UNDERPRICED
- Comps
- 5 within 2.0 mi
Show comp detail 1 sale within ~0.75 mi
| Address | Dist | Beds/Ba | Sqft | Sold | Price | $/sf | Match |
|---|---|---|---|---|---|---|---|
| 179 Booness Dr | 0.12mi | 3/2.0 | 1,411 (+13%) | 7mo | $249,900 | $177 | 67 |
Match score weights: distance 35% · size 25% · config 20% · recency 20%. Top-matched comps best support the ARV.
Projected returns pro-forma
-3.0% appreciation · 4.49% rent growth · sell at horizon
- IRR
- -22.5%
- Equity multiple
- 0.22×
- Total profit
- $-43,670
- Equity at exit
- $29,672
- IRR
- -13.3%
- Equity multiple
- 0.17×
- Total profit
- $-46,098
- Equity at exit
- $17,206
Cash invested: $55,720 (down + closing). Projections, not guarantees.
Landlord ↔ Tenant lean methodology
- Overall (STATE)
- 81 Strongly Landlord-Friendly
- State Missouri
- 81 Strongly Landlord-Friendly · R+10
- County
- — inherits STATE
- City
- — inherits STATE
ZIP-level market 63755
- Rents YoY
- 4.5%
- Active inventory
- 177
- Price-to-rent
- 11.3×
Monthly cashflow live
- Estimated rent
- $1,469 medium interval (Pro) →
- Mortgage (P&I)
- −$1,044
- Tax est. 1.5%
- −$249 /mo · $2,985/yr
- Insurance
- −$83
- HOA
- −$0
- Vacancy / Maint / Mgmt
- −$308
- Net cashflow
- $-215
Break-even live
Sensitivity live
| Price | -10% $-77 | -5% $-146 | +0% $-215 | +5% $-284 | +10% $-352 |
|---|---|---|---|---|---|
| Rent | -10% $-331 | -5% $-273 | +0% $-215 | +5% $-157 | +10% $-99 |
| Rate | -1.0pp $-115 | -0.5pp $-164 | base $-215 | +0.5pp $-266 | +1.0pp $-319 |
UW: 25.0% down · 7.5% · 30yr · 1.5% tax · 5.0% vac · 8.0% maint · 8.0% mgmt
Financing live
Cash to close
- Down payment
- $49,750
- Closing costs
- $5,970
- Reserves months
- —
- Total cash needed
- —
Loan-product check · same deal, 3 products live
Conventional
25% down · 7.5% · 30yr
- Down + closing
- —
- Monthly P&I
- —
- Monthly cashflow
- —
- DSCR
- —
- Eligible?
- —
Personal DTI + credit; lowest rate.
DSCR
20% down · 8.5% · 30yr
- Down + closing
- —
- Monthly P&I
- —
- Monthly cashflow
- —
- DSCR
- —
- Eligible?
- —
No personal income docs; deal must DSCR.
Hard money
10% down · 12.0% · 12mo
- Down + closing
- —
- Monthly P&I
- —
- Monthly cashflow
- —
- DSCR
- —
- Eligible?
- —
Short-term bridge; refi at stabilization.
Listing history 17 events
-
2026-06-21days on market $199,000 Active 58 DOM
-
2026-06-19days on market $199,000 Active 56 DOM
-
2026-06-18days on market $199,000 Active 55 DOM
-
2026-06-17days on market $199,000 Active 54 DOM
-
2026-06-16days on market $199,000 Active 53 DOM
-
2026-06-15days on market $199,000 Active 52 DOM
-
2026-06-14days on market $199,000 Active 50 DOM
-
2026-06-13days on market $199,000 Active 49 DOM
-
2026-06-10days on market $199,000 Active 47 DOM
-
2026-06-09days on market $199,000 Active 46 DOM
-
2026-06-08days on market $199,000 Active 45 DOM
-
2026-06-07days on market $199,000 Active 44 DOM
-
2026-06-02days on market $199,000 Active 39 DOM
-
2026-06-01days on market $199,000 Active 38 DOM
-
2026-05-31days on market $199,000 Active 37 DOM
-
2026-05-30days on market $199,000 Active 36 DOM
-
2026-04-24$199,000 Active 771-char remark
ⓘ Source: listings_history table (triggers on properties + properties_extension) + one-shot
backfill from property_details.listing_events for pre-trigger history.
Nearby sold comps map
Loading sold comps map…
Walkable amenities ~0.75 mi
Loading nearby amenities…
Taxation est. · year 1
- Rental income
- $17,627
- − Mortgage interest
- −$11,147
- − Property taxes
- −$2,985
- − Insurance
- −$995
- − Repairs & maintenance
- −$1,410
- − Management
- −$1,410
- − Depreciation
- −$5,789
- Taxable loss
- −$6,109
- Est. tax savings @ 24.0%
- +$1,466
- After-tax cash flow
- $-1,111/yr
For passive investors: Depreciation is non-cash, so a rental often shows a tax loss while cash-flowing — sheltering income. Rental losses are passive: they offset passive income freely, and up to $25,000/yr can offset ordinary (W-2) income if you actively participate and your MAGI is under $100k (phasing out to $0 by $150k); unused losses carry forward. On sale, claimed depreciation is recaptured at up to 25%, and gains may owe capital-gains tax (a 1031 exchange can defer both). Figures are a year-1 estimate at your 24.0% rate — not tax advice; consult a CPA.
Schools (NCES district)
- District
- Jackson R-II
- NCES district ID
- 2915600
- Math proficiency
- 41% ▼ -6.00%
- Reading proficiency
- 51% ▬ 0.00%
- Median HH income
- $52,935
- Composite
- 39.72/100
- National rank
- #3898
- State rank
- #73 of 324 in MO
Livability — Millersville
No livability data for this city. (Only ~50 U.S. cities are tracked.)
Census & demographics
- County
- Cape Girardeau County · 75,175 people
- Metro
- Cape Girardeau, MO-IL
- Population (ZIP)
- 27,629
- Household income
- $78,750
- Rent vs Own
- Severe rent burden
- 354.0
Population outlook (Cape Girardeau County) Hauer SSP2
- Today (2025)
- 84,807 people
- By 2030
- 88,016 · +3.8%
- By 2040
- 93,914 · +10.7%
- By 2050
- 99,541 · +17.4%
- By 2075
- 114,527 · +35.0%
- By 2100
- 121,718 · +43.5%
Race, ethnicity, and origin ACS 2023
- Neighborhood character
- Predominantly White (92%)
- Race & ethnicity
- White 92% Two or more races 4% Hispanic / Latino 3% Black 2%
- Common ancestry
- Slovak 2% Italian 2% Lithuanian 1%
- Foreign-born
- 1% · Canada
- Languages at home
- 98% English-only · Spanish 1%
Political lean MEDSL · Cape Girardeau
- 2024 margin
- Solid R (+46.5) · D 26.2% · R 72.7% · Other 1.1%
- 2008→2024 swing
- -12.9pp toward R · 2008: -33.6pp · 2024: -46.5pp
- All cycles
- 2024: R+46.5 2020: R+45.0 2016: R+50.1 2012: R+43.8 2008: R+33.6
Not yet ingested
- Civics
- —
Market trends
- HPI YoY
- ▼ -120.83%
- Current HPI
- 179.1136
- Rent YoY
- ▲ 4.49%
- Metro
- Cape Girardeau, MO-IL
- State GDP YoY
- ▲ 1.84%
- F500 in state
- 20
Industry mix (Fortune 500 HQ in MO)
| Industry | F500 HQs | Revenue |
|---|---|---|
| Healthcare | 1 | $163B |
|
||
| Insurance | 1 | $21B |
|
||
| Industrial Technology | 1 | $17B |
|
||
| Retail | 1 | $16B |
|
||
| Industrial Distribution | 1 | $10B |
|
||
| Utilities | 1 | $9B |
|
||
Price history
1 event — show timeline
- 2026-04-24 Listed $199,000 MARIS as Distributed by MLS Grid
Cash-flow waterfall
monthlySold comps — $/sqft
last 12 mo · ≤1 miLoading sold comps…