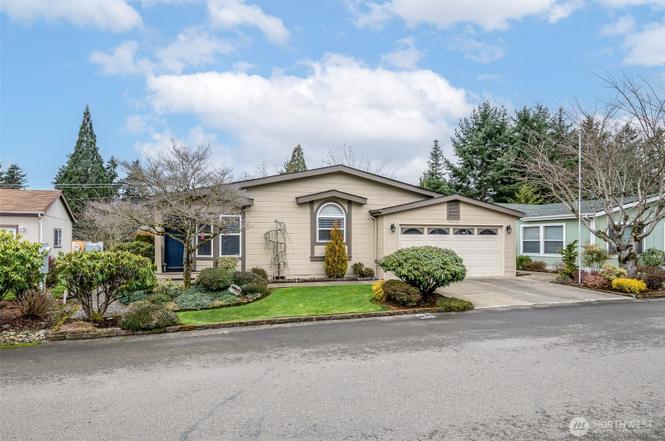
15216 122nd Ave E #3 · South Hill, WA
Flood risk 1/10 · Minimal
- FEMA flood zone
- X (unshaded)
- Chance of flooding over 30 yrs
- 0.0%
- Est. flood insurance / yr
- $507 – $1,088
Fire risk 1/10 · Minimal
- Est. fire insurance / yr
- $604 – $1,122
Heat risk 2/10 · Minimal
- Hot days now (above 88°F)
- 7 days/yr
- Hot days in 30 yrs
- 14 days/yr
Wind risk 1/10 · Minimal
- Chance of severe wind over 30 yrs
- —
Air-quality risk 7/10 · Major
- Unhealthy air days now
- 10 days/yr
- Unhealthy air days in 30 yrs
- 10 days/yr
Risk factors via First Street. Map © Google.
Why this score? — see what drove the B grade
The composite is a weighted blend of 9 inputs, each scored 0–100. Each bar is that input's sub-score; the figure is the points it added to the 100-point composite (weight × sub-score).
- Cash flow +30.0/30.0
- 1% rule +10.0/10.0
- DSCR +10.0/10.0
- ARV discount +7.5/15.0
- Schools +5.4/10.0
- Livability +4.0/5.0
- Rent growth +2.9/5.0
- Condition / age +2.5/5.0
- Appreciation +0.0/10.0
$155,000
🖨 Deal sheet (PDF) 📄 Offer letter ✓ Due diligence
Listing remarks
* Our buyer's couldn't sell their home? so here's your ?2nd chance to own ours! Home has breezed through inspection: new water heater installed, carpets professionally cleaned and ready for you to move in ASAP! * Perfectly curated to blend comfort, security & simple style for 55+ living, this home nestled on the outskirts of stunning Sunrise, feels like a retreat. Live worry free with a newer, exterior/interior paint, flooring & appliances, all impeccably & routinely maintenanced. Soaring ceilings seamlessly blend the living and dining rooms and the heart of the home, the kitchen, is anchored by contemporary finishes of Corian counters, matching SS appliance suite, abunda
Key facts
- Newer roof
- Newer washer dryer
- Lvp flooring
Tags
Neighborhood map
What this means for you Summary
Snapshot
- This is a 3-bed/2.0-bath manufactured listed at $155k.
Deal economics
- At list price, monthly cash flow is $1k ($14k/yr) — positive.
- The deal already cash-flows at list — no discount required.
- Meets the 1% rule at list price ($3k rent vs $155k).
- Recommended offer: $146k (6.0% below list) — sets the bar for market timing.
- Cap rate 15.1% vs local median 3.0% in South Hill — top-decile yield for the area; either an underpriced asset or a hidden risk that comps aren't pricing in. Stress-test before assuming the spread holds.
Location & tenants
- Location reads 80/100 on livability (#84 in WA, #1,620 nationally) — a professional / high-income tenant draw. Strengths: employment A+, housing A+, health & safety A+; Watch: crime C-, schools D+, cost of living F.
- Puyallup School District (suburban): math 53% / reading 66% proficiency, ranked #52 of 291 in WA (top 18%) — acceptable for families but not a draw, mixed tenant base, ~2y average lease.
- Market conditions: Rents rising (+1.7%/yr); 451 active listings in the ZIP; 12 comparable units currently listed for rent nearby; rentals leasing fast (median 14d on market — plan ~1-2 weeks tenant-placement turnaround); high-income renter base; 3,209 units permitted in Pierce County in 2024 (1,269 in 5+ unit buildings).
Forward outlook
- Local home prices are declining (-3.0%/yr); year-one equity from $1k of loan paydown is wiped out by about $5k of value loss. Plan a longer hold.
- Pierce County population projected at +26% by 2050 — long-run rental-demand tailwind backs the buy-and-hold thesis.
- At projected returns (-3.0% appreciation + 1.7% rent growth), your $43k cash investment doubles in ~4 years — after that, you're playing with house money.
Negotiation context
- It's been on market 70 days — a 6% lower offer ($146k) is reasonable based on typical stale-listing flexibility.
- 2 sale attempts; this cycle's ask has dropped $40k (21%) from the opening price — seller is motivated, your offer sets the floor, not the list.
Questions for the listing agent
- It's been on market 70 days. Have you received any prior offers? Is the seller open to a 6% concession, seller financing, or rate buy-down credit?
- Why hasn't it sold? Are there any deal-killer items the seller is aware of (foundation, flood, title, zoning, code violations)?
- Is there a deadline driving the sale (1031 exchange, divorce, estate, relocation)? That informs how much negotiation room exists.
- Schools are D-rated, which usually means shorter tenancies and higher turnover. Who's the typical renter profile here, and what's been the actual vacancy rate?
- What's the average days-on-market for RENTAL listings here right now (not sales)? A rising rental-DOM trend means longer vacancies and softer asking-rent achievability than the comps imply.
- What's the recent tenant-quality profile in this submarket — average credit score on applications, eviction rate, late-payment / NSF rate, and stable-employment percentage? A property-management company in the area should have these aggregated.
- How much new for-sale + rental construction is in the pipeline within 1–3 miles? Heavy new supply typically softens prices + rents 12–24 months out; constrained supply supports both.
Investment metrics
- 1% rule
- 1.78% ✓
- Cap rate
- 15.07%
- Cash-on-cash
- 31.36%
- DSCR
- 2.40
- GRM
- 4.7
CMA / ARV
- ARV (on-the-fly)
- $354,004
- Comps found
- 8
Show comp detail 8 sales within ~0.75 mi
| Address | Dist | Beds/Ba | Sqft | Sold | Price | $/sf | Match |
|---|---|---|---|---|---|---|---|
| 15208 123rd Avenue Ct E #39 | 0.04mi | 3/2.0 | 1,290 (-2%) | 13mo | $195,000 | $151 | 84 |
| 15410 123rd Avenue Ct E #47 | 0.09mi | 3/2.0 | 1,344 (+2%) | 12mo | $174,000 | $129 | 83 |
| 16124 120th Ave E | 0.54mi | 3/2.0 | 1,316 (0%) | 4mo | $440,000 | $334 | 71 |
| 15410 122nd Avenue Ct E #9 | 0.08mi | 3/2.0 | 1,400 (+6%) | 20mo | $215,000 | $154 | 69 |
| 16126 120th Ave E | 0.56mi | 3/2.0 | 1,344 (+2%) | 11mo | $362,000 | $269 | 62 |
| 15406 122nd Avenue Ct E #8 | 0.07mi | 3/2.0 | 1,512 (+15%) | 15mo | $190,000 | $126 | 60 |
| 16210 118th Avenue Ct E | 0.64mi | 3/2.0 | 1,296 (-2%) | 11mo | $425,000 | $328 | 58 |
| 13210 152nd Street Ct E | 0.66mi | 3/2.0 | 1,296 (-2%) | 11mo | $480,000 | $370 | 58 |
Match score weights: distance 35% · size 25% · config 20% · recency 20%. Top-matched comps best support the ARV.
Projected returns pro-forma
-3.0% appreciation · 1.72% rent growth · sell at horizon
- IRR
- 24.8%
- Equity multiple
- 2.01×
- Total profit
- $43,641
- Equity at exit
- $23,111
- IRR
- 31.8%
- Equity multiple
- 3.70×
- Total profit
- $117,081
- Equity at exit
- $13,402
Cash invested: $43,400 (down + closing). Projections, not guarantees.
Landlord ↔ Tenant lean methodology
- Overall (STATE)
- 28 Tenant-Leaning
- State Washington
- 28 Tenant-Leaning · D+8
- County
- — inherits STATE
- City
- — inherits STATE
ZIP-level market 98374
- Rents YoY
- 1.7%
- Active inventory
- 451
- Price-to-rent
- 4.7×
Monthly cashflow live
- Estimated rent
- $2,766 high interval (Pro) →
- Mortgage (P&I)
- −$813
- Tax from tax record
- −$174 /mo · $2,083/yr
- Insurance
- −$65
- HOA
- −$0
- Vacancy / Maint / Mgmt
- −$581
- Net cashflow
- $1,134
Break-even live
Sensitivity live
| Price | -10% $1,222 | -5% $1,178 | +0% $1,134 | +5% $1,090 | +10% $1,047 |
|---|---|---|---|---|---|
| Rent | -10% $916 | -5% $1,025 | +0% $1,134 | +5% $1,244 | +10% $1,353 |
| Rate | -1.0pp $1,212 | -0.5pp $1,174 | base $1,134 | +0.5pp $1,094 | +1.0pp $1,053 |
UW: 25.0% down · 7.5% · 30yr · 1.5% tax · 5.0% vac · 8.0% maint · 8.0% mgmt
Financing live
Cash to close
- Down payment
- $38,750
- Closing costs
- $4,650
- Reserves months
- —
- Total cash needed
- —
Loan-product check · same deal, 3 products live
Conventional
25% down · 7.5% · 30yr
- Down + closing
- —
- Monthly P&I
- —
- Monthly cashflow
- —
- DSCR
- —
- Eligible?
- —
Personal DTI + credit; lowest rate.
DSCR
20% down · 8.5% · 30yr
- Down + closing
- —
- Monthly P&I
- —
- Monthly cashflow
- —
- DSCR
- —
- Eligible?
- —
No personal income docs; deal must DSCR.
Hard money
10% down · 12.0% · 12mo
- Down + closing
- —
- Monthly P&I
- —
- Monthly cashflow
- —
- DSCR
- —
- Eligible?
- —
Short-term bridge; refi at stabilization.
Rent comps 12 comps
| Address | Beds | Baths | Sqft | Rent | $/sqft | DOM | Units | Dist |
|---|---|---|---|---|---|---|---|---|
| 11013 144th Street Ct E Unit O24-6-B Puyallup, WA | 3.0 | 1.5 | 1400 | $2,450 | $1.75 | 44d | 1 | 0.93mi |
| 17023 121st Ave E Puyallup, WA | 3.0 | 3.0 | 1837 | $4,500 | $2.45 | 44d | 1 | 1.10mi |
| 12615 172nd St E Puyallup, WA | 3.0 | 2.0 | 1298 | $2,600 | $2.00 | 2d | 1 | 1.20mi |
| 12415 172nd St E Puyallup, WA | 1.0–3.0 | 1.0–2.5 | 1091 | $2,835 | $2.60 | 0d | 11 | 1.23mi |
| 14209 103rd Avenue Ct E Puyallup, WA | 1.0–2.0 | 1.0 | 847 | $1,875 | $2.21 | 0d | 2 | 1.28mi |
| 17246 117th Ave E Puyallup, WA | 3.0 | 2.5 | 1775 | $2,750 | $1.55 | 44d | 1 | 1.31mi |
| 10511 140th Street Ct E #27 Puyallup, WA | 3.0 | 3.0 | 1311 | $2,650 | $2.02 | 25d | 1 | 1.35mi |
| 10414 140th Street Ct E #55 Puyallup, WA | 4.0 | 2.5 | 1407 | $2,595 | $1.84 | 0d | 1 | 1.39mi |
| 10414 140th St Ct E Puyallup, WA | 4.0 | 2.5 | 1407 | $2,595 | $1.84 | 2d | 1 | 1.39mi |
| 9921 158th St E Puyallup, WA | 2.0 | 1.0 | 1100 | $2,400 | $2.18 | 13d | 1 | 1.48mi |
| 12020 Sunrise Blvd E Puyallup, WA | 1.0–3.0 | 1.0–2.0 | 961 | $2,623 | $2.73 | 0d | 23 | 1.48mi |
| 13523 106th Ave E Puyallup, WA | 3.0 | 2.0 | 1404 | $2,650 | $1.89 | 25d | 1 | 1.50mi |
Listing history 10 events
-
2026-06-01status $155,000 Pending 70 DOM
-
2026-05-31days on market $155,000 Active 70 DOM
-
2026-05-02status Pending - Backup Offer Requested
-
2026-04-14status Pending
-
2026-03-31price $165,000
-
2026-03-14status Active
-
2026-03-14status Pending - Backup Offer Requested
-
2026-03-11status Pending
-
2026-03-05price $180,000
-
2026-02-03$195,000 Active
ⓘ Source: listings_history table (triggers on properties + properties_extension) + one-shot
backfill from property_details.listing_events for pre-trigger history.
Tax reassessment forecast WA · Resets to sale price
- Current annual tax
- $2,083 · $174/mo
- Projected year-2 tax
- $2,083 · $174/mo
- Expected delta
- $0/yr ($0/mo · 0.0%)
ⓘ Screening estimate from a state-policy table — verify with the county assessor before closing.
Climate risk First Street
- Flood 1/10 Low FEMA zone X (unshaded) · 0% chance over 30 yrs
- Wildfire 1/10 Low
- Heat 2/10 Low 7 d/yr ≥88°F today · 14 d/yr by 30 yrs out
- Wind 1/10 Low
- Air quality 7/10 Severe 10 unhealthy d/yr today · 10 by 30 yrs out
Nearby sold comps map
Loading sold comps map…
Walkable amenities ~0.75 mi
Loading nearby amenities…
Taxation est. · year 1
- Rental income
- $33,195
- − Mortgage interest
- −$8,682
- − Property taxes
- −$2,083
- − Insurance
- −$775
- − Repairs & maintenance
- −$2,656
- − Management
- −$2,656
- − Depreciation
- −$4,509
- Taxable income
- $11,834
- Est. tax owed @ 24.0%
- −$2,840
- After-tax cash flow
- $10,772/yr
For passive investors: Depreciation is non-cash, so a rental often shows a tax loss while cash-flowing — sheltering income. Rental losses are passive: they offset passive income freely, and up to $25,000/yr can offset ordinary (W-2) income if you actively participate and your MAGI is under $100k (phasing out to $0 by $150k); unused losses carry forward. On sale, claimed depreciation is recaptured at up to 25%, and gains may owe capital-gains tax (a 1031 exchange can defer both). Figures are a year-1 estimate at your 24.0% rate — not tax advice; consult a CPA.
Schools (NCES district)
- District
- Puyallup School District
- NCES district ID
- 5306960
- Math proficiency
- 53% ▬ 0.00%
- Reading proficiency
- 66% ▬ 0.00%
- Median HH income
- $68,291
- Composite
- 54.01/100
- National rank
- #3006
- State rank
- #52 of 291 in WA
Livability — South Hill
- Score
- 80/100
- State rank
- #84
- US rank
- #1620
Category grades
Schools grade is shown separately in the Schools card above.
Census & demographics
- Census place
- South Hill, WA
- County
- Pierce County · 788,257 people
- City population
- 76,707
- Metro
- Seattle-Tacoma-Bellevue, WA
- Population (ZIP)
- 49,007
- Household income
- $112,662
- Rent vs Own
- Severe rent burden
- 1171.0
Population outlook (Pierce County) Hauer SSP2
- Today (2025)
- 956,648 people
- By 2030
- 1,010,862 · +5.7%
- By 2040
- 1,113,170 · +16.4%
- By 2050
- 1,206,524 · +26.1%
- By 2075
- 1,436,425 · +50.2%
- By 2100
- 1,563,654 · +63.5%
Race, ethnicity, and origin ACS 2023
- Neighborhood character
- Diverse neighborhood (Simpson 0.56)
- Race & ethnicity
- White 64% Two or more races 16% Hispanic / Latino 13% Asian 7% Black 4% Native American 1% Pacific Islander 1%
- Hispanic origin (detail)
- Mexican 9% Puerto Rican 2%
- Common ancestry
- Portuguese 6% Italian 3% Slovak 2%
- Foreign-born
- 11% · Canada, South Korea, Vietnam
- Languages at home
- 86% English-only · Spanish 7% Other Asian/Pacific 2% Other Indo-European 2%
Political lean MEDSL · Pierce
- 2024 margin
- D (+10.8) · D 53.9% · R 43.1% · Other 3.0%
- 2008→2024 swing
- -1.4pp toward R · 2008: 12.2pp · 2024: 10.8pp
- All cycles
- 2024: D+10.8 2020: D+11.2 2016: D+7.5 2012: D+11.0 2008: D+12.2
Not yet ingested
- Civics
- —
Market trends
- HPI YoY
- ▼ -431.48%
- Current HPI
- 286.6617
- Rent YoY
- ▲ 1.72%
- Metro
- Seattle-Tacoma-Bellevue, WA
- State GDP YoY
- ▲ 4.65%
- F500 in state
- 22
Industry mix (Fortune 500 HQ in WA)
| Industry | F500 HQs | Revenue |
|---|---|---|
| Retail | 2 | $269B |
|
||
| Technology / Retail | 1 | $638B |
|
||
| Technology | 1 | $245B |
|
||
| Telecommunications | 1 | $38B |
|
||
| Food / Beverage | 1 | $36B |
|
||
| Automotive / Trucks | 1 | $34B |
|
||
Price history
-15.4% since first listed8 events — show timeline
- 2026-05-02 Pending — NWMLS as Distributed by MLS Grid
- 2026-04-14 Pending — NWMLS as Distributed by MLS Grid
- 2026-03-31 Price Changed $165,000 NWMLS as Distributed by MLS Grid
- 2026-03-14 Relisted — NWMLS as Distributed by MLS Grid
- 2026-03-14 Pending — NWMLS as Distributed by MLS Grid
- 2026-03-11 Pending — NWMLS as Distributed by MLS Grid
- 2026-03-05 Price Changed $180,000 NWMLS as Distributed by MLS Grid
- 2026-02-03 Listed $195,000 NWMLS as Distributed by MLS Grid
Property tax history
+5.6%/yrLatest (2026): $2,083 · +6.0% YoY. Source: county tax records.
Cash-flow waterfall
monthlySold comps — $/sqft
last 12 mo · ≤1 miLoading sold comps…