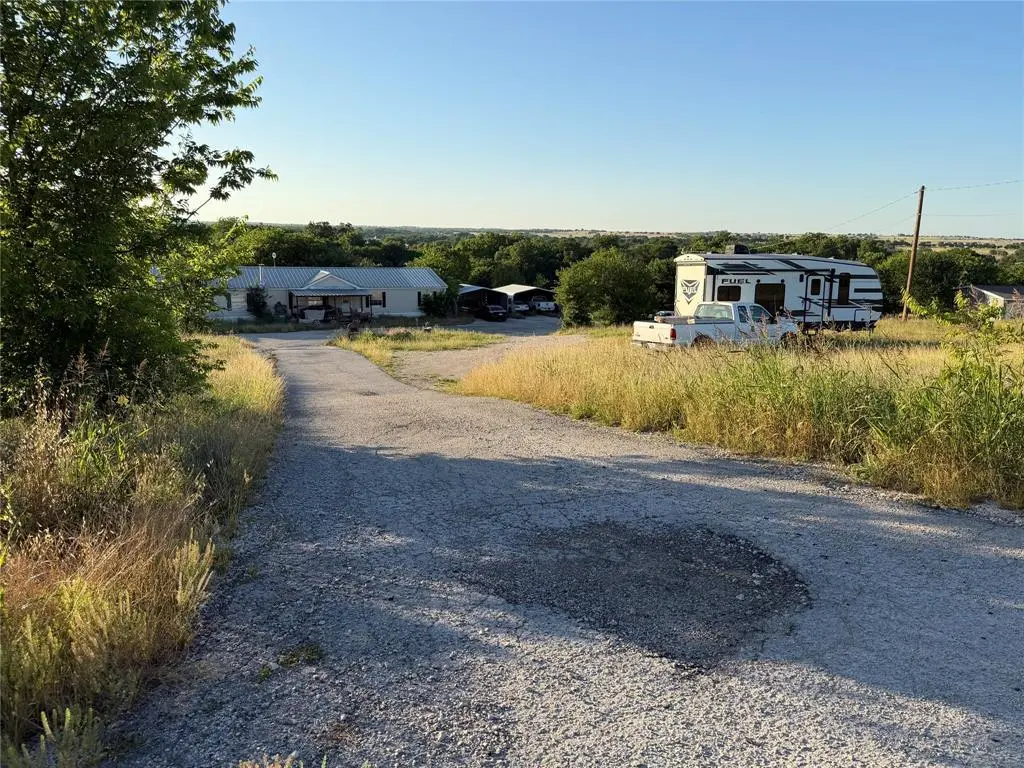
280 Coyote Trl · New Fairview, TX
Flood risk 1/10 · Minimal
- FEMA flood zone
- X (unshaded)
- Chance of flooding over 30 yrs
- 0.0%
- Est. flood insurance / yr
- $507 – $1,088
Fire risk 7/10 · Major
- Est. fire insurance / yr
- $1,222 – $2,270
Heat risk 7/10 · Major
- Hot days now (above 109°F)
- 7 days/yr
- Hot days in 30 yrs
- 21 days/yr
Wind risk 4/10 · Minor
- Chance of severe wind over 30 yrs
- 21.0%
Air-quality risk 2/10 · Minimal
- Unhealthy air days now
- 1 days/yr
- Unhealthy air days in 30 yrs
- 2 days/yr
Risk factors via First Street. Map © Google.
Why this score? — see what drove the B- grade
The composite is a weighted blend of 9 inputs, each scored 0–100. Each bar is that input's sub-score; the figure is the points it added to the 100-point composite (weight × sub-score).
- Cash flow +21.2/30.0
- ARV discount +15.0/15.0
- Appreciation +10.0/10.0
- DSCR +6.8/10.0
- 1% rule +5.1/10.0
- Schools +3.6/10.0
- Livability +3.1/5.0
- Rent growth +2.5/5.0
- Condition / age +2.5/5.0
$225,000
🖨 Deal sheet (PDF) 📄 Offer letter ✓ Due diligence
Listing remarks MLS
Dont miss out on this large manufactured home on 8.2 acres. Very nice home, 2 fireplaces, one in master the other in living, large kitchen, large bedrooms, will make this a great home for a growing family. Must see to appericate.
Key facts
- 4 acres
- Rural setting
- 4.23 acre lot
Tags
Property features AI
Finance
- Other: Horse permitted on the property; Survey available; Will not subdivide
- Financial info: Treat as clear loan type; No second mortgage indicated
- HOA & community: No association (no HOA)
Exterior
- Parking: Covered parking for 2 vehicles; 2-car carport; Gravel parking surface
- Security: No specific security features provided
- Utilities: Asphalt access; Septic system
- Home design: Residential mobile home; Single-story
- Construction: Metal roof; Built in 2000; Construction materials listed as unknown
- Exterior features: Covered patio/porch; Creek on the property; Acreage lot (approximately 4.23 acres); County road frontage; Gravel road surface
Interior
- Kitchen: Dishwasher; Microwave; Refrigerator
- Bedrooms: Four bedrooms (all on the main level) — primary bedroom on main level
- Flooring: No specific flooring details provided
- Bathrooms: Three full bathrooms
- Heating & cooling: Electric heating; Ceiling fan(s) for cooling
- Interior features: Open floorplan; Kitchen island; Pantry; Tile counters; Cable TV available; Walk-in closet(s); Six total rooms; One living area; One dining area; One-level layout
- Laundry & utility: No specific laundry details provided
Neighborhood map
What this means for you Summary
Snapshot
- This is a 4-bed/3.0-bath manufactured listed at $225k.
Deal economics
- At list price, monthly cash flow is $326 ($4k/yr) — positive.
- The deal already cash-flows at list — no discount required.
- Meets the 1% rule at list price ($2k rent vs $225k).
- Recommended offer: $222k (1.5% below list) — sets the bar for market timing.
- Cap rate 8.0% vs local median 2.5% in New Fairview — top-decile yield for the area; either an underpriced asset or a hidden risk that comps aren't pricing in. Stress-test before assuming the spread holds.
Location & tenants
- Location reads 62/100 on livability (#901 in TX) — a middle-class / working-renter tenant base. Strengths: employment A+, cost of living A+, housing A+; Watch: amenities F, commute F, health & safety F.
- Decatur ISD (town): math 40% / reading 42% proficiency, ranked #323 of 826 in TX (top 39%) — families likely to look elsewhere, expect single-tenant / working-renter base with shorter leases.
- Zoned schools: Carson El (math 37% / reading 38%, grade F, #1,744 of 4,322 statewide, top 41%, 548 students, 44% FRL); Mccarroll Middle (math 33% / reading 35%, grade F, #892 of 1,662 statewide, top 55%, 821 students, 47% FRL); Decatur H S (math 49% / reading 58%, grade C-, #428 of 1,632 statewide, top 27%, 1,140 students, 42% FRL) — zoned schools at 44% FRL track the district average.
- Market conditions: 264 active listings in the ZIP; 1 comparable units currently listed for rent nearby; solid renter incomes; 460 units permitted in Wise County in 2024 (243 in 5+ unit buildings).
Forward outlook
- In year one you build about $24k of equity ($2k loan paydown + $22k appreciation (10.0% local appreciation)).
- Wise County population projected at +27% by 2050 — long-run rental-demand tailwind backs the buy-and-hold thesis.
- At projected returns (10.0% appreciation + 3.0% rent growth), your $63k cash investment doubles in ~3 years — after that, you're playing with house money.
- By year 2, paydown + projected appreciation supports a ~$39k cash-out refi (75% LTV) — recoverable capital for the next deal without selling this one.
Negotiation context
- It's been on market 20 days — a 2% lower offer ($222k) is reasonable based on typical stale-listing flexibility.
- 2 sale attempts since 22y ago with the ask held roughly flat each time — persistent listings suggest the price (not the market) is what's stuck; bring a comps-based counter.
Risks & watch-outs
- Climate carrying-cost: major wildfire risk; extreme-heat days projected 7→21/yr by 2055 (HVAC capex compounding) — expect insurance premiums to compound above CPI over the hold.
Questions for the listing agent
- Is there a deadline driving the sale (1031 exchange, divorce, estate, relocation)? That informs how much negotiation room exists.
- Schools are F-rated, which usually means shorter tenancies and higher turnover. Who's the typical renter profile here, and what's been the actual vacancy rate?
- What's the average days-on-market for RENTAL listings here right now (not sales)? A rising rental-DOM trend means longer vacancies and softer asking-rent achievability than the comps imply.
- What's the recent tenant-quality profile in this submarket — average credit score on applications, eviction rate, late-payment / NSF rate, and stable-employment percentage? A property-management company in the area should have these aggregated.
- How much new for-sale + rental construction is in the pipeline within 1–3 miles? Heavy new supply typically softens prices + rents 12–24 months out; constrained supply supports both.
Investment metrics
- 1% rule
- 1.01% ✓
- Cap rate
- 8.03%
- Cash-on-cash
- 6.21%
- DSCR
- 1.28
- GRM
- 8.3
CMA / ARV
- ARV (on-the-fly)
- $296,960
- Comps found
- 1
Show comp detail 1 sale within ~0.75 mi
| Address | Dist | Beds/Ba | Sqft | Sold | Price | $/sf | Match |
|---|---|---|---|---|---|---|---|
| 282 Coyote Trl | 0.03mi | 4/2.0 | 2,280 (-11%) | 20mo | $265,000 | $116 | 59 |
Match score weights: distance 35% · size 25% · config 20% · recency 20%. Top-matched comps best support the ARV.
Projected returns pro-forma
10.0% appreciation · 3.0% rent growth · sell at horizon
- IRR
- 28.8%
- Equity multiple
- 3.27×
- Total profit
- $143,285
- Equity at exit
- $202,698
- IRR
- 25.0%
- Equity multiple
- 7.44×
- Total profit
- $405,571
- Equity at exit
- $437,126
Cash invested: $63,000 (down + closing). Projections, not guarantees.
Landlord ↔ Tenant lean methodology
- Overall (STATE)
- 87 Strongly Landlord-Friendly
- State Texas
- 87 Strongly Landlord-Friendly · R+5
- County
- — inherits STATE
- City
- — inherits STATE
ZIP-level market 76078
- Home prices YoY
- 6.5%
- Active inventory
- 264
- Price-to-rent
- 8.3×
Monthly cashflow live
- Estimated rent
- $2,261 medium interval (Pro) →
- Mortgage (P&I)
- −$1,180
- Tax from tax record
- −$187 /mo · $2,240/yr
- Insurance
- −$94
- HOA
- −$0
- Vacancy / Maint / Mgmt
- −$475
- Net cashflow
- $326
Break-even live
Sensitivity live
| Price | -10% $453 | -5% $390 | +0% $326 | +5% $262 | +10% $199 |
|---|---|---|---|---|---|
| Rent | -10% $147 | -5% $237 | +0% $326 | +5% $415 | +10% $505 |
| Rate | -1.0pp $439 | -0.5pp $383 | base $326 | +0.5pp $268 | +1.0pp $208 |
UW: 25.0% down · 7.5% · 30yr · 1.5% tax · 5.0% vac · 8.0% maint · 8.0% mgmt
Financing live
Cash to close
- Down payment
- $56,250
- Closing costs
- $6,750
- Reserves months
- —
- Total cash needed
- —
Loan-product check · same deal, 3 products live
Conventional
25% down · 7.5% · 30yr
- Down + closing
- —
- Monthly P&I
- —
- Monthly cashflow
- —
- DSCR
- —
- Eligible?
- —
Personal DTI + credit; lowest rate.
DSCR
20% down · 8.5% · 30yr
- Down + closing
- —
- Monthly P&I
- —
- Monthly cashflow
- —
- DSCR
- —
- Eligible?
- —
No personal income docs; deal must DSCR.
Hard money
10% down · 12.0% · 12mo
- Down + closing
- —
- Monthly P&I
- —
- Monthly cashflow
- —
- DSCR
- —
- Eligible?
- —
Short-term bridge; refi at stabilization.
Rent comps 1 comps
| Address | Beds | Baths | Sqft | Rent | $/sqft | DOM | Units | Dist |
|---|---|---|---|---|---|---|---|---|
| 348 Coyote Trl Rhome, TX | 4.0 | 2.0 | 2128 | $1,995 | $0.94 | 0d | 1 | 0.23mi |
Listing history 14 events
-
2026-06-21days on market $225,000 Active 20 DOM
-
2026-06-18days on market $225,000 Active 17 DOM
-
2026-06-17days on market $225,000 Active 16 DOM
-
2026-06-16days on market $225,000 Active 15 DOM
-
2026-06-15days on market $225,000 Active 14 DOM
-
2026-06-13days on market $225,000 Active 12 DOM
-
2026-06-13days on market $225,000 Active 11 DOM
-
2026-06-09days on market $225,000 Active 8 DOM
-
2026-06-08days on market $225,000 Active 7 DOM
-
2026-06-07days on market $225,000 Active 6 DOM
-
2026-06-04days on market $225,000 Active 3 DOM
-
2026-06-03days on market $225,000 Active 2 DOM
-
2026-06-02remarks 693-char remark
-
2026-06-02$225,000 Active 1 DOM
ⓘ Source: listings_history table (triggers on properties + properties_extension) + one-shot
backfill from property_details.listing_events for pre-trigger history.
Tax reassessment forecast TX · Resets to sale price
- Current annual tax
- $2,240 · $187/mo
- Projected year-2 tax
- $4,118 · $343/mo
- Expected delta
- +$1,878/yr (+$156/mo · 83.8%)
ⓘ Screening estimate from a state-policy table — verify with the county assessor before closing.
Climate risk First Street
- Flood 1/10 Low FEMA zone X (unshaded) · 0% chance over 30 yrs
- Wildfire 7/10 Severe
- Heat 7/10 Severe 7 d/yr ≥109°F today · 21 d/yr by 30 yrs out
- Wind 4/10 Moderate 21% chance of damaging wind over 30 yrs
- Air quality 2/10 Low 1 unhealthy d/yr today · 2 by 30 yrs out
Nearby sold comps map
Loading sold comps map…
Walkable amenities ~0.75 mi
Loading nearby amenities…
Taxation est. · year 1
- Rental income
- $27,135
- − Mortgage interest
- −$12,603
- − Property taxes
- −$2,240
- − Insurance
- −$1,125
- − Repairs & maintenance
- −$2,171
- − Management
- −$2,171
- − Depreciation
- −$6,545
- Taxable income
- $280
- Est. tax owed @ 24.0%
- −$67
- After-tax cash flow
- $3,846/yr
For passive investors: Depreciation is non-cash, so a rental often shows a tax loss while cash-flowing — sheltering income. Rental losses are passive: they offset passive income freely, and up to $25,000/yr can offset ordinary (W-2) income if you actively participate and your MAGI is under $100k (phasing out to $0 by $150k); unused losses carry forward. On sale, claimed depreciation is recaptured at up to 25%, and gains may owe capital-gains tax (a 1031 exchange can defer both). Figures are a year-1 estimate at your 24.0% rate — not tax advice; consult a CPA.
Schools (NCES district)
- District
- Decatur ISD
- NCES district ID
- 4816500
- Math proficiency
- 40% ▼ -7.00%
- Reading proficiency
- 42% ▼ -5.00%
- Median HH income
- $60,504
- Composite
- 36.33/100
- National rank
- #4691
- State rank
- #323 of 826 in TX
Livability — New Fairview
- Score
- 62/100
- State rank
- #901
- US rank
- #16172
Category grades
Schools grade is shown separately in the Schools card above.
Census & demographics
- County
- Wise County · 49,037 people
- City population
- 10,200
- Metro
- Dallas-Fort Worth-Arlington, TX
- Population (ZIP)
- 10,828
- Household income
- $99,866
- Rent vs Own
- Severe rent burden
- 10.0
Population outlook (Wise County) Hauer SSP2
- Today (2025)
- 71,620 people
- By 2030
- 75,858 · +5.9%
- By 2040
- 83,908 · +17.2%
- By 2050
- 90,717 · +26.7%
- By 2075
- 107,583 · +50.2%
- By 2100
- 114,996 · +60.6%
Race, ethnicity, and origin ACS 2023
- Neighborhood character
- Predominantly White (69%)
- Race & ethnicity
- White 69% Hispanic / Latino 24% Two or more races 11% Native American 4% Black 2%
- Hispanic origin (detail)
- Mexican 20% Puerto Rican 3%
- Common ancestry
- Slovak 2% Lithuanian 2% Italian 1%
- Foreign-born
- 6% · Canada
- Languages at home
- 85% English-only · Spanish 14% German/W. Germanic 1%
Political lean MEDSL · Wise
- 2024 margin
- Solid R (+70.0) · D 14.7% · R 84.7%
- 2008→2024 swing
- -14.3pp toward R · 2008: -55.7pp · 2024: -70.0pp
- All cycles
- 2024: R+70.0 2020: R+68.2 2016: R+69.9 2012: R+67.5 2008: R+55.7
Not yet ingested
- Civics
- —
Market trends
- HPI YoY
- ▲ 19.94%
- Current HPI
- 325.22
- Rent YoY
- —
- Metro
- Dallas-Fort Worth-Arlington, TX
- State GDP YoY
- ▲ 3.95%
- F500 in state
- 110
Industry mix (Fortune 500 HQ in TX)
| Industry | F500 HQs | Revenue |
|---|---|---|
| Energy | 16 | $1,198B |
|
||
| Technology | 5 | $198B |
|
||
| Engineering / Construction | 4 | $72B |
|
||
| Energy Services | 3 | $60B |
|
||
| Utilities | 3 | $41B |
|
||
| Healthcare | 2 | $330B |
|
||
Price history
+194.1% since first listed5 events — show timeline
- 2026-05-26 Listed $225,000 NTREIS
- 2004-08-10 Sold (MLS) — NTREIS
- 2004-05-04 Listing Removed — NTREIS
- 2004-03-26 Listed $76,500 NTREIS
- 2000-06-30 Sold (Public Records) — Public Records
Property tax history
+1.6%/yrLatest (2025): $2,240 · +8.5% YoY. Source: county tax records.
Cash-flow waterfall
monthlySold comps — $/sqft
last 12 mo · ≤1 miLoading sold comps…