 Triplex
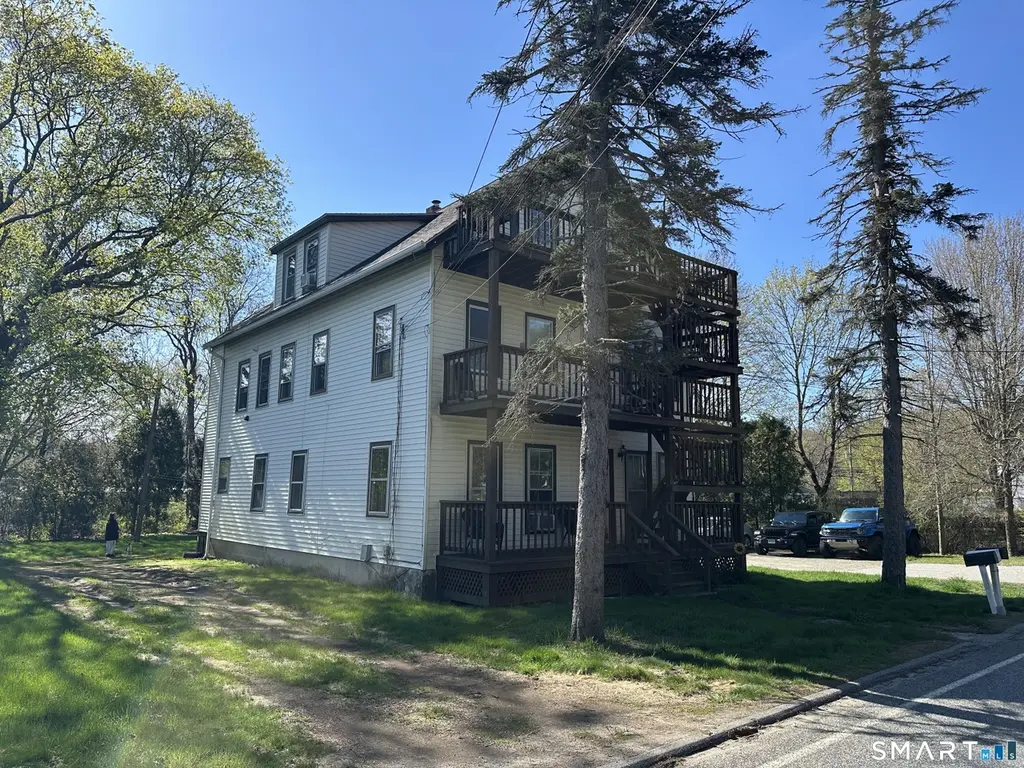
16-20 Lake St · Moosup, CT
Flood risk 7/10 · Major
- FEMA flood zone
- X (unshaded)
- Chance of flooding over 30 yrs
- 0.99%
- Est. flood insurance / yr
- $473 – $860
Fire risk 2/10 · Minimal
- Est. fire insurance / yr
- $829 – $1,539
Heat risk 4/10 · Minor
- Hot days now (above 95°F)
- 7 days/yr
- Hot days in 30 yrs
- 16 days/yr
Wind risk 6/10 · Moderate
- Chance of severe wind over 30 yrs
- 63.0%
Air-quality risk 3/10 · Minor
- Unhealthy air days now
- 2 days/yr
- Unhealthy air days in 30 yrs
- 3 days/yr
Risk factors via First Street. Map © Google.
Why this score? — see what drove the C grade
The composite is a weighted blend of 9 inputs, each scored 0–100. Each bar is that input's sub-score; the figure is the points it added to the 100-point composite (weight × sub-score).
- Cash flow +21.3/30.0
- Appreciation +9.6/10.0
- DSCR +6.8/10.0
- 1% rule +5.6/10.0
- Livability +3.4/5.0
- Schools +2.9/10.0
- Rent growth +2.5/5.0
- Condition / age +2.2/5.0
- ARV discount +1.9/15.0
$419,900
🖨 Deal sheet 📄 Offer letter ✓ Due diligence
Multi-family units
County records classify this as Multi-Family (2-4 Unit). Listing-text estimate: 3 units. confirmed
Listing remarks MLS
Looking for your next cash cow investment property? This 3 family property brings in $4,000 a month in rent roll. First floor offers 3 bedrooms 1 bathroom and has long term tenants in a lease until July. Second and third floor units have 2 bedrooms and 1 bathroom and are both month to month. Newer roof, newer decks, one newer heating system, and plenty of parking and storage! Your next investment awaits!
Key facts
- Three family home
- Convenient access
- Quiet setting
Tags
Property features AI
Finance
- Financial info: Multi-family for sale (3 units)
Exterior
- Utilities: Public water connected; Public sewer connected
- Home design: Multi-family property (3-family); Frame construction
- Construction: Asphalt shingle roof; Stone foundation
- Exterior features: Porch; Deck; Level lot; Vinyl siding; Tan exterior color
Interior
- Bedrooms: 7 total bedrooms (across all units)
- Bathrooms: 3 full bathrooms (across all units)
- Heating & cooling: Hot water heat; Oil fuel (fuel tank located in basement)
- Interior features: Full basement; Total of 15 rooms in the building
- Laundry & utility: All units have laundry hook-ups; Oil-fired domestic hot water
Neighborhood map
What this means for you Summary
Snapshot
- This is a 3 × 2-bed/1.0-bath units multifamily listed at $420k. Condition is rated fair.
Deal economics
- At list price, monthly cash flow is $557 ($7k/yr) — positive. Per door: $186/mo.
- The deal already cash-flows at list — no discount required.
- Meets the 1% rule at list price ($4k rent vs $420k).
Location & tenants
- Location reads 67/100 on livability (#113 in CT) — a middle-class / working-renter tenant base. Strengths: crime A+, housing A+, cost of living A; Watch: employment D+, amenities F, commute F.
- Plainfield School District (town): math 24% / reading 41% proficiency, ranked #117 of 153 in CT (top 76%) — families likely to look elsewhere, expect single-tenant / working-renter base with shorter leases.
- Market conditions: 27 active listings in the ZIP; 149 units permitted in Northeastern Connecticut Planning Region in 2024 (0 in 5+ unit buildings).
Forward outlook
- In year one you build about $41k of equity ($3k loan paydown + $39k appreciation (9.2% local appreciation)).
- At projected returns (9.2% appreciation + 3.0% rent growth), your $118k cash investment doubles in ~3 years — after that, you're playing with house money.
- By year 2, paydown + projected appreciation supports a ~$67k cash-out refi (75% LTV) — recoverable capital for the next deal without selling this one.
Negotiation context
- Only 8 days on market — expect competitive offers; lowballing is unlikely to land.
- 2 sale attempts since 2y ago with the ask held roughly flat each time — persistent listings suggest the price (not the market) is what's stuck; bring a comps-based counter.
Risks & watch-outs
- Watch-outs: flood insurance adds $56/mo; built in 1927 — expect roof / HVAC / electrical / plumbing capex.
- Climate carrying-cost: major flood risk; major wind risk, 63% chance of damaging wind over 30y — expect insurance premiums to compound above CPI over the hold.
Questions for the listing agent
- Can we see the unit-by-unit rent roll, current vacancy, and any below-market leases? What's the average tenancy length?
- What capital expenditures (roof, boiler, parking lot, exteriors) have been made in the last 5 years, and what's planned in the next 2?
- Have any recent inspections been done? Can we get a copy of the seller's disclosures and any deferred-maintenance estimates?
- Built in 1927 — when were the roof, HVAC, electrical panel, plumbing, and water heater last replaced?
- What's the actual annual flood-insurance premium (NFIP or private), and is the property in a SFHA with mandatory coverage?
- Is there a deadline driving the sale (1031 exchange, divorce, estate, relocation)? That informs how much negotiation room exists.
- What's the average days-on-market for RENTAL listings here right now (not sales)? A rising rental-DOM trend means longer vacancies and softer asking-rent achievability than the comps imply.
- What's the recent tenant-quality profile in this submarket — average credit score on applications, eviction rate, late-payment / NSF rate, and stable-employment percentage? A property-management company in the area should have these aggregated.
- How much new apartment / multifamily construction is in the pipeline within 1–3 miles? Heavy new supply (>2% of stock underway) typically softens rents 12–24 months out; light construction supports rent growth.
Investment metrics
- 1% rule
- 1.06% ✓
- Cap rate
- 8.04%
- Cash-on-cash
- 6.25%
- DSCR
- 1.28
- GRM
- 7.9
CMA / ARV
- ARV (on-the-fly)
- $373,632
- Comps found
- 4
Show comp detail 4 sales within ~0.75 mi
| Address | Dist | Beds/Ba | Sqft | Sold | Price | $/sf | Match |
|---|---|---|---|---|---|---|---|
| 16-20 Lake St | 0.00mi | 7/3.0 (+1) | 2,688 (0%) | 1mo | $440,000 | $164 | 94 |
| 48-50 River St | 0.55mi | 6/3.0 | 2,597 (-3%) | 19mo | $360,000 | $139 | 52 |
| 6 Ward Ln | 0.73mi | 6/3.0 | 2,518 (-6%) | 4mo | $310,000 | $123 | 52 |
| 39-43 Main St | 0.57mi | 5/3.0 (-1) | 2,864 (+6%) | 16mo | $387,500 | $135 | 44 |
Match score weights: distance 35% · size 25% · config 20% · recency 20%. Top-matched comps best support the ARV.
Projected returns pro-forma
9.19% appreciation · 3.0% rent growth · sell at horizon
- IRR
- 26.8%
- Equity multiple
- 3.05×
- Total profit
- $241,101
- Equity at exit
- $353,667
- IRR
- 23.7%
- Equity multiple
- 6.76×
- Total profit
- $677,296
- Equity at exit
- $737,940
Cash invested: $117,572 (down + closing). Projections, not guarantees.
Landlord ↔ Tenant lean methodology
- Overall (STATE)
- 27 Tenant-Leaning
- State Connecticut
- 27 Tenant-Leaning · D+7
- County
- — inherits STATE
- City
- — inherits STATE
ZIP-level market 06354
- Home prices YoY
- 3.0%
- Active inventory
- 27
- Price-to-rent
- 23.6×
Monthly cashflow live
- Estimated rent
- $4,448 medium interval (Pro) →
- Mortgage (P&I)
- −$2,202
- Tax est. 1.5%
- −$525 /mo · $6,298/yr
- Insurance
- −$175
- Flood insurance flood zone
- −$56 /mo · $666/yr
- HOA
- −$0
- Vacancy / Maint / Mgmt
- −$934
- Net cashflow
- $557
Break-even live
3-unit breakdown (identical units grouped — click to expand)
| Units | Beds | Baths | Est. rent |
|---|---|---|---|
| 3× units | 2 | 1 | $4,449 |
| #1 | 2 | 1 | $1,483 |
| #2 | 2 | 1 | $1,483 |
| #3 | 2 | 1 | $1,483 |
| Total (3 units) | $4,448 | ||
UW: 25.0% down · 7.5% · 30yr · 1.5% tax · 5.0% vac · 8.0% maint · 8.0% mgmt
Financing live
Cash to close
- Down payment
- $104,975
- Closing costs
- $12,597
- Reserves months
- —
- Total cash needed
- —
Loan-product check · same deal, 3 products live
Conventional
25% down · 7.5% · 30yr
- Down + closing
- —
- Monthly P&I
- —
- Monthly cashflow
- —
- DSCR
- —
- Eligible?
- —
Personal DTI + credit; lowest rate.
DSCR
20% down · 8.5% · 30yr
- Down + closing
- —
- Monthly P&I
- —
- Monthly cashflow
- —
- DSCR
- —
- Eligible?
- —
No personal income docs; deal must DSCR.
Hard money
10% down · 12.0% · 12mo
- Down + closing
- —
- Monthly P&I
- —
- Monthly cashflow
- —
- DSCR
- —
- Eligible?
- —
Short-term bridge; refi at stabilization.
Listing history 5 events
-
2026-05-02status Under Contract
-
2026-04-23$419,900 Active
-
2024-08-09soldstatus $377,500 Closed 407-char remark
Show marketing remark (407 chars)
Looking for your next cash cow investment property? This 3 family property brings in $4,000 a month in rent roll. First floor offers 3 bedrooms 1 bathroom and has long term tenants in a lease until July. Second and third floor units have 2 bedrooms and 1 bathroom and are both month to month. Newer roof, newer decks, one newer heating system, and plenty of parking and storage! Your next investment awaits!
-
2024-06-12status Under Contract 407-char remark
Show marketing remark (407 chars)
Looking for your next cash cow investment property? This 3 family property brings in $4,000 a month in rent roll. First floor offers 3 bedrooms 1 bathroom and has long term tenants in a lease until July. Second and third floor units have 2 bedrooms and 1 bathroom and are both month to month. Newer roof, newer decks, one newer heating system, and plenty of parking and storage! Your next investment awaits!
-
2024-05-31$375,000 Active 407-char remark
Show marketing remark (407 chars)
Looking for your next cash cow investment property? This 3 family property brings in $4,000 a month in rent roll. First floor offers 3 bedrooms 1 bathroom and has long term tenants in a lease until July. Second and third floor units have 2 bedrooms and 1 bathroom and are both month to month. Newer roof, newer decks, one newer heating system, and plenty of parking and storage! Your next investment awaits!
ⓘ Source: listings_history table (triggers on properties + properties_extension) + one-shot
backfill from property_details.listing_events for pre-trigger history.
Climate risk First Street
- Flood 7/10 Severe FEMA zone X (unshaded) · 99% chance over 30 yrs
- Wildfire 2/10 Low
- Heat 4/10 Moderate 7 d/yr ≥95°F today · 16 d/yr by 30 yrs out
- Wind 6/10 Major 63% chance of damaging wind over 30 yrs
- Air quality 3/10 Moderate 2 unhealthy d/yr today · 3 by 30 yrs out
Nearby sold comps map
Loading sold comps map…
Walkable amenities ~0.75 mi
Loading nearby amenities…
Taxation est. · year 1
- Rental income
- $53,376
- − Mortgage interest
- −$23,521
- − Property taxes
- −$6,298
- − Insurance
- −$2,766
- − Repairs & maintenance
- −$4,270
- − Management
- −$4,270
- − Depreciation
- −$12,215
- Taxable income
- $35
- Est. tax owed @ 24.0%
- −$8
- After-tax cash flow
- $6,670/yr
For passive investors: Depreciation is non-cash, so a rental often shows a tax loss while cash-flowing — sheltering income. Rental losses are passive: they offset passive income freely, and up to $25,000/yr can offset ordinary (W-2) income if you actively participate and your MAGI is under $100k (phasing out to $0 by $150k); unused losses carry forward. On sale, claimed depreciation is recaptured at up to 25%, and gains may owe capital-gains tax (a 1031 exchange can defer both). Figures are a year-1 estimate at your 24.0% rate — not tax advice; consult a CPA.
Condition & rehab AI · 13 photos
This three-family home requires moderate repairs and maintenance to improve its condition and value. Key areas for improvement include the roof, exterior siding, decks, hardwood floors, and paint. With updates, the property can be brought up to a good condition and significantly increase its resale and rental value.
Repairs flagged
- Minor Kitchen cabinets — Slight wear and tear.
- Minor Bathroom fixtures — Slight wear and tear.
- Moderate Roof — Signs of wear and potential leaks.
- Moderate Exterior siding — Signs of wear and potential damage.
- Moderate Decks and railings — Weathered and may need replacement.
- Moderate Hardwood floors — Worn and need refinishing.
- Moderate Paint — Chipped and needs touch-up.
- Minor HVAC system — May need maintenance.
- Minor Electrical and plumbing systems — May need inspection and maintenance.
Value-add opportunities
- Both Paint touch-up and fresh paint job — Fresh paint enhances curb appeal and interior aesthetics.
- Rental HVAC maintenance and potential replacement — A functional HVAC system is crucial for tenant satisfaction and comfort.
- Rental Electrical and plumbing inspections — Safe and functional systems are essential for tenant safety and comfort.
- Both Deck and railing replacement — A safe and attractive deck enhances curb appeal and tenant satisfaction.
- Both Hardwood floor refinishing — Refinished floors improve aesthetics and add value to the property.
- Both Roof inspection and potential replacement — A sound roof is crucial for the property's longevity and value.
- Both Kitchen and bathroom updates — Fresh, functional kitchens and bathrooms enhance the property's appeal and value.
- Both Landscaping and curb appeal improvements — A well-maintained yard and landscaping improve curb appeal and add value to the property.
Renovation cost estimate screening
| Repair item | Severity | Est. cost |
|---|---|---|
| Kitchen cabinets · Slight wear and tear. | Minor | $500–3,000 |
| Bathroom fixtures · Slight wear and tear. | Minor | $500–3,000 |
| Roof · Signs of wear and potential leaks. | Moderate | $3,000–15,000 |
| Exterior siding · Signs of wear and potential damage. | Moderate | $3,000–15,000 |
| Decks and railings · Weathered and may need replacement. | Moderate | $3,000–15,000 |
| Hardwood floors · Worn and need refinishing. | Moderate | $3,000–15,000 |
| Paint · Chipped and needs touch-up. | Moderate | $3,000–15,000 |
| HVAC system · May need maintenance. | Minor | $500–3,000 |
| Electrical and plumbing systems · May need inspection and maintenance. | Minor | $500–3,000 |
| Total estimated repair cost · 9 items | $17,000–87,000 |
Value-add ROI direction
- Both Paint touch-up and fresh paint job — Fresh paint enhances curb appeal and interior aesthetics. ↑
- Rental HVAC maintenance and potential replacement — A functional HVAC system is crucial for tenant satisfaction and comfort. ↑
- Rental Electrical and plumbing inspections — Safe and functional systems are essential for tenant safety and comfort. ↑
- Both Deck and railing replacement — A safe and attractive deck enhances curb appeal and tenant satisfaction. ↑
- Both Hardwood floor refinishing — Refinished floors improve aesthetics and add value to the property. ↑
- Both Roof inspection and potential replacement — A sound roof is crucial for the property's longevity and value. ↑
- Both Kitchen and bathroom updates — Fresh, functional kitchens and bathrooms enhance the property's appeal and value. ↑
- Both Landscaping and curb appeal improvements — A well-maintained yard and landscaping improve curb appeal and add value to the property. ↑
ⓘ Cost ranges are severity-bucket heuristics (US national rule-of-thumb). Get contractor quotes + a written scope before underwriting a rehab budget.
Schools (NCES district)
- District
- Plainfield School District
- NCES district ID
- 0903270
- Math proficiency
- 24% ▼ -16.00%
- Reading proficiency
- 41% ▼ -17.00%
- Median HH income
- $62,056
- Composite
- 29.36/100
- National rank
- #6531
- State rank
- #117 of 153 in CT
Livability — Moosup
- Score
- 67/100
- State rank
- #113
- US rank
- #10397
Category grades
Schools grade is shown separately in the Schools card above.
Census & demographics
- Census place
- Moosup, CT
- Population (ZIP)
- 5,840
Population outlook (Northeastern Connecticut County) Hauer SSP2
- By 2040
- 104,160
Race, ethnicity, and origin ACS 2023
- Neighborhood character
- Predominantly White (85%)
- Race & ethnicity
- White 85% Asian 6% Hispanic / Latino 5% Two or more races 4% Black 1%
- Common ancestry
- Lithuanian 18% Romanian 10% Italian 2%
- Foreign-born
- 7% · Canada, China
- Languages at home
- 93% English-only · Other Indo-European 3% Spanish 2% Chinese 1%
Political lean MEDSL · Northeastern Connecticut
- 2024 margin
- R (+15.4) · D 41.5% · R 57.0% · Other 1.5%
- All cycles
- 2024: R+15.4
Not yet ingested
- Civics
- —
Market trends
- HPI YoY
- ▲ 9.19%
- Current HPI
- 318.3935
- Rent YoY
- —
- Metro
- —
- State GDP YoY
- ▲ 1.06%
- F500 in state
- 38
Industry mix (Fortune 500 HQ in CT)
| Industry | F500 HQs | Revenue |
|---|---|---|
| Industrial Machinery | 4 | $38B |
|
||
| Insurance | 3 | $71B |
|
||
| Financial Services | 2 | $25B |
|
||
| Transportation / Logistics | 2 | $18B |
|
||
| Healthcare | 1 | $247B |
|
||
| Telecommunications | 1 | $55B |
|
||
Price history
+12.0% since first listed5 events — show timeline
- 2026-05-02 Pending — Smart MLS
- 2026-04-23 Listed $419,900 Smart MLS
- 2024-08-09 Sold (MLS) $377,500 Smart MLS
- 2024-06-12 Pending — Smart MLS
- 2024-05-31 Listed $375,000 Smart MLS
Cash-flow waterfall
monthlySold comps — $/sqft
last 12 mo · ≤1 miLoading sold comps…