 🏷️ Likely Rental
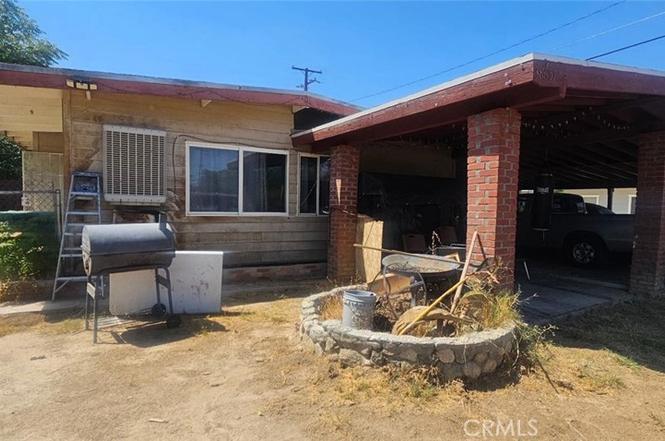
38857 9th St E · Palmdale, CA
Flood risk 1/10 · Minimal
- FEMA flood zone
- X (unshaded)
- Chance of flooding over 30 yrs
- 0.0%
- Est. flood insurance / yr
- $507 – $1,088
Fire risk 8/10 · Major
- Est. fire insurance / yr
- $659 – $1,223
Heat risk 7/10 · Major
- Hot days now (above 100°F)
- 7 days/yr
- Hot days in 30 yrs
- 16 days/yr
Wind risk 1/10 · Minimal
- Chance of severe wind over 30 yrs
- —
Air-quality risk 10/10 · Severe
- Unhealthy air days now
- 25 days/yr
- Unhealthy air days in 30 yrs
- 29 days/yr
Risk factors via First Street. Map © Google.
Why this score? — see what drove the C+ grade
The composite is a weighted blend of 9 inputs, each scored 0–100. Each bar is that input's sub-score; the figure is the points it added to the 100-point composite (weight × sub-score).
- Cash flow +24.4/30.0
- ARV discount +15.0/15.0
- DSCR +7.9/10.0
- 1% rule +6.3/10.0
- Rent growth +2.9/5.0
- Livability +2.8/5.0
- Schools +2.5/10.0
- Condition / age +2.5/5.0
- Appreciation +0.0/10.0
$325,000
🖨 Deal sheet 📄 Offer letter ✓ Due diligence
Multi-family units
County records classify this as Multi-Family (2-4 Unit). Listing-text estimate: 2 units. confirmed
Listing remarks
Excellent investment opportunity! This tenant-occupied duplex offers steady rental income with significant upside potential. Two units with one bedroom, one bath, separte entrances, two car carport and two uncovered parking spaces. Both units are in need of updates, making it an ideal fixer for investors or buyers seeking to add value. Centrally and conveniently located near shopping, parks, schools, community amenities, and freeways, this property provides a strong foundation for long-term returns. Don’t miss your chance to transform this income-producing duplex into a high-performing asset.
Key facts
- Separate entrances
- Steady rental income
- Two car carport
Tags
Property features AI
Finance
- Other: Total of 2 units; One common wall
- Financial info: Special assessments and sewer assessments
- HOA & community: Curbs, gutters, sidewalks and street lighting in the community
Exterior
- Parking: 2 uncovered parking spaces; 2 carport spaces (total 4 parking spaces)
- Utilities: Standard electric service; Natural gas connected; Public/district water; Public sewer
- Home design: Duplex; Attached property; Single-story; Community apartment
- Construction: Brick, concrete and wood construction; Composition roof
- Exterior features: Open patio; Yard; Wire fencing
Interior
- Kitchen: Gas oven; Gas range
- Bedrooms: 2 bedrooms on the main level; All bedrooms located on the ground floor
- Flooring: Tile flooring
- Bathrooms: 2 full bathrooms with bathtub and shower-in-tub
- Heating & cooling: Wall heater; Wall/window cooling
- Interior features: Granite counters; One-level living; Entry at side of home
- Laundry & utility: Laundry in kitchen
Neighborhood map
What this means for you Summary
Snapshot
- This is a 2 × 2-bed/2.0-bath units multifamily listed at $325k.
Deal economics
- At list price, monthly cash flow is $659 ($8k/yr) — positive. Per door: $330/mo.
- The deal already cash-flows at list — no discount required.
- Meets the 1% rule at list price ($4k rent vs $325k).
- Recommended offer: $286k (12.0% below list) — sets the bar for market timing.
- Cap rate 8.7% vs local median 4.5% in Palmdale — top-decile yield for the area; either an underpriced asset or a hidden risk that comps aren't pricing in. Stress-test before assuming the spread holds.
Location & tenants
- Location reads 55/100 on livability (#861 in CA) — a working-class tenant base; expect higher turnover. Strengths: housing A+; Watch: schools F, crime F, amenities F.
- Palmdale Elementary (suburban): math 20% / reading 31% proficiency, ranked #1,147 of 1,400 in CA (top 82%) — low school quality limits family demand, transient renter base, plan for 1-2y turnover; 69% free/reduced lunch — lower-income household profile, screen leases tightly.
- Market conditions: Rents rising (+1.8%/yr); 410 active listings in the ZIP; 28 comparable units currently listed for rent nearby; rentals leasing fast (median 2d on market — plan ~1-2 weeks tenant-placement turnaround); 19,697 units permitted in Los Angeles County in 2024 (9,426 in 5+ unit buildings).
- At $3,686/mo this rent would consume 71% of the median local household income ($62k/yr) (locally 4384% of renters already pay >50% of income on rent) — very limited rent-growth headroom before tenants either downsize or default.
Forward outlook
- Local home prices are declining (-3.0%/yr); year-one equity from $2k of loan paydown is wiped out by about $10k of value loss. Plan a longer hold.
- Los Angeles County population projected at +9% by 2050 — modest demand growth; plan on rents tracking national, not racing it.
Negotiation context
- It's been on market 290 days — a 12% lower offer ($286k) is reasonable based on typical stale-listing flexibility.
- 14 sale attempts since 24y ago with the ask held roughly flat each time — persistent listings suggest the price (not the market) is what's stuck; bring a comps-based counter.
- Current owner paid $160k; list at $325k implies a 103% gain — meaningful room to come down on a strong offer.
Risks & watch-outs
- Watch-outs: built in 1953 — expect roof / HVAC / electrical / plumbing capex.
- Climate carrying-cost: severe wildfire risk; extreme-heat days projected 7→16/yr by 2055 (HVAC capex compounding) — expect insurance premiums to compound above CPI over the hold.
Questions for the listing agent
- It's been on market 290 days. Have you received any prior offers? Is the seller open to a 12% concession, seller financing, or rate buy-down credit?
- Can we see the unit-by-unit rent roll, current vacancy, and any below-market leases? What's the average tenancy length?
- What capital expenditures (roof, boiler, parking lot, exteriors) have been made in the last 5 years, and what's planned in the next 2?
- Built in 1953 — when were the roof, HVAC, electrical panel, plumbing, and water heater last replaced?
- Why hasn't it sold? Are there any deal-killer items the seller is aware of (foundation, flood, title, zoning, code violations)?
- Is there a deadline driving the sale (1031 exchange, divorce, estate, relocation)? That informs how much negotiation room exists.
- Schools are F-rated, which usually means shorter tenancies and higher turnover. Who's the typical renter profile here, and what's been the actual vacancy rate?
- Crime grade is F in this area — have there been break-ins, vandalism, or insurance claims at this property in the last 3 years? What carrier currently insures it and at what premium?
- What's the average days-on-market for RENTAL listings here right now (not sales)? A rising rental-DOM trend means longer vacancies and softer asking-rent achievability than the comps imply.
- What's the recent tenant-quality profile in this submarket — average credit score on applications, eviction rate, late-payment / NSF rate, and stable-employment percentage? A property-management company in the area should have these aggregated.
- How much new apartment / multifamily construction is in the pipeline within 1–3 miles? Heavy new supply (>2% of stock underway) typically softens rents 12–24 months out; light construction supports rent growth.
Investment metrics
- 1% rule
- 1.13% ✓
- Cap rate
- 8.73%
- Cash-on-cash
- 8.69%
- DSCR
- 1.39
- GRM
- 7.3
CMA / ARV
- ARV (on-the-fly)
- $409,480
- Comps found
- 3
Show comp detail 3 sales within ~0.75 mi
| Address | Dist | Beds/Ba | Sqft | Sold | Price | $/sf | Match |
|---|---|---|---|---|---|---|---|
| 38857 Rambler Ave | 0.05mi | 2/2.0 | 1,412 (0%) | 4mo | $350,000 | $248 | 94 |
| 835 E Avenue Q | 0.10mi | 2/2.0 | 1,412 (0%) | 1mo | $410,000 | $290 | 94 |
| 38853 9th St E | 0.01mi | 2/2.0 | 1,412 (0%) | 10mo | $410,000 | $290 | 91 |
Match score weights: distance 35% · size 25% · config 20% · recency 20%. Top-matched comps best support the ARV.
Projected returns pro-forma
-3.0% appreciation · 1.76% rent growth · sell at horizon
- IRR
- -4.5%
- Equity multiple
- 0.83×
- Total profit
- $-15,171
- Equity at exit
- $48,459
- IRR
- 3.7%
- Equity multiple
- 1.25×
- Total profit
- $22,901
- Equity at exit
- $28,100
Cash invested: $91,000 (down + closing). Projections, not guarantees.
Landlord ↔ Tenant lean methodology
- Overall (STATE)
- 18 Strongly Tenant-Friendly
- State California
- 18 Strongly Tenant-Friendly · D+13
- County
- — inherits STATE
- City
- — inherits STATE
ZIP-level market 93550
- Home prices YoY
- -29.4%
- Rents YoY
- 1.8%
- Active inventory
- 410
- Price-to-rent
- 14.7×
Monthly cashflow live
- Estimated rent
- $3,686 high interval (Pro) →
- Mortgage (P&I)
- −$1,704
- Tax from tax record
- −$413 /mo · $4,958/yr
- Insurance
- −$135
- HOA
- −$0
- Vacancy / Maint / Mgmt
- −$774
- Net cashflow
- $659
Break-even live
2-unit breakdown (identical units grouped — click to expand)
| Units | Beds | Baths | Est. rent |
|---|---|---|---|
| 2× units | 2 | 2 | $3,686 |
| #1 | 2 | 2 | $1,843 |
| #2 | 2 | 2 | $1,843 |
| Total (2 units) | $3,686 | ||
UW: 25.0% down · 7.5% · 30yr · 1.5% tax · 5.0% vac · 8.0% maint · 8.0% mgmt
Financing live
Cash to close
- Down payment
- $81,250
- Closing costs
- $9,750
- Reserves months
- —
- Total cash needed
- —
Loan-product check · same deal, 3 products live
Conventional
25% down · 7.5% · 30yr
- Down + closing
- —
- Monthly P&I
- —
- Monthly cashflow
- —
- DSCR
- —
- Eligible?
- —
Personal DTI + credit; lowest rate.
DSCR
20% down · 8.5% · 30yr
- Down + closing
- —
- Monthly P&I
- —
- Monthly cashflow
- —
- DSCR
- —
- Eligible?
- —
No personal income docs; deal must DSCR.
Hard money
10% down · 12.0% · 12mo
- Down + closing
- —
- Monthly P&I
- —
- Monthly cashflow
- —
- DSCR
- —
- Eligible?
- —
Short-term bridge; refi at stabilization.
Rent comps 28 comps
| Address | Beds | Baths | Sqft | Rent | $/sqft | DOM | Units | Dist |
|---|---|---|---|---|---|---|---|---|
| 38907 Rambler Ave Palmdale, CA | 3.0 | 1.0 | 1770 | $2,100 | $1.19 | 18d | 1 | 0.05mi |
| 38594 Friendly Ave Palmdale, CA | 3.0 | 1.0 | 988 | $2,700 | $2.73 | 5d | 1 | 0.34mi |
| 38594 Friendly Ave Palmdale, CA | 3.0 | 1.0 | 988 | $2,600 | $2.63 | 1d | 1 | 0.34mi |
| 38604 10th St E Unit 5 Palmdale, CA | 2.0 | 1.0 | 950 | $1,850 | $1.95 | 1d | 1 | 0.36mi |
| 38722 11th St E Palmdale, CA | 2.0–3.0 | 2.0 | 1011 | $1,795 | $1.78 | 1d | 5 | 0.39mi |
| 509 East Avenue Q-2 Unit B Palmdale, CA | 2.0 | 2.0 | 965 | $1,800 | $1.87 | 1d | 1 | 0.41mi |
| 38572 10th Pl E Apt 4 Palmdale, CA | 2.0 | 1.0 | 950 | $1,850 | $1.95 | 1d | 1 | 0.45mi |
| 38707 12th St E Palmdale, CA | 2.0–3.0 | 1.5–2.5 | 1150 | $1,550 | $1.35 | 1d | 3 | 0.46mi |
| 38707 12th St E Apt 8 Palmdale, CA | 2.0 | 1.5 | 1100 | $1,550 | $1.41 | 1d | 1 | 0.46mi |
| 38707 12th St E Apt 8 Palmdale, CA | 2.0 | 1.5 | 1100 | $1,550 | $1.41 | 19d | 1 | 0.46mi |
| 38707 12th St E Apt 1 Palmdale, CA | 3.0 | 2.5 | 1200 | $1,950 | $1.62 | 1d | 1 | 0.46mi |
| 504 East Avenue Q3 Apt 3 Palmdale, CA | 2.0 | 1.5 | 1150 | $1,650 | $1.43 | 1d | 1 | 0.47mi |
| 38728 12th St E Palmdale, CA | 2.0 | 1.0 | 980 | $2,800 | $2.86 | 3d | 1 | 0.48mi |
| 454 East Avenue Q3 Unit 8 Palmdale, CA | 2.0 | 2.0 | 896 | $2,000 | $2.23 | 1d | 1 | 0.49mi |
| 518 East Avenue Q4 Unit 5 Palmdale, CA | 2.0 | 1.0 | 875 | $2,150 | $2.46 | 1d | 1 | 0.50mi |
| 38501 Larkin Ave Unit 38501-4 Palmdale, CA | 2.0 | 1.0 | 972 | $1,894 | $1.95 | 1d | 1 | 0.63mi |
| 38501 Larkin Ave Palmdale, CA | 3.0 | 2.0 | 996 | $2,650 | $2.66 | 3d | 1 | 0.63mi |
| 38501 Larkin Ave Unit 4 Palmdale, CA | 2.0 | 1.0 | 972 | $1,750 | $1.80 | 1d | 1 | 0.63mi |
| 38508 Sumac Ave Palmdale, CA | 3.0 | 2.0 | 1125 | $2,300 | $2.04 | 1d | 1 | 0.67mi |
| 38457 Sumac Ave Palmdale, CA | 3.0 | 2.0 | 1125 | $2,900 | $2.58 | 1d | 1 | 0.73mi |
| 38225 9th St E Unit 1 Palmdale, CA | 2.0 | 2.5 | 1500 | $2,500 | $1.67 | 1d | 1 | 0.88mi |
| 38728 17th St E Palmdale, CA | 2.0 | 1.0 | 921 | $2,050 | $2.23 | 1d | 1 | 0.98mi |
| 38232 Delacour Dr Palmdale, CA | 3.0 | 2.0 | 1328 | $3,000 | $2.26 | 1d | 1 | 1.08mi |
| 38705 20th St E Palmdale, CA | 3.0 | 1.5 | 1150 | $1,895 | $1.65 | 1d | 1 | 1.15mi |
| 37938 Palm Vista Ave Unit A Palmdale, CA | 3.0 | 1.0 | 1223 | $2,150 | $1.76 | 1d | 1 | 1.21mi |
| 38318 17th St E Palmdale, CA | 3.0 | 1.0 | 1053 | $2,650 | $2.52 | 1d | 1 | 1.22mi |
| 38657 Ladelle Ave Palmdale, CA | 3.0 | 1.0 | 1014 | $2,600 | $2.56 | 1d | 1 | 1.35mi |
| 38657 Ladelle Ave Palmdale, CA | 3.0 | 1.0 | 1014 | $2,800 | $2.76 | 17d | 1 | 1.35mi |
Listing history 50 events
-
2026-06-18days on market $325,000 Active 290 DOM
-
2026-06-17days on market $325,000 Active 289 DOM
-
2026-06-16days on market $325,000 Active 288 DOM
-
2026-06-15days on market $325,000 Active 287 DOM
-
2026-06-13days on market $325,000 Active 285 DOM
-
2026-06-13days on market $325,000 Active 284 DOM
-
2026-06-09days on market $325,000 Active 281 DOM
-
2026-06-08days on market $325,000 Active 280 DOM
-
2026-06-07days on market $325,000 Active 279 DOM
-
2026-06-04days on market $325,000 Active 276 DOM
-
2026-06-03days on market $325,000 Active 275 DOM
-
2026-06-02days on market $325,000 Active 274 DOM
-
2026-06-01days on market $325,000 Active 273 DOM
-
2026-05-31days on market $325,000 Active 272 DOM
-
2026-02-25historical
-
2025-09-01$325,000 Active
-
2025-09-01$325,000 Active
-
2020-06-09historical
-
2020-06-09status Pending Sale
-
2020-06-09status Pending
-
2020-06-09historical
-
2020-06-04$220,000 Active
-
2020-06-03$220,000 Active
-
2017-10-03soldstatus $160,000
-
2016-07-14price $159,900
-
2016-07-13historical
-
2016-07-06price $164,900
-
2016-07-05price $149,950
-
2016-06-14$179,000 Active
-
2016-06-01historical
-
2016-05-27$179,000 Active
-
2016-01-29historical
-
2016-01-27$169,000 Active
-
2016-01-26historical Hold
-
2016-01-26historical
-
2016-01-25$169,000 Active
-
2016-01-25$169,000
-
2008-08-12historical
-
2008-08-12historical
-
2008-08-12historical
-
2008-05-06$139,900
-
2008-05-02$139,900
-
2006-08-11$119,900
-
2005-05-04soldstatus $205,000
-
2004-12-28soldstatus $178,000
-
2004-12-27soldstatus $178,000
-
2004-05-12$179,900
-
2002-09-06historical
-
2002-04-23$95,000
-
2000-12-27soldstatus $65,000
ⓘ Source: listings_history table (triggers on properties + properties_extension) + one-shot
backfill from property_details.listing_events for pre-trigger history.
Tax reassessment forecast CA · Resets to sale price
- Current annual tax
- $4,958 · $413/mo
- Projected year-2 tax
- $4,958 · $413/mo
- Expected delta
- $0/yr ($0/mo · 0.0%)
ⓘ Screening estimate from a state-policy table — verify with the county assessor before closing.
Climate risk First Street
- Flood 1/10 Low FEMA zone X (unshaded) · 0% chance over 30 yrs
- Wildfire 8/10 Severe
- Heat 7/10 Severe 7 d/yr ≥100°F today · 16 d/yr by 30 yrs out
- Wind 1/10 Low
- Air quality 10/10 Extreme 25 unhealthy d/yr today · 29 by 30 yrs out
Nearby sold comps map
Loading sold comps map…
Walkable amenities ~0.75 mi
Loading nearby amenities…
Taxation est. · year 1
- Rental income
- $44,232
- − Mortgage interest
- −$18,205
- − Property taxes
- −$4,958
- − Insurance
- −$1,625
- − Repairs & maintenance
- −$3,539
- − Management
- −$3,539
- − Depreciation
- −$9,455
- Taxable income
- $2,913
- Est. tax owed @ 24.0%
- −$699
- After-tax cash flow
- $7,210/yr
For passive investors: Depreciation is non-cash, so a rental often shows a tax loss while cash-flowing — sheltering income. Rental losses are passive: they offset passive income freely, and up to $25,000/yr can offset ordinary (W-2) income if you actively participate and your MAGI is under $100k (phasing out to $0 by $150k); unused losses carry forward. On sale, claimed depreciation is recaptured at up to 25%, and gains may owe capital-gains tax (a 1031 exchange can defer both). Figures are a year-1 estimate at your 24.0% rate — not tax advice; consult a CPA.
Schools (NCES district)
- District
- Palmdale Elementary
- NCES district ID
- 0629580
- Math proficiency
- 20% ▲ 1.00%
- Reading proficiency
- 31% ▲ 1.00%
- Median HH income
- $48,652
- Composite
- 25.34/100
- National rank
- #12888
- State rank
- #1147 of 1400 in CA
Livability — Palmdale
- Score
- 55/100
- State rank
- #861
- US rank
- #23501
Category grades
Schools grade is shown separately in the Schools card above.
Census & demographics
- County
- Los Angeles County · 9,444,647 people
- City population
- 177,644
- Metro
- Los Angeles-Long Beach-Anaheim, CA
- Population (ZIP)
- 80,645
- Household income
- $62,078
- Rent vs Own
- Severe rent burden
- 4384.0
Population outlook (Los Angeles County) Hauer SSP2
- Today (2025)
- 10,940,515 people
- By 2030
- 11,256,481 · +2.9%
- By 2040
- 11,729,929 · +7.2%
- By 2050
- 11,948,407 · +9.2%
- By 2075
- 11,818,114 · +8.0%
- By 2100
- 10,842,928 · -0.9%
Race, ethnicity, and origin ACS 2023
- Neighborhood character
- Predominantly Hispanic (69%)
- Race & ethnicity
- Hispanic / Latino 69% Two or more races 15% Black 14% White 12% Asian 3% Native American 2%
- Hispanic origin (detail)
- Mexican 52%
- Foreign-born
- 26% · Canada
- Languages at home
- 42% English-only · Spanish 55% Tagalog/Filipino 1% Other Asian/Pacific 1%
Political lean MEDSL · Los Angeles
- 2024 margin
- Solid D (+32.9) · D 64.8% · R 31.9% · Other 3.3%
- 2008→2024 swing
- -7.4pp toward R · 2008: 40.4pp · 2024: 32.9pp
- All cycles
- 2024: D+32.9 2020: D+44.2 2016: D+48.0 2012: D+40.0 2008: D+40.4
Not yet ingested
- Civics
- —
Market trends
- HPI YoY
- ▼ -183.38%
- Current HPI
- 440.8844
- Rent YoY
- ▲ 1.76%
- Metro
- Los Angeles-Long Beach-Anaheim, CA
- State GDP YoY
- ▲ 3.21%
- F500 in state
- 116
Industry mix (Fortune 500 HQ in CA)
| Industry | F500 HQs | Revenue |
|---|---|---|
| Technology | 27 | $1,492B |
|
||
| Financial Services | 3 | $174B |
|
||
| Retail | 3 | $44B |
|
||
| Insurance | 3 | $26B |
|
||
| Media / Entertainment | 2 | $115B |
|
||
| Pharmaceuticals / Biotech | 2 | $62B |
|
||
Price history
+319.4% since first listed37 events — show timeline
- 2026-02-25 Listing Removed — CRMLS
- 2025-09-01 Listed $325,000 CRMLS
- 2025-09-01 Listed $325,000 CRMLS
- 2020-06-09 Listing Removed — AVMLS
- 2020-06-09 Pending — CRMLS
- 2020-06-09 Pending — AVMLS
- 2020-06-09 Listing Removed — CRMLS
- 2020-06-04 Listed $220,000 CRMLS
- 2020-06-03 Listed $220,000 AVMLS
- 2017-10-03 Sold (Public Records) $160,000 Public Records
- 2016-07-14 Price Changed $159,900 AVMLS
- 2016-07-13 Listing Removed — AVMLS
- 2016-07-06 Price Changed $164,900 AVMLS
- 2016-07-05 Price Changed $149,950 AVMLS
- 2016-06-14 Listed $179,000 AVMLS
- 2016-06-01 Listing Removed — AVMLS
- 2016-05-27 Listed $179,000 AVMLS
- 2016-01-29 Listing Removed — AVMLS
- 2016-01-27 Listed $169,000 AVMLS
- 2016-01-26 Listing Removed — SDMLS
- 2016-01-26 Delisted — CRMLS
- 2016-01-25 Listed $169,000 CRMLS
- 2016-01-25 Listed $169,000 SDMLS
- 2008-08-12 Listing Removed — AVMLS
- 2008-08-12 Listing Removed — AVMLS
- 2008-08-12 Listing Removed — CRMLS
- 2008-05-06 Listed $139,900 CRMLS
- 2008-05-02 Listed $139,900 AVMLS
- 2006-08-11 Listed $119,900 AVMLS
- 2005-05-04 Sold (Public Records) $205,000 Public Records
- 2004-12-28 Sold (MLS) $178,000 AVMLS
- 2004-12-27 Sold (Public Records) $178,000 Public Records
- 2004-05-12 Listed $179,900 AVMLS
- 2002-09-06 Listing Removed — AVMLS
- 2002-04-23 Listed $95,000 AVMLS
- 2000-12-27 Sold (Public Records) $65,000 Public Records
- 1989-04-28 Sold (Public Records) $77,500 Public Records
Property tax history
+3.1%/yrLatest (2025): $4,958 · +6.2% YoY. Source: county tax records.
Cash-flow waterfall
monthlySold comps — $/sqft
last 12 mo · ≤1 miLoading sold comps…