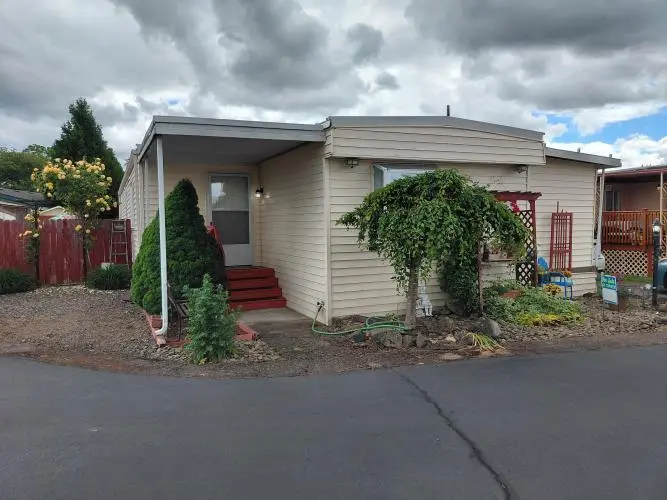
15509 SE Mill Plain Blvd #62 · Vancouver, WA
Flood risk No data
- FEMA flood zone
- —
- Chance of flooding over 30 yrs
- —
- Est. flood insurance / yr
- —
Fire risk No data
- Est. fire insurance / yr
- —
Heat risk No data
- Hot days now (above threshold)
- —
- Hot days in 30 yrs
- —
Wind risk No data
- Chance of severe wind over 30 yrs
- —
Air-quality risk No data
- Unhealthy air days now
- —
- Unhealthy air days in 30 yrs
- —
Risk factors via First Street. Map © Google.
Why this score? — see what drove the B grade
The composite is a weighted blend of 9 inputs, each scored 0–100. Each bar is that input's sub-score; the figure is the points it added to the 100-point composite (weight × sub-score).
- Cash flow +30.0/30.0
- ARV discount +10.7/15.0
- 1% rule +10.0/10.0
- DSCR +10.0/10.0
- Schools +4.3/10.0
- Livability +4.1/5.0
- Rent growth +2.8/5.0
- Condition / age +2.5/5.0
- Appreciation +0.0/10.0
$120,000
🖨 Deal sheet 📄 Offer letter ✓ Due diligence
Listing remarks
Comfortable home on a quiet dead end road at Fran Mar Villa. Convenient and affordable living with 2 bedrooms and 2 bathrooms. Perfect for shared living, or caregiver quarters; large back bedroom with separate entrance and parking space. Home has heat and a/c, newly weatherized, most of the home has drywall. Home comes with 1 carport with storage and 1 uncovered space and a storage shed in the back. Near shopping, restaurants, and bus system. Lot rent is $850 per month which includes water, sewer, and garbage. Buyer must be approved by management.
Key facts
- Separate entrance
- Large back bedroom
- Newly weatherized
Tags
Neighborhood map
What this means for you Summary
Snapshot
- This is a 2-bed/2.0-bath manufactured listed at $120k.
Deal economics
- At list price, monthly cash flow is $688 ($8k/yr) — positive.
- The deal already cash-flows at list — no discount required.
- Meets the 1% rule at list price ($2k rent vs $120k).
- Cap rate 13.2% vs local median 2.7% in Vancouver — top-decile yield for the area; either an underpriced asset or a hidden risk that comps aren't pricing in. Stress-test before assuming the spread holds.
Location & tenants
- Location reads 82/100 on livability (#62 in WA, #1,133 nationally) — a professional / high-income tenant draw. Strengths: amenities A+, commute A+, housing A+; Watch: crime F, cost of living D-.
- Evergreen School District (Clark) (urban): math 41% / reading 51% proficiency, ranked #164 of 291 in WA (top 56%) — families likely to look elsewhere, expect single-tenant / working-renter base with shorter leases.
- Market conditions: Rents rising (+1.2%/yr); 299 active listings in the ZIP; 40 comparable units currently listed for rent nearby; rentals at typical pace (median 15d on market — plan ~3-4 weeks tenant-placement turnaround); solid renter incomes; 3,547 units permitted in Clark County in 2024 (1,361 in 5+ unit buildings).
Forward outlook
- Local home prices are declining (-3.0%/yr); year-one equity from $830 of loan paydown is wiped out by about $4k of value loss. Plan a longer hold.
- Clark County population projected at +29% by 2050 — long-run rental-demand tailwind backs the buy-and-hold thesis.
- At projected returns (-3.0% appreciation + 1.2% rent growth), your $34k cash investment doubles in ~6 years — after that, you're playing with house money.
Negotiation context
- Only 9 days on market — expect competitive offers; lowballing is unlikely to land.
Questions for the listing agent
- Built in 1976 — when were the roof, HVAC, electrical panel, plumbing, and water heater last replaced?
- Is there a deadline driving the sale (1031 exchange, divorce, estate, relocation)? That informs how much negotiation room exists.
- Crime grade is F in this area — have there been break-ins, vandalism, or insurance claims at this property in the last 3 years? What carrier currently insures it and at what premium?
- What's the average days-on-market for RENTAL listings here right now (not sales)? A rising rental-DOM trend means longer vacancies and softer asking-rent achievability than the comps imply.
- What's the recent tenant-quality profile in this submarket — average credit score on applications, eviction rate, late-payment / NSF rate, and stable-employment percentage? A property-management company in the area should have these aggregated.
- How much new for-sale + rental construction is in the pipeline within 1–3 miles? Heavy new supply typically softens prices + rents 12–24 months out; constrained supply supports both.
Investment metrics
- 1% rule
- 1.60% ✓
- Cap rate
- 13.17%
- Cash-on-cash
- 24.56%
- DSCR
- 2.09
- GRM
- 5.2
CMA / ARV
- ARV (on-the-fly)
- $129,200
- Comps found
- 2
Show comp detail 2 sales within ~0.75 mi
| Address | Dist | Beds/Ba | Sqft | Sold | Price | $/sf | Match |
|---|---|---|---|---|---|---|---|
| 15411 SE Mill Plain Blvd Unit C-12 | 0.09mi | 2/2.0 | 1,331 (+3%) | 23mo | $119,000 | $89 | 72 |
| 15509 SE Mill Plain Blvd #96 | 0.00mi | 3/2.0 (+1) | 1,476 (+14%) | 19mo | $148,000 | $100 | 55 |
Match score weights: distance 35% · size 25% · config 20% · recency 20%. Top-matched comps best support the ARV.
Projected returns pro-forma
-3.0% appreciation · 1.16% rent growth · sell at horizon
- IRR
- 15.8%
- Equity multiple
- 1.62×
- Total profit
- $20,895
- Equity at exit
- $17,892
- IRR
- 23.1%
- Equity multiple
- 2.81×
- Total profit
- $60,910
- Equity at exit
- $10,375
Cash invested: $33,600 (down + closing). Projections, not guarantees.
Landlord ↔ Tenant lean methodology
- Overall (STATE)
- 28 Tenant-Leaning
- State Washington
- 28 Tenant-Leaning · D+8
- County
- — inherits STATE
- City
- — inherits STATE
ZIP-level market 98684
- Rents YoY
- 1.2%
- Active inventory
- 299
- Price-to-rent
- 5.2×
Monthly cashflow live
- Estimated rent
- $1,920 high interval (Pro) →
- Mortgage (P&I)
- −$629
- Tax est. 1.5%
- −$150 /mo · $1,800/yr
- Insurance
- −$50
- HOA
- −$0
- Vacancy / Maint / Mgmt
- −$403
- Net cashflow
- $688
Break-even live
UW: 25.0% down · 7.5% · 30yr · 1.5% tax · 5.0% vac · 8.0% maint · 8.0% mgmt
Financing live
Cash to close
- Down payment
- $30,000
- Closing costs
- $3,600
- Reserves months
- —
- Total cash needed
- —
Loan-product check · same deal, 3 products live
Conventional
25% down · 7.5% · 30yr
- Down + closing
- —
- Monthly P&I
- —
- Monthly cashflow
- —
- DSCR
- —
- Eligible?
- —
Personal DTI + credit; lowest rate.
DSCR
20% down · 8.5% · 30yr
- Down + closing
- —
- Monthly P&I
- —
- Monthly cashflow
- —
- DSCR
- —
- Eligible?
- —
No personal income docs; deal must DSCR.
Hard money
10% down · 12.0% · 12mo
- Down + closing
- —
- Monthly P&I
- —
- Monthly cashflow
- —
- DSCR
- —
- Eligible?
- —
Short-term bridge; refi at stabilization.
Rent comps 40 comps
| Address | Beds | Baths | Sqft | Rent | $/sqft | DOM | Units | Dist |
|---|---|---|---|---|---|---|---|---|
| 1000 SE 160th Ave Unit RR-342 Vancouver, WA | 2.0 | 2.0 | 906 | $1,600 | $1.77 | 23d | 1 | 0.14mi |
| 1000 SE 160th Ave Unit RR-336 Vancouver, WA | 2.0 | 2.0 | 906 | $1,600 | $1.77 | 16d | 1 | 0.14mi |
| 1000 SE 160th Ave Apt DD238 Vancouver, WA | 2.0 | 2.0 | 906 | $1,600 | $1.77 | 43d | 1 | 0.14mi |
| 1000 SE 160th Ave Apt M104 Vancouver, WA | 2.0 | 2.0 | 906 | $1,600 | $1.77 | 7d | 1 | 0.14mi |
| 1000 SE 160th Ave Apt N116 Vancouver, WA | 2.0 | 2.0 | 906 | $1,600 | $1.77 | 17d | 1 | 0.14mi |
| 1000 SE 160th Ave Apt FF257 Vancouver, WA | 3.0 | 2.0 | 1050 | $1,950 | $1.86 | 43d | 1 | 0.14mi |
| 1302 SE 155th Ave Vancouver, WA | 3.0 | 2.0 | 1558 | $2,495 | $1.60 | 44d | 1 | 0.14mi |
| 510 SE 157th Ave #35 Vancouver, WA | 2.0 | 2.0 | 1060 | $1,895 | $1.79 | 23d | 1 | 0.25mi |
| 14913 SE Mill Plain Blvd Vancouver, WA | 1.0–2.0 | 1.0–2.0 | 939 | $2,000 | $2.13 | 2d | 4 | 0.38mi |
| 112 SE 158th Ave Vancouver, WA | 3.0 | 2.0 | 1174 | $1,995 | $1.70 | 23d | 1 | 0.46mi |
| 14600 SE 7th Way Vancouver, WA | 3.0 | 2.5 | 1476 | $2,345 | $1.59 | 43d | 1 | 0.54mi |
| 15501 NE 2nd St Vancouver, WA | 3.0 | 2.0 | 1264 | $2,750 | $2.18 | 1d | 1 | 0.56mi |
| 1600 SE 168th Ave Vancouver, WA | 3.0 | 1.5 | 1210 | $2,350 | $1.94 | 4d | 1 | 0.67mi |
| 301 SE 166th Ave Vancouver, WA | 3.0 | 1.0–2.0 | 883 | $1,827 | $2.07 | 7d | 15 | 0.68mi |
| 1707 SE 145th Ct Unit 1707 Vancouver, WA | 2.0 | 2.0 | 1016 | $1,795 | $1.77 | 23d | 1 | 0.68mi |
| 14616 SE 1st St Vancouver, WA | 3.0 | 1.5 | 1200 | $1,975 | $1.65 | 43d | 1 | 0.69mi |
| Chase LNDG Gresham, OR | 3.0 | 2.5 | 1389 | $2,200 | $1.58 | 12d | 3 | 0.72mi |
| 621 SE 168th Ave Vancouver, WA | 3.0 | 1.0–2.0 | 869 | $2,079 | $2.39 | 14d | 7 | 0.73mi |
| 621 SE 168th Ave Vancouver, WA | 2.0–3.0 | 1.0–2.0 | 1125 | $1,649 | $1.47 | 2d | 9 | 0.73mi |
| 16801 SE 1st St Vancouver, WA | 2.0 | 1.0 | 960 | $1,608 | $1.68 | 23d | 1 | 0.74mi |
| 14111 SE 6th St Vancouver, WA | 2.0 | 1.5 | 1201 | $2,104 | $1.75 | 23d | 1 | 0.76mi |
| 2404 SE 161st Ct Unit X182 Vancouver, WA | 2.0 | 2.0 | 900 | $1,495 | $1.66 | 20d | 1 | 0.78mi |
| 701 SE 139th Ave Vancouver, WA | 1.0–2.0 | 1.0 | 806 | $1,600 | $1.99 | 3d | 6 | 0.82mi |
| 2610 SE 164th Ave Unit G12 Vancouver, WA | 2.0 | 2.0 | 1130 | $2,265 | $2.00 | 43d | 1 | 0.84mi |
| 905 SE 136th Ave Vancouver, WA | 2.0 | 1.0 | 945 | $1,810 | $1.92 | 2d | 2 | 0.94mi |
| 16900 SE 26th Dr Vancouver, WA | 2.0 | 2.0 | 1043 | $1,926 | $1.85 | 1d | 5 | 0.97mi |
| 600 SE 177th Ave Vancouver, WA | 1.0–3.0 | 1.0–2.0 | 931 | $2,030 | $2.18 | 1d | 20 | 0.97mi |
| 16202 NE 8th St Unit B Vancouver, WA | 2.0 | 2.5 | 1500 | $2,150 | $1.43 | 43d | 1 | 0.99mi |
| 17775 SE Mill Plain Blvd Vancouver, WA | 1.0–2.0 | 1.0–2.0 | 732 | $2,353 | $3.21 | 4d | 1 | 1.02mi |
| 16506 SE 29th St Vancouver, WA | 1.0–3.0 | 1.0–2.0 | 1062 | $1,962 | $1.85 | 1d | 13 | 1.03mi |
| 812 SE 136th Ave Vancouver, WA | 1.0–3.0 | 1.0–2.0 | 931 | $1,805 | $1.94 | 3d | 10 | 1.10mi |
| 13601 SE 19th St Vancouver, WA | 1.0–2.0 | 1.0–1.5 | 965 | $2,224 | $2.30 | 7d | 6 | 1.10mi |
| 13307 SE McGillivray Blvd Vancouver, WA | 2.0 | 2.0 | 962 | $1,895 | $1.97 | 2d | 1 | 1.13mi |
| 13314 SE 19th St Vancouver, WA | 1.0–2.0 | 1.0–2.0 | 899 | $2,274 | $2.53 | 3d | 10 | 1.13mi |
| 13213 SE 7th St Vancouver, WA | 2.0–3.0 | 1.0–2.0 | 1097 | $1,500 | $1.37 | 2d | 2 | 1.18mi |
| 3100 SE 168th Ave Vancouver, WA | 1.0–3.0 | 1.0–2.5 | 1040 | $2,205 | $2.12 | 1d | 14 | 1.18mi |
| 3114 SE 147th Pl Vancouver, WA | 2.0–3.0 | 1.5 | 1271 | $1,825 | $1.44 | 14d | 12 | 1.18mi |
| 13210 SE 7th St Unit Q73 Vancouver, WA | 3.0 | 2.0 | 1323 | $2,395 | $1.81 | 43d | 1 | 1.19mi |
| 16312 NE 12th St Unit 2 Vancouver, WA | 3.0 | 2.0 | 1616 | $2,059 | $1.27 | 43d | 1 | 1.23mi |
| 2008 SE 134th Ave Vancouver, WA | 3.0 | 2.0 | 1600 | $6,000 | $3.75 | 1d | 1 | 1.24mi |
Listing history 8 events
-
2026-06-18days on market $120,000 Active 9 DOM
-
2026-06-17days on market $120,000 Active 8 DOM
-
2026-06-16days on market $120,000 Active 7 DOM
-
2026-06-15days on market $120,000 Active 6 DOM
-
2026-06-13days on market $120,000 Active 4 DOM
-
2026-06-13days on market $120,000 Active 3 DOM
-
2026-06-10remarks 553-char remark
-
2026-06-10$120,000 Active 1 DOM
ⓘ Source: listings_history table (triggers on properties + properties_extension) + one-shot
backfill from property_details.listing_events for pre-trigger history.
Nearby sold comps map
Loading sold comps map…
Walkable amenities ~0.75 mi
Loading nearby amenities…
Taxation est. · year 1
- Rental income
- $23,044
- − Mortgage interest
- −$6,722
- − Property taxes
- −$1,800
- − Insurance
- −$600
- − Repairs & maintenance
- −$1,843
- − Management
- −$1,843
- − Depreciation
- −$3,491
- Taxable income
- $6,744
- Est. tax owed @ 24.0%
- −$1,619
- After-tax cash flow
- $6,634/yr
For passive investors: Depreciation is non-cash, so a rental often shows a tax loss while cash-flowing — sheltering income. Rental losses are passive: they offset passive income freely, and up to $25,000/yr can offset ordinary (W-2) income if you actively participate and your MAGI is under $100k (phasing out to $0 by $150k); unused losses carry forward. On sale, claimed depreciation is recaptured at up to 25%, and gains may owe capital-gains tax (a 1031 exchange can defer both). Figures are a year-1 estimate at your 24.0% rate — not tax advice; consult a CPA.
Schools (NCES district)
- District
- Evergreen School District (Clark)
- NCES district ID
- 5302700
- Math proficiency
- 41% ▼ -3.00%
- Reading proficiency
- 51% ▼ -3.00%
- Median HH income
- $59,418
- Composite
- 42.53/100
- National rank
- #6859
- State rank
- #164 of 291 in WA
Livability — Vancouver
- Score
- 82/100
- State rank
- #62
- US rank
- #1133
Category grades
Schools grade is shown separately in the Schools card above.
Census & demographics
- Census place
- Vancouver, WA
- County
- Clark County · 513,189 people
- City population
- 360,195
- Metro
- Portland-Vancouver-Hillsboro, OR-WA
- Population (ZIP)
- 37,298
- Household income
- $90,620
- Rent vs Own
- Severe rent burden
- 1481.0
Population outlook (Clark County) Hauer SSP2
- Today (2025)
- 529,610 people
- By 2030
- 563,242 · +6.4%
- By 2040
- 625,905 · +18.2%
- By 2050
- 681,558 · +28.7%
- By 2075
- 805,967 · +52.2%
- By 2100
- 877,450 · +65.7%
Race, ethnicity, and origin ACS 2023
- Neighborhood character
- Diverse neighborhood (Simpson 0.56)
- Race & ethnicity
- White 64% Hispanic / Latino 17% Two or more races 14% Asian 6% Pacific Islander 3% Black 2%
- Hispanic origin (detail)
- Mexican 12%
- Common ancestry
- Portuguese 4% Slovak 3% Iranian 2%
- Foreign-born
- 16% · Canada, China, Vietnam
- Languages at home
- 77% English-only · Spanish 10% Other Asian/Pacific 3% Russian/Polish/Slavic 3%
Political lean MEDSL · Clark
- 2024 margin
- Lean D (+7.0) · D 52.1% · R 45.1% · Other 2.8%
- 2008→2024 swing
- +0.9pp no change · 2008: 6.1pp · 2024: 7.0pp
- All cycles
- 2024: D+7.0 2020: D+5.1 2016: D+0.1 2012: D+0.1 2008: D+6.1
Not yet ingested
- Civics
- —
Market trends
- HPI YoY
- ▼ -237.93%
- Current HPI
- 290.416
- Rent YoY
- ▲ 1.16%
- Metro
- Portland-Vancouver-Hillsboro, OR-WA
- State GDP YoY
- ▲ 4.65%
- F500 in state
- 22
Industry mix (Fortune 500 HQ in WA)
| Industry | F500 HQs | Revenue |
|---|---|---|
| Retail | 2 | $269B |
|
||
| Technology / Retail | 1 | $638B |
|
||
| Technology | 1 | $245B |
|
||
| Telecommunications | 1 | $38B |
|
||
| Food / Beverage | 1 | $36B |
|
||
| Automotive / Trucks | 1 | $34B |
|
||
Price history
1 event — show timeline
- 2026-06-05 Listed $120,000 Fizber.com
Property tax history
+7.2%/yrLatest (2026): $185 · +66.8% YoY. Source: county tax records.
Cash-flow waterfall
monthlySold comps — $/sqft
last 12 mo · ≤1 miLoading sold comps…