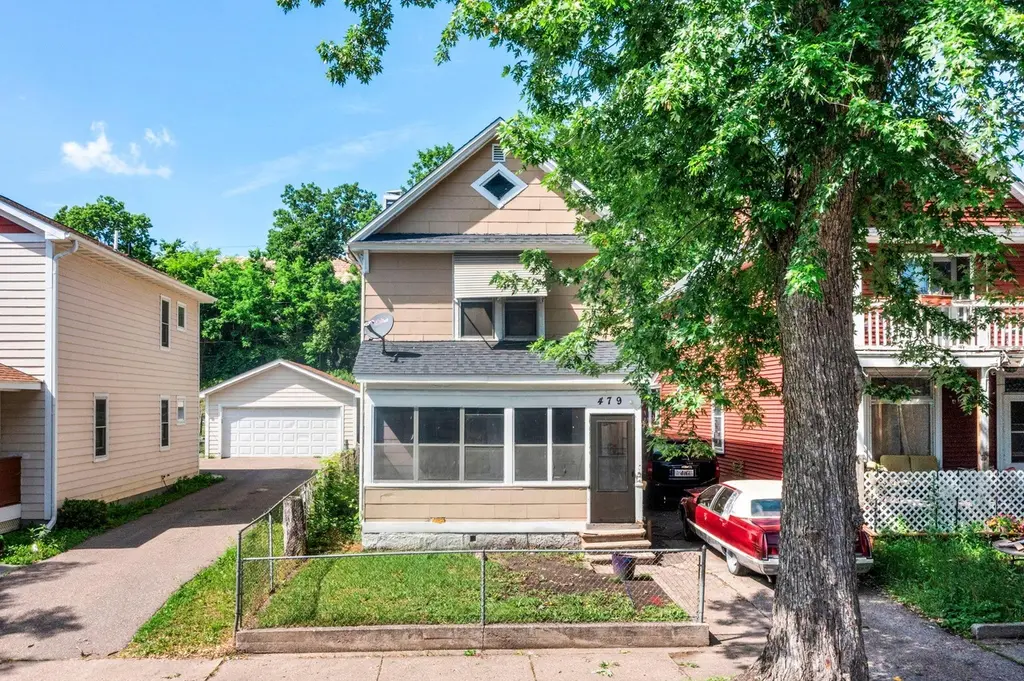
479 Hopkins St · St. Paul, MN
Flood risk 1/10 · Minimal
- FEMA flood zone
- X (unshaded)
- Chance of flooding over 30 yrs
- 0.0%
- Est. flood insurance / yr
- $473 – $860
Fire risk 1/10 · Minimal
- Est. fire insurance / yr
- $888 – $1,650
Heat risk 2/10 · Minimal
- Hot days now (above 99°F)
- 7 days/yr
- Hot days in 30 yrs
- 14 days/yr
Wind risk 2/10 · Minimal
- Chance of severe wind over 30 yrs
- —
Air-quality risk 2/10 · Minimal
- Unhealthy air days now
- 1 days/yr
- Unhealthy air days in 30 yrs
- 1 days/yr
Risk factors via First Street. Map © Google.
Why this score? — see what drove the C+ grade
The composite is a weighted blend of 9 inputs, each scored 0–100. Each bar is that input's sub-score; the figure is the points it added to the 100-point composite (weight × sub-score).
- Cash flow +27.0/30.0
- DSCR +9.3/10.0
- 1% rule +8.1/10.0
- ARV discount +7.5/15.0
- Rent growth +3.5/5.0
- Livability +2.5/5.0
- Condition / age +2.5/5.0
- Schools +2.4/10.0
- Appreciation +0.0/10.0
$200,000
🖨 Deal sheet 📄 Offer letter ✓ Due diligence
Listing remarks MLS
3 bedroom, 2 story, 1.5 bath, 1 auto detached car garage, freshly painted, updated kitchen, new fridge. Seller related to listing agent
Key facts
- Main-floor half bath
- Walk-in closet
- Front porch
Tags
Property features AI
Exterior
- Parking: Asphalt driveway; 1-car garage with garage door opener
- Security: Security system
- Utilities: City water connected; City sewer connected; Electric service with fuses; Natural gas
- Home design: Residential property; Two levels; Walk-up attic
- Construction: Stone foundation; Pitched roof; Built with foundation area listed
- Exterior features: Enclosed patio/porch and front porch; Patio and porch; Partial chain link fencing; Street lights and paved city street frontage; Light tree coverage; Public transit within ~6 blocks
Interior
- Kitchen: Cooktop; Range; Dishwasher; Microwave; Refrigerator; Freezer; Eat-in kitchen
- Bedrooms: 3 bedrooms; Bedrooms on upper level (two listed as Upper)
- Flooring: Hardwood floors; Tile floors
- Bathrooms: One full bathroom (upper level); One half bathroom (main floor)
- Heating & cooling: Hot water boiler heating; Window air conditioning units
- Interior features: Ceiling fans; Hardwood floors; Kitchen window; Primary bedroom with walk-in closet; Patio and porch; Security system; Tile floors; Walk-in closet; Walk-up attic; Daylight/lookout basement windows; Unfinished basement
- Laundry & utility: Washer and dryer (hookup in home); Laundry located in basement
Neighborhood map
What this means for you Summary
Snapshot
- This is a 3-bed/1.5-bath single-family listed at $200k.
Deal economics
- At list price, monthly cash flow is $560 ($7k/yr) — positive.
- The deal already cash-flows at list — no discount required.
- Meets the 1% rule at list price ($3k rent vs $200k).
Location & tenants
- Location reads: area grade C — affects rentability + tenant quality, not the cash-flow math above.
- St. Paul Public School District (urban): math 21% / reading 33% proficiency, ranked #270 of 301 in MN (top 90%) — low school quality limits family demand, transient renter base, plan for 1-2y turnover; 64% free/reduced lunch — lower-income household profile, screen leases tightly.
- Market conditions: Rents rising (+3.9%/yr); 58 active listings in the ZIP; 9 comparable units currently listed for rent nearby; rentals leasing fast (median 2d on market — plan ~1-2 weeks tenant-placement turnaround); 1,202 units permitted in Ramsey County in 2024 (880 in 5+ unit buildings).
- At $2,613/mo this rent would consume 58% of the median local household income ($54k/yr) (locally 818% of renters already pay >50% of income on rent) — very limited rent-growth headroom before tenants either downsize or default.
Forward outlook
- Local home prices are declining (-3.0%/yr); year-one equity from $1k of loan paydown is wiped out by about $6k of value loss. Plan a longer hold.
- Ramsey County population projected at +27% by 2050 — long-run rental-demand tailwind backs the buy-and-hold thesis.
- At projected returns (-3.0% appreciation + 3.9% rent growth), your $56k cash investment doubles in ~9 years — after that, you're playing with house money.
Negotiation context
- Only 13 days on market — expect competitive offers; lowballing is unlikely to land.
- 7 sale attempts since 24y ago with the ask held roughly flat each time — persistent listings suggest the price (not the market) is what's stuck; bring a comps-based counter.
Risks & watch-outs
- Watch-outs: built in 1902 — expect roof / HVAC / electrical / plumbing capex.
Questions for the listing agent
- Built in 1902 — when were the roof, HVAC, electrical panel, plumbing, and water heater last replaced?
- Is there a deadline driving the sale (1031 exchange, divorce, estate, relocation)? That informs how much negotiation room exists.
- What's the average days-on-market for RENTAL listings here right now (not sales)? A rising rental-DOM trend means longer vacancies and softer asking-rent achievability than the comps imply.
- What's the recent tenant-quality profile in this submarket — average credit score on applications, eviction rate, late-payment / NSF rate, and stable-employment percentage? A property-management company in the area should have these aggregated.
- How much new for-sale + rental construction is in the pipeline within 1–3 miles? Heavy new supply typically softens prices + rents 12–24 months out; constrained supply supports both.
Investment metrics
- 1% rule
- 1.31% ✓
- Cap rate
- 9.65%
- Cash-on-cash
- 11.99%
- DSCR
- 1.53
- GRM
- 6.4
CMA / ARV
No comps found within radius.
Projected returns pro-forma
-3.0% appreciation · 3.94% rent growth · sell at horizon
- IRR
- 2.7%
- Equity multiple
- 1.10×
- Total profit
- $5,848
- Equity at exit
- $29,821
- IRR
- 13.2%
- Equity multiple
- 2.11×
- Total profit
- $61,893
- Equity at exit
- $17,292
Cash invested: $56,000 (down + closing). Projections, not guarantees.
Landlord ↔ Tenant lean methodology
- Overall (STATE)
- 46 Balanced
- State Minnesota
- 46 Balanced · D+2
- County
- — inherits STATE
- City
- — inherits STATE
ZIP-level market 55130
- Home prices YoY
- -17.6%
- Rents YoY
- 3.9%
- Active inventory
- 58
- Price-to-rent
- 6.4×
Monthly cashflow live
- Estimated rent
- $2,613 high interval (Pro) →
- Mortgage (P&I)
- −$1,049
- Tax from tax record
- −$372 /mo · $4,466/yr
- Insurance
- −$83
- HOA
- −$0
- Vacancy / Maint / Mgmt
- −$549
- Net cashflow
- $560
Break-even live
UW: 25.0% down · 7.5% · 30yr · 1.5% tax · 5.0% vac · 8.0% maint · 8.0% mgmt
Financing live
Cash to close
- Down payment
- $50,000
- Closing costs
- $6,000
- Reserves months
- —
- Total cash needed
- —
Loan-product check · same deal, 3 products live
Conventional
25% down · 7.5% · 30yr
- Down + closing
- —
- Monthly P&I
- —
- Monthly cashflow
- —
- DSCR
- —
- Eligible?
- —
Personal DTI + credit; lowest rate.
DSCR
20% down · 8.5% · 30yr
- Down + closing
- —
- Monthly P&I
- —
- Monthly cashflow
- —
- DSCR
- —
- Eligible?
- —
No personal income docs; deal must DSCR.
Hard money
10% down · 12.0% · 12mo
- Down + closing
- —
- Monthly P&I
- —
- Monthly cashflow
- —
- DSCR
- —
- Eligible?
- —
Short-term bridge; refi at stabilization.
Rent comps 9 comps
| Address | Beds | Baths | Sqft | Rent | $/sqft | DOM | Units | Dist |
|---|---|---|---|---|---|---|---|---|
| 330 9th St E St Paul, MN | 1.0–2.0 | 1.0 | 978 | $2,495 | $2.55 | 3d | 3 | 0.53mi |
| 250 6th St E St Paul, MN | 2.0 | 1.0–2.0 | 980 | $2,868 | $2.93 | 1d | 16 | 0.73mi |
| 240 5th St E St Paul, MN | 2.0 | 1.0–2.0 | 949 | $2,770 | $2.92 | 2d | 10 | 0.78mi |
| 333 Sibley St Saint Paul, MN | 3.0 | 1.0–2.0 | 1358 | $3,269 | $2.41 | 10d | 10 | 0.84mi |
| 180 E Kellogg Blvd St Paul, MN | 3.0 | 1.0–2.5 | 1436 | $4,595 | $3.20 | 1d | 22 | 0.92mi |
| 101 10th St E Saint Paul, MN | 3.0 | 1.0–2.0 | 887 | $2,490 | $2.81 | 2d | 25 | 0.93mi |
| 141 4th St E Saint Paul, MN | 2.0 | 1.0–2.0 | 811 | $2,420 | $2.98 | 20d | 20 | 0.94mi |
| 111 Kellogg Blvd E Saint Paul, MN | 3.0 | 1.0–2.0 | 1000 | $2,783 | $2.78 | 1d | 20 | 1.04mi |
| 253 Kellogg Blvd W Saint Paul, MN | 2.0 | 1.0–2.0 | 1208 | $3,198 | $2.65 | 2d | 12 | 1.45mi |
Listing history 9 events
-
2026-06-18days on market $200,000 Active 13 DOM
-
2026-06-17days on market $200,000 Active 12 DOM
-
2026-06-16days on market $200,000 Active 11 DOM
-
2026-06-15days on market $200,000 Active 10 DOM
-
2026-06-13days on market $200,000 Active 8 DOM
-
2026-06-09days on market $200,000 Active 4 DOM
-
2026-06-08days on market $200,000 Active 3 DOM
-
2026-06-07remarks 699-char remark
-
2026-06-07$200,000 Active 2 DOM
ⓘ Source: listings_history table (triggers on properties + properties_extension) + one-shot
backfill from property_details.listing_events for pre-trigger history.
Tax reassessment forecast MN · Partial reset (capped growth)
- Current annual tax
- $4,466 · $372/mo
- Projected year-2 tax
- $4,466 · $372/mo
- Expected delta
- $0/yr ($0/mo · 0.0%)
ⓘ Screening estimate from a state-policy table — verify with the county assessor before closing.
Climate risk First Street
- Flood 1/10 Low FEMA zone X (unshaded) · 0% chance over 30 yrs
- Wildfire 1/10 Low
- Heat 2/10 Low 7 d/yr ≥99°F today · 14 d/yr by 30 yrs out
- Wind 2/10 Low
- Air quality 2/10 Low 1 unhealthy d/yr today · 1 by 30 yrs out
Nearby sold comps map
Loading sold comps map…
Walkable amenities ~0.75 mi
Loading nearby amenities…
Taxation est. · year 1
- Rental income
- $31,352
- − Mortgage interest
- −$11,203
- − Property taxes
- −$4,466
- − Insurance
- −$1,000
- − Repairs & maintenance
- −$2,508
- − Management
- −$2,508
- − Depreciation
- −$5,818
- Taxable income
- $3,849
- Est. tax owed @ 24.0%
- −$924
- After-tax cash flow
- $5,793/yr
For passive investors: Depreciation is non-cash, so a rental often shows a tax loss while cash-flowing — sheltering income. Rental losses are passive: they offset passive income freely, and up to $25,000/yr can offset ordinary (W-2) income if you actively participate and your MAGI is under $100k (phasing out to $0 by $150k); unused losses carry forward. On sale, claimed depreciation is recaptured at up to 25%, and gains may owe capital-gains tax (a 1031 exchange can defer both). Figures are a year-1 estimate at your 24.0% rate — not tax advice; consult a CPA.
Schools (NCES district)
- District
- St. Paul Public School District
- NCES district ID
- 2733840
- Math proficiency
- 21% ▼ -11.00%
- Reading proficiency
- 33% ▼ -7.00%
- Median HH income
- $48,316
- Composite
- 23.51/100
- National rank
- #7868
- State rank
- #270 of 301 in MN
Livability — St. Paul
No livability data for this city. (Only ~50 U.S. cities are tracked.)
Census & demographics
- Census place
- St. Paul, MN
- County
- Ramsey County · 542,837 people
- City population
- 280,599
- Metro
- Minneapolis-St. Paul-Bloomington, MN-WI
- Population (ZIP)
- 17,775
- Household income
- $54,130
- Rent vs Own
- Severe rent burden
- 818.0
Population outlook (Ramsey County) Hauer SSP2
- Today (2025)
- 603,431 people
- By 2030
- 636,459 · +5.5%
- By 2040
- 700,596 · +16.1%
- By 2050
- 765,819 · +26.9%
- By 2075
- 929,297 · +54.0%
- By 2100
- 1,053,924 · +74.7%
Race, ethnicity, and origin ACS 2023
- Neighborhood character
- Diverse neighborhood (Simpson 0.69)
- Race & ethnicity
- Asian 47% Black 22% White 19% Hispanic / Latino 9% Two or more races 4%
- Hispanic origin (detail)
- Mexican 6%
- Common ancestry
- Portuguese 3% Swedish 2% Romanian 1%
- Foreign-born
- 33% · Philippines, Canada, Vietnam
- Languages at home
- 44% English-only · Other Asian/Pacific 37% Spanish 7% Other Indo-European 1%
Political lean MEDSL · Ramsey
- 2024 margin
- Solid D (+43.3) · D 70.5% · R 27.2% · Other 2.3%
- 2008→2024 swing
- +9.4pp toward D · 2008: 33.9pp · 2024: 43.3pp
- All cycles
- 2024: D+43.3 2020: D+45.4 2016: D+39.4 2012: D+35.3 2008: D+33.9
Not yet ingested
- Civics
- —
Market trends
- HPI YoY
- ▼ -60.12%
- Current HPI
- 281.2507
- Rent YoY
- ▲ 3.94%
- Metro
- Minneapolis-St. Paul-Bloomington, MN-WI
- State GDP YoY
- ▲ 2.41%
- F500 in state
- 34
Industry mix (Fortune 500 HQ in MN)
| Industry | F500 HQs | Revenue |
|---|---|---|
| Healthcare | 2 | $407B |
|
||
| Retail | 2 | $150B |
|
||
| Consumer Goods | 2 | $32B |
|
||
| Industrial Machinery | 2 | $6B |
|
||
| Agriculture | 1 | $40B |
|
||
| Healthcare / Medical Devices | 1 | $32B |
|
||
Price history
+66.8% since first listed21 events — show timeline
- 2026-06-05 Listed $200,000 NORTHSTARMLS as Distributed by MLS Grid
- 2022-11-21 Sold (MLS) $174,000 NORTHSTARMLS as Distributed by MLS Grid
- 2022-10-20 Pending — NORTHSTARMLS as Distributed by MLS Grid
- 2022-10-13 Price Changed $175,000 NORTHSTARMLS as Distributed by MLS Grid
- 2022-09-22 Relisted — NORTHSTARMLS as Distributed by MLS Grid
- 2022-09-21 Contingent — NORTHSTARMLS as Distributed by MLS Grid
- 2022-09-14 Listed $180,000 NORTHSTARMLS as Distributed by MLS Grid
- 2022-07-07 Listing Removed — NORTHSTARMLS as Distributed by MLS Grid
- 2022-06-28 Listed $189,000 NORTHSTARMLS as Distributed by MLS Grid
- 2022-06-26 Listing Removed — NORTHSTARMLS as Distributed by MLS Grid
- 2022-06-22 Price Changed $189,000 NORTHSTARMLS as Distributed by MLS Grid
- 2022-06-03 Listed $198,000 NORTHSTARMLS as Distributed by MLS Grid
- 2022-03-03 Sold (Public Records) $130,000 Public Records
- 2022-01-20 Sold (MLS) $130,000 NORTHSTARMLS as Distributed by MLS Grid
- 2022-01-07 Pending — NORTHSTARMLS as Distributed by MLS Grid
- 2021-11-04 Price Changed $135,000 NORTHSTARMLS as Distributed by MLS Grid
- 2021-10-08 Listed $142,000 NORTHSTARMLS as Distributed by MLS Grid
- 2002-06-25 Sold (Public Records) $118,300 Public Records
- 2002-06-06 Sold (MLS) $118,300 NORTHSTARMLS as Distributed by MLS Grid
- 2002-04-29 Listed $119,900 NORTHSTARMLS as Distributed by MLS Grid
- 2002-04-22 Listing Removed — NORTHSTARMLS as Distributed by MLS Grid
Property tax history
+12.8%/yrLatest (2025): $4,466 · +58.8% YoY. Source: county tax records.
Cash-flow waterfall
monthlySold comps — $/sqft
last 12 mo · ≤1 miLoading sold comps…