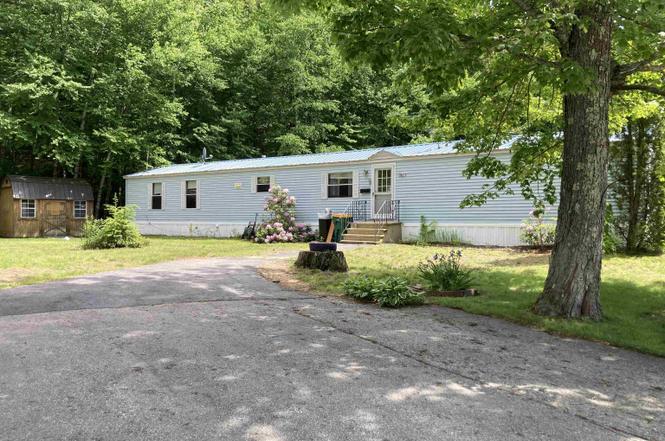
72 Royalcrest Park · Rochester, NH
Flood risk 1/10 · Minimal
- FEMA flood zone
- X
- Chance of flooding over 30 yrs
- 0.0%
- Est. flood insurance / yr
- $435 – $905
Fire risk 1/10 · Minimal
- Est. fire insurance / yr
- $507 – $941
Heat risk 3/10 · Minor
- Hot days now (above threshold)
- 7 days/yr
- Hot days in 30 yrs
- 13 days/yr
Wind risk No data
- Chance of severe wind over 30 yrs
- —
Air-quality risk 2/10 · Minimal
- Unhealthy air days now
- 1 days/yr
- Unhealthy air days in 30 yrs
- 1 days/yr
Risk factors via First Street. Map © Google.
Why this score? — see what drove the B grade
The composite is a weighted blend of 9 inputs, each scored 0–100. Each bar is that input's sub-score; the figure is the points it added to the 100-point composite (weight × sub-score).
- Cash flow +29.9/30.0
- ARV discount +10.2/15.0
- DSCR +10.0/10.0
- 1% rule +8.4/10.0
- Livability +4.2/5.0
- Rent growth +3.6/5.0
- Schools +2.7/10.0
- Condition / age +2.5/5.0
- Appreciation +0.0/10.0
$163,000
🖨 Deal sheet 📄 Offer letter ✓ Due diligence
Listing remarks MLS
EXTREMELY WELL MAINTAINED, A GREAT SHOW!3 BDRM WITH 2 FULL BATH`S. MASTER BEDROOM. VERY LARGE WITH BARN. DECL SEPERATE WASH, DRYER ROOM. CEILING FANS, AIR COND!LARGE WELL LANDSCAPED LOT. INCLUDES FRIG, RANGE, WASHER, DRYER NEGOTIABLE-A MUST SEE. VERYNICE!
Key facts
- Pantry
- One story living
- Large eat-in kitchen
Tags
Property features AI
Finance
- Other: Mobile make: Commordore; Model: 90236; Serial: CL14316A; Located in a privately maintained, paved road frontage
- HOA & community: Co-op in Hideaway Village Cooperative (mobile co-op); Park approved; Association provides snow removal and trash removal
Exterior
- Parking: Paved driveway
- Utilities: Public water; Private sewer; Eversource electric with circuit breakers; Oil fuel (Local Pride); Cable available; Underground utilities; Fiber optic and high-speed internet available
- Home design: Manufactured home (Manuf/Mobile); Light blue exterior; Metal roof; Single-story (single-level entry)
- Construction: Built in 1987; Vinyl siding; Manufactured home construction
- Exterior features: Landscaped lot; Leased lot; Level lot; Paved driveway
Interior
- Kitchen: Refrigerator
- Bedrooms: Master bedroom suite (main level); Additional bedrooms on main level
- Flooring: Laminate; Vinyl
- Bathrooms: 2 full bathrooms
- Heating & cooling: Oil heat; Hot air heating
- Interior features: Five total rooms; Living room; Full bath
- Laundry & utility: Washer; Dryer; Water heater
Neighborhood map
What this means for you Summary
Snapshot
- This is a 3-bed/2.0-bath manufactured listed at $163k.
Deal economics
- At list price, monthly cash flow is $603 ($7k/yr) — positive.
- The deal already cash-flows at list — no discount required.
- Meets the 1% rule at list price ($2k rent vs $163k).
- Cap rate 10.7% vs local median 3.6% in Rochester — top-decile yield for the area; either an underpriced asset or a hidden risk that comps aren't pricing in. Stress-test before assuming the spread holds.
Location & tenants
- Location reads 84/100 on livability (#8 in NH, #698 nationally) — a professional / high-income tenant draw. Strengths: crime A+, commute A+, cost of living A+; Watch: amenities C-.
- Rochester School District (suburban): math 27% / reading 35% proficiency, ranked #83 of 98 in NH (top 85%) — families likely to look elsewhere, expect single-tenant / working-renter base with shorter leases.
- Market conditions: Rents rising fast (+4.2%/yr); 108 active listings in the ZIP; 9 comparable units currently listed for rent nearby; rentals at typical pace (median 18d on market — plan ~3-4 weeks tenant-placement turnaround); solid renter incomes; 951 units permitted in Strafford County in 2024 (551 in 5+ unit buildings).
- This rent runs 33% of the median local income ($79k/yr) — at the standard rent-burdened threshold; future hikes will face affordability resistance.
Forward outlook
- Local home prices are declining (-3.0%/yr); year-one equity from $1k of loan paydown is wiped out by about $5k of value loss. Plan a longer hold.
- Strafford County population projected at +7% by 2050 — modest demand growth; plan on rents tracking national, not racing it.
- At projected returns (-3.0% appreciation + 4.2% rent growth), your $46k cash investment doubles in ~7 years — after that, you're playing with house money.
Negotiation context
- Only 1 days on market — expect competitive offers; lowballing is unlikely to land.
- 2 sale attempts since 27y ago with the ask held roughly flat each time — persistent listings suggest the price (not the market) is what's stuck; bring a comps-based counter.
- Current owner paid $35k; list at $163k implies a 366% gain — meaningful room to come down on a strong offer.
Questions for the listing agent
- Is there a deadline driving the sale (1031 exchange, divorce, estate, relocation)? That informs how much negotiation room exists.
- What's the average days-on-market for RENTAL listings here right now (not sales)? A rising rental-DOM trend means longer vacancies and softer asking-rent achievability than the comps imply.
- What's the recent tenant-quality profile in this submarket — average credit score on applications, eviction rate, late-payment / NSF rate, and stable-employment percentage? A property-management company in the area should have these aggregated.
- How much new for-sale + rental construction is in the pipeline within 1–3 miles? Heavy new supply typically softens prices + rents 12–24 months out; constrained supply supports both.
Investment metrics
- 1% rule
- 1.34% ✓
- Cap rate
- 10.73%
- Cash-on-cash
- 15.85%
- DSCR
- 1.71
- GRM
- 6.2
CMA / ARV
- ARV (on-the-fly)
- $173,432
- Comps found
- 2
Show comp detail 2 sales within ~0.75 mi
| Address | Dist | Beds/Ba | Sqft | Sold | Price | $/sf | Match |
|---|---|---|---|---|---|---|---|
| 25 Royalcrest | 0.08mi | 3/1.0 | 924 (-13%) | 16mo | $140,000 | $152 | 57 |
| 64 Royal Crest Park | 0.07mi | 3/1.0 | 924 (-13%) | 22mo | $151,000 | $163 | 52 |
Match score weights: distance 35% · size 25% · config 20% · recency 20%. Top-matched comps best support the ARV.
Projected returns pro-forma
-3.0% appreciation · 4.22% rent growth · sell at horizon
- IRR
- 8.1%
- Equity multiple
- 1.32×
- Total profit
- $14,726
- Equity at exit
- $24,304
- IRR
- 18.4%
- Equity multiple
- 2.62×
- Total profit
- $73,802
- Equity at exit
- $14,093
Cash invested: $45,640 (down + closing). Projections, not guarantees.
Landlord ↔ Tenant lean methodology
- Overall (STATE)
- 56 Moderately Landlord-Leaning
- State New Hampshire
- 56 Moderately Landlord-Leaning · D+1
- County
- — inherits STATE
- City
- — inherits STATE
ZIP-level market 03867
- Home prices YoY
- -22.0%
- Rents YoY
- 4.2%
- Active inventory
- 108
- Price-to-rent
- 6.2×
Monthly cashflow live
- Estimated rent
- $2,184 high interval (Pro) →
- Mortgage (P&I)
- −$855
- Tax from tax record
- −$200 /mo · $2,401/yr
- Insurance
- −$68
- HOA
- −$0
- Vacancy / Maint / Mgmt
- −$459
- Net cashflow
- $603
Break-even live
UW: 25.0% down · 7.5% · 30yr · 1.5% tax · 5.0% vac · 8.0% maint · 8.0% mgmt
Financing live
Cash to close
- Down payment
- $40,750
- Closing costs
- $4,890
- Reserves months
- —
- Total cash needed
- —
Loan-product check · same deal, 3 products live
Conventional
25% down · 7.5% · 30yr
- Down + closing
- —
- Monthly P&I
- —
- Monthly cashflow
- —
- DSCR
- —
- Eligible?
- —
Personal DTI + credit; lowest rate.
DSCR
20% down · 8.5% · 30yr
- Down + closing
- —
- Monthly P&I
- —
- Monthly cashflow
- —
- DSCR
- —
- Eligible?
- —
No personal income docs; deal must DSCR.
Hard money
10% down · 12.0% · 12mo
- Down + closing
- —
- Monthly P&I
- —
- Monthly cashflow
- —
- DSCR
- —
- Eligible?
- —
Short-term bridge; refi at stabilization.
Rent comps 9 comps
| Address | Beds | Baths | Sqft | Rent | $/sqft | DOM | Units | Dist |
|---|---|---|---|---|---|---|---|---|
| 6 Dora Dr Apt B Rochester, NH | 2.0 | 1.0 | 850 | $1,850 | $2.18 | 21d | 1 | 0.54mi |
| 664 Columbus Ave Unit 205 Rochester, NH | 2.0 | 1.0 | 1000 | $2,000 | $2.00 | 17d | 1 | 1.03mi |
| 27 Knight St Unit 2 Rochester, NH | 3.0 | 1.0 | 1400 | $2,000 | $1.43 | 43d | 1 | 1.38mi |
| 21 Knight St Unit 1 Rochester, NH | 3.0 | 1.0 | 900 | $2,300 | $2.56 | 5d | 1 | 1.38mi |
| 29 Wadleigh Rd Unit 109 Rochester, NH | 2.0 | 1.0 | 880 | $2,220 | $2.52 | 5d | 1 | 1.41mi |
| 29 Wadleigh Rd Unit 110 Rochester, NH | 2.0 | 1.0 | 880 | $1,897 | $2.16 | 43d | 1 | 1.41mi |
| 29 Wadleigh Rd Unit 312 Rochester, NH | 2.0 | 1.0 | 880 | $2,220 | $2.52 | 17d | 1 | 1.41mi |
| 29 Wadleigh Rd Unit 305 Rochester, NH | 2.0 | 1.0 | 880 | $2,220 | $2.52 | 14d | 1 | 1.41mi |
| 12 Beaver Way Unit 101 Rochester, NH | 2.0 | 1.5 | 1375 | $2,000 | $1.45 | 23d | 1 | 1.48mi |
Listing history 2 events
-
2026-06-19remarks 699-char remark
-
2026-06-19$163,000 Active 1 DOM
ⓘ Source: listings_history table (triggers on properties + properties_extension) + one-shot
backfill from property_details.listing_events for pre-trigger history.
Tax reassessment forecast NH · Partial reset (capped growth)
- Current annual tax
- $2,401 · $200/mo
- Projected year-2 tax
- $2,977 · $248/mo
- Expected delta
- +$576/yr (+$48/mo · 24.0%)
ⓘ Screening estimate from a state-policy table — verify with the county assessor before closing.
Climate risk First Street
- Flood 1/10 Low FEMA zone X · 0% chance over 30 yrs
- Wildfire 1/10 Low
- Heat 3/10 Moderate
- Air quality 2/10 Low 1 unhealthy d/yr today · 1 by 30 yrs out
Nearby sold comps map
Loading sold comps map…
Walkable amenities ~0.75 mi
Loading nearby amenities…
Taxation est. · year 1
- Rental income
- $26,212
- − Mortgage interest
- −$9,131
- − Property taxes
- −$2,401
- − Insurance
- −$815
- − Repairs & maintenance
- −$2,097
- − Management
- −$2,097
- − Depreciation
- −$4,742
- Taxable income
- $4,930
- Est. tax owed @ 24.0%
- −$1,183
- After-tax cash flow
- $6,051/yr
For passive investors: Depreciation is non-cash, so a rental often shows a tax loss while cash-flowing — sheltering income. Rental losses are passive: they offset passive income freely, and up to $25,000/yr can offset ordinary (W-2) income if you actively participate and your MAGI is under $100k (phasing out to $0 by $150k); unused losses carry forward. On sale, claimed depreciation is recaptured at up to 25%, and gains may owe capital-gains tax (a 1031 exchange can defer both). Figures are a year-1 estimate at your 24.0% rate — not tax advice; consult a CPA.
Schools (NCES district)
- District
- Rochester School District
- NCES district ID
- 3305940
- Math proficiency
- 27% ▼ -15.00%
- Reading proficiency
- 35% ▼ -14.00%
- Median HH income
- $51,080
- Composite
- 27.11/100
- National rank
- #7039
- State rank
- #83 of 98 in NH
Livability — Rochester
- Score
- 84/100
- State rank
- #8
- US rank
- #698
Category grades
Schools grade is shown separately in the Schools card above.
Census & demographics
- Census place
- Rochester, NH
- County
- Strafford County · 75,181 people
- City population
- 22,732
- Metro
- Boston-Cambridge-Newton, MA-NH
- Population (ZIP)
- 22,732
- Household income
- $78,674
- Rent vs Own
- Severe rent burden
- 663.0
Population outlook (Strafford County) Hauer SSP2
- Today (2025)
- 132,503 people
- By 2030
- 135,377 · +2.2%
- By 2040
- 139,609 · +5.4%
- By 2050
- 141,803 · +7.0%
- By 2075
- 149,280 · +12.7%
- By 2100
- 148,667 · +12.2%
Race, ethnicity, and origin ACS 2023
- Neighborhood character
- Predominantly White (93%)
- Race & ethnicity
- White 93% Two or more races 4% Hispanic / Latino 2% Asian 1%
- Common ancestry
- Lithuanian 12% Romanian 2% Serbian 2%
- Foreign-born
- 3% · Canada
- Languages at home
- 96% English-only · Spanish 1% French/Haitian/Cajun 1%
Political lean MEDSL · Strafford
- 2024 margin
- D (+12.1) · D 55.5% · R 43.5% · Other 1.0%
- 2008→2024 swing
- -8.3pp toward R · 2008: 20.4pp · 2024: 12.1pp
- All cycles
- 2024: D+12.1 2020: D+15.2 2016: D+8.6 2012: D+14.5 2008: D+20.4
Not yet ingested
- Civics
- —
Market trends
- HPI YoY
- ▼ -107.34%
- Current HPI
- 379.5755
- Rent YoY
- ▲ 4.22%
- Metro
- Boston-Cambridge-Newton, MA-NH
- State GDP YoY
- —
- F500 in state
- 0
Price history
+359.2% since first listed5 events — show timeline
- 2026-06-16 Listed $163,000 PrimeMLS
- 1999-06-11 Sold (Public Records) $35,000 Public Records
- 1999-06-11 Sold (MLS) $35,000 PrimeMLS
- 1999-04-14 Delisted — PrimeMLS
- 1999-03-31 Listed $35,500 PrimeMLS
Property tax history
+10.6%/yrLatest (2025): $2,401 · +3.0% YoY. Source: county tax records.
Cash-flow waterfall
monthlySold comps — $/sqft
last 12 mo · ≤1 miLoading sold comps…