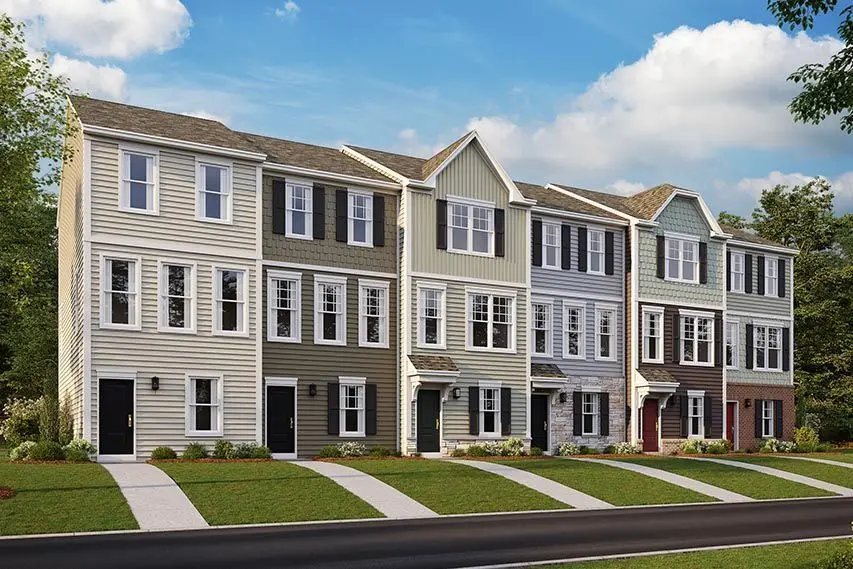
27 Democracy Mews · Ranson, WV
Flood risk 9/10 · Severe
- FEMA flood zone
- X (unshaded)
- Chance of flooding over 30 yrs
- 0.99%
- Est. flood insurance / yr
- $507 – $1,088
Fire risk 3/10 · Minor
- Est. fire insurance / yr
- $787 – $1,461
Heat risk 5/10 · Moderate
- Hot days now (above 104°F)
- 7 days/yr
- Hot days in 30 yrs
- 15 days/yr
Wind risk 2/10 · Minimal
- Chance of severe wind over 30 yrs
- 3.0%
Air-quality risk 2/10 · Minimal
- Unhealthy air days now
- 1 days/yr
- Unhealthy air days in 30 yrs
- 2 days/yr
Risk factors via First Street. Map © Google.
Why this score? — see what drove the D- grade
The composite is a weighted blend of 9 inputs, each scored 0–100. Each bar is that input's sub-score; the figure is the points it added to the 100-point composite (weight × sub-score).
- Appreciation +10.0/10.0
- ARV discount +7.5/15.0
- Cash flow +7.1/30.0
- Schools +3.4/10.0
- Livability +3.3/5.0
- Rent growth +2.5/5.0
- Condition / age +2.5/5.0
- 1% rule +1.9/10.0
- DSCR +1.3/10.0
$289,990
🖨 Deal sheet (PDF) 📄 Offer letter ✓ Due diligence
Listing remarks
You deserve a home that allows you to explore big possibilities, while still being wrapped in a convenient package. The Charleston delivers a warm townhome for you or your family. Good times await in this two bedroom, three level townhome. The entry level a finished lower level recreation room for a getaway space to use as you please. The main floor features a spacious family room, dining area and open-concept kitchen. Spend quality time with friends and family in this inviting space. When it's time to relax or sip on your morning coffee, enjoy the spacious deck right off the family room. Upstairs, you'll find two spacious bedroom suites and two full baths. The Charleston lacks nothing when
Key facts
- Pantry
- Open-concept kitchen
- Linen closet
Tags
Property features AI
Finance
- Other: Address: 27 Democracy Mews, Ranson, WV 25438; Status: Active; Inventory type: Spec
- Financial info: List price $289,990
Exterior
- Parking: 1 garage space (1 total parking space)
- Home design: Single-family property (The Charleston plan)
- Exterior features: Living area approximately 1,387
Interior
- Bedrooms: 2 bedrooms
- Bathrooms: 2 full bathrooms and 1 half bathroom
- Interior features: Spec home built as The Charleston plan
Neighborhood map
What this means for you Summary
Snapshot
- This is a 2-bed/2.5-bath townhouse listed at $290k.
Deal economics
- At list price, monthly cash flow is $-483 ($-6k/yr) — negative.
- To cash-flow at today's rent, offer at most $220k (24.1% below list).
- To meet the 1% rule (rent ≥ 1% of price), the offer needs to be $201k (30.7% below list).
- Recommended offer: $201k (30.7% below list) — sets the bar for 1% rule.
- Cap rate 4.6% vs local median 3.8% in Ranson — meaningfully above typical; check what's discounted (condition, days-on-market, listing class) to confirm the premium yield is real.
Location & tenants
- Location reads 66/100 on livability (#100 in WV) — a middle-class / working-renter tenant base. Strengths: crime A+, housing A+, cost of living A-; Watch: schools F, amenities F, commute F.
- Jefferson County Schools (rural): math 29% / reading 46% proficiency, ranked #6 of 55 in WV (top 11%) — families likely to look elsewhere, expect single-tenant / working-renter base with shorter leases.
- Market conditions: 324 active listings in the ZIP; 15 comparable units currently listed for rent nearby; rentals at typical pace (median 14d on market — plan ~3-4 weeks tenant-placement turnaround); solid renter incomes; 1,162 units permitted in Jefferson County in 2024 (360 in 5+ unit buildings).
Forward outlook
- In year one you build about $31k of equity ($2k loan paydown + $29k appreciation (10.0% local appreciation)).
- Jefferson County population projected at +13% by 2050 — modest demand growth; plan on rents tracking national, not racing it.
- By year 2, paydown + projected appreciation supports a ~$50k cash-out refi (75% LTV) — recoverable capital for the next deal without selling this one.
Negotiation context
- It's been on market 32 days — a 3% lower offer ($281k) is reasonable based on typical stale-listing flexibility.
Risks & watch-outs
- Watch-outs: flood insurance adds $66/mo.
- Climate carrying-cost: severe flood risk; extreme-heat days projected 7→15/yr by 2055 (HVAC capex compounding) — expect insurance premiums to compound above CPI over the hold.
Questions for the listing agent
- What do current leases actually rent for vs. the listed asking? Can we see a recent rent roll and the last 12 months of T-12 income?
- It's been on market 32 days. Have you received any prior offers? Is the seller open to a 31% concession, seller financing, or rate buy-down credit?
- What's the actual annual flood-insurance premium (NFIP or private), and is the property in a SFHA with mandatory coverage?
- Is there a deadline driving the sale (1031 exchange, divorce, estate, relocation)? That informs how much negotiation room exists.
- Schools are F-rated, which usually means shorter tenancies and higher turnover. Who's the typical renter profile here, and what's been the actual vacancy rate?
- The area grade is low — what's the realistic commute time and amenity access for the typical tenant pool here? Any planned neighborhood developments (good or bad) we should know about?
- What's the average days-on-market for RENTAL listings here right now (not sales)? A rising rental-DOM trend means longer vacancies and softer asking-rent achievability than the comps imply.
- What's the recent tenant-quality profile in this submarket — average credit score on applications, eviction rate, late-payment / NSF rate, and stable-employment percentage? A property-management company in the area should have these aggregated.
- How much new for-sale + rental construction is in the pipeline within 1–3 miles? Heavy new supply typically softens prices + rents 12–24 months out; constrained supply supports both.
Investment metrics
- 1% rule
- 0.69% ✗
- Cap rate
- 4.57%
- Cash-on-cash
- -6.15%
- DSCR
- 0.73
- GRM
- 12.0
CMA / ARV
- ARV (on-the-fly)
- $289,883
- Comps found
- 12
Show comp detail 12 sales within ~0.75 mi
| Address | Dist | Beds/Ba | Sqft | Sold | Price | $/sf | Match |
|---|---|---|---|---|---|---|---|
| 372 Anthem St #448 | 0.03mi | 2/2.5 | 1,387 (0%) | 1mo | $288,990 | $208 | 98 |
| 364 Anthem St | 0.03mi | 2/2.5 | 1,387 (0%) | 1mo | $292,490 | $211 | 98 |
| 328 Anthem St | 0.07mi | 2/2.5 | 1,387 (0%) | 5mo | $274,990 | $198 | 92 |
| 352 Anthem St #443 | 0.04mi | 3/2.5 (+1) | 1,387 (0%) | 1mo | $292,990 | $211 | 92 |
| 491 National St | 0.10mi | 2/2.5 | 1,387 (0%) | 5mo | $270,990 | $195 | 91 |
| 483 National St | 0.10mi | 2/2.5 | 1,387 (0%) | 5mo | $268,990 | $194 | 91 |
| 95 Anthem St | 0.29mi | 2/2.5 | 1,387 (0%) | 7mo | $290,280 | $209 | 81 |
| 10 Coolidge Ave | 0.34mi | 2/2.5 | 1,387 (0%) | 7mo | $309,990 | $223 | 78 |
| 291 Short Br Lot 236 QUINCY | 0.73mi | 2/2.5 | 1,315 (-5%) | 4mo | $275,000 | $209 | 54 |
| 220 Swan Field Ave Lot 233 QUINCY | 0.70mi | 2/3.0 | 1,315 (-5%) | 5mo | $289,290 | $220 | 52 |
| 31 Short Br Lot 169 QUINCY | 0.57mi | 3/3.5 (+1) | 1,315 (-5%) | 6mo | $265,000 | $202 | 51 |
| 23 Short Br Lot 171 QUINCY | 0.57mi | 3/3.5 (+1) | 1,315 (-5%) | 6mo | $275,690 | $210 | 51 |
Match score weights: distance 35% · size 25% · config 20% · recency 20%. Top-matched comps best support the ARV.
Projected returns pro-forma
10.0% appreciation · 3.0% rent growth · sell at horizon
- IRR
- 19.3%
- Equity multiple
- 2.57×
- Total profit
- $127,275
- Equity at exit
- $261,246
- IRR
- 17.8%
- Equity multiple
- 5.92×
- Total profit
- $399,113
- Equity at exit
- $563,387
Cash invested: $81,197 (down + closing). Projections, not guarantees.
Landlord ↔ Tenant lean methodology
- Overall (STATE)
- 83 Strongly Landlord-Friendly
- State West Virginia
- 83 Strongly Landlord-Friendly · R+22
- County
- — inherits STATE
- City
- — inherits STATE
ZIP-level market 25438
- Home prices YoY
- 10.3%
- Active inventory
- 324
- Price-to-rent
- 12.0×
Monthly cashflow live
- Estimated rent
- $2,010 high interval (Pro) →
- Mortgage (P&I)
- −$1,521
- Tax est. 1.5%
- −$362 /mo · $4,350/yr
- Insurance
- −$121
- Flood insurance flood zone
- −$66 /mo · $798/yr
- HOA
- −$0
- Vacancy / Maint / Mgmt
- −$422
- Net cashflow
- $-483
Break-even live
Sensitivity live
| Price | -10% $-282 | -5% $-382 | +0% $-483 | +5% $-583 | +10% $-683 |
|---|---|---|---|---|---|
| Rent | -10% $-641 | -5% $-562 | +0% $-483 | +5% $-403 | +10% $-324 |
| Rate | -1.0pp $-336 | -0.5pp $-409 | base $-483 | +0.5pp $-558 | +1.0pp $-634 |
UW: 25.0% down · 7.5% · 30yr · 1.5% tax · 5.0% vac · 8.0% maint · 8.0% mgmt
Financing live
Cash to close
- Down payment
- $72,498
- Closing costs
- $8,700
- Reserves months
- —
- Total cash needed
- —
Loan-product check · same deal, 3 products live
Conventional
25% down · 7.5% · 30yr
- Down + closing
- —
- Monthly P&I
- —
- Monthly cashflow
- —
- DSCR
- —
- Eligible?
- —
Personal DTI + credit; lowest rate.
DSCR
20% down · 8.5% · 30yr
- Down + closing
- —
- Monthly P&I
- —
- Monthly cashflow
- —
- DSCR
- —
- Eligible?
- —
No personal income docs; deal must DSCR.
Hard money
10% down · 12.0% · 12mo
- Down + closing
- —
- Monthly P&I
- —
- Monthly cashflow
- —
- DSCR
- —
- Eligible?
- —
Short-term bridge; refi at stabilization.
Rent comps 15 comps
| Address | Beds | Baths | Sqft | Rent | $/sqft | DOM | Units | Dist |
|---|---|---|---|---|---|---|---|---|
| 495 National St Ranson, WV | 2.0 | 2.5 | 1330 | $1,850 | $1.39 | 25d | 1 | 0.08mi |
| 163 Anthem St Ranson, WV | 2.0 | 2.5 | 1386 | $2,500 | $1.80 | 5d | 1 | 0.23mi |
| 300 Presidents Pointe Ave Ranson, WV | 3.0 | 2.5 | 1731 | $2,200 | $1.27 | 20d | 1 | 0.23mi |
| 99 Anthem St Ranson, WV | 2.0 | 2.5 | 1387 | $2,000 | $1.44 | 25d | 1 | 0.27mi |
| 34 Coolidge Ave Ranson, WV | 2.0 | 2.5 | 1397 | $1,850 | $1.32 | 3d | 1 | 0.30mi |
| 36 Anthem St Ranson, WV | 2.0 | 2.5 | 1397 | $1,800 | $1.29 | 25d | 1 | 0.33mi |
| 214 Coolidge Ave Ranson, WV | 2.0 | 2.5 | 1387 | $1,925 | $1.39 | 20d | 1 | 0.38mi |
| 1130 Stallion St Ranson, WV | 3.0 | 2.5 | 1648 | $1,900 | $1.15 | 6d | 1 | 0.74mi |
| 271 Swan Field Ave Charles Town, WV | 3.0 | 2.5 | 1786 | $2,100 | $1.18 | 5d | 1 | 0.77mi |
| 452 18th Ave Ranson, WV | 3.0 | 2.5 | 1726 | $1,895 | $1.10 | 0d | 1 | 0.79mi |
| 1344 Red Clover Ln Ranson, WV | 3.0 | 2.5 | 1723 | $2,099 | $1.22 | 14d | 1 | 0.82mi |
| 1308 Cedar Valley Rd Unit 1308 Ranson, WV | 2.0 | 4.0 | 1333 | $1,899 | $1.42 | 25d | 1 | 0.83mi |
| 405 17th Ave Ranson, WV | 3.0 | 2.5 | 1725 | $2,150 | $1.25 | 6d | 1 | 0.85mi |
| 415 17th Ave Ranson, WV | 3.0 | 2.5 | 1521 | $1,990 | $1.31 | 25d | 1 | 0.85mi |
| 603 N Fairfax Blvd Ranson, WV | 3.0 | 2.0 | 1040 | $1,850 | $1.78 | 14d | 1 | 1.13mi |
Listing history 6 events
-
2026-06-07days on market $289,990 Active 32 DOM
-
2026-06-04days on market $289,990 Active 29 DOM
-
2026-06-03days on market $289,990 Active 28 DOM
-
2026-06-02days on market $289,990 Active 27 DOM
-
2026-06-01days on market $289,990 Active 26 DOM
-
2026-05-31days on market $289,990 Active 25 DOM
ⓘ Source: listings_history table (triggers on properties + properties_extension) + one-shot
backfill from property_details.listing_events for pre-trigger history.
Climate risk First Street
- Flood 9/10 Extreme FEMA zone X (unshaded) · 99% chance over 30 yrs
- Wildfire 3/10 Moderate
- Heat 5/10 Major 7 d/yr ≥104°F today · 15 d/yr by 30 yrs out
- Wind 2/10 Low 3% chance of damaging wind over 30 yrs
- Air quality 2/10 Low 1 unhealthy d/yr today · 2 by 30 yrs out
Nearby sold comps map
Loading sold comps map…
Walkable amenities ~0.75 mi
Loading nearby amenities…
Taxation est. · year 1
- Rental income
- $24,121
- − Mortgage interest
- −$16,244
- − Property taxes
- −$4,350
- − Insurance
- −$2,247
- − Repairs & maintenance
- −$1,930
- − Management
- −$1,930
- − Depreciation
- −$8,436
- Taxable loss
- −$11,015
- Est. tax savings @ 24.0%
- +$2,644
- After-tax cash flow
- $-3,147/yr
For passive investors: Depreciation is non-cash, so a rental often shows a tax loss while cash-flowing — sheltering income. Rental losses are passive: they offset passive income freely, and up to $25,000/yr can offset ordinary (W-2) income if you actively participate and your MAGI is under $100k (phasing out to $0 by $150k); unused losses carry forward. On sale, claimed depreciation is recaptured at up to 25%, and gains may owe capital-gains tax (a 1031 exchange can defer both). Figures are a year-1 estimate at your 24.0% rate — not tax advice; consult a CPA.
Schools (NCES district)
- District
- Jefferson County Schools
- NCES district ID
- 5400570
- Math proficiency
- 29% ▼ -13.00%
- Reading proficiency
- 46% ▼ -7.00%
- Median HH income
- $67,038
- Composite
- 33.98/100
- National rank
- #5322
- State rank
- #6 of 55 in WV
Livability — Ranson
- Score
- 66/100
- State rank
- #100
- US rank
- #11255
Category grades
Schools grade is shown separately in the Schools card above.
Census & demographics
- Census place
- Ranson, WV
- County
- Jefferson County · 28,403 people
- City population
- 7,330
- Metro
- Washington-Arlington-Alexandria, DC-VA-MD-WV
- Population (ZIP)
- 7,330
- Household income
- $81,875
- Rent vs Own
- Severe rent burden
- 90.0
Population outlook (Jefferson County) Hauer SSP2
- Today (2025)
- 61,715 people
- By 2030
- 64,052 · +3.8%
- By 2040
- 67,713 · +9.7%
- By 2050
- 69,843 · +13.2%
- By 2075
- 72,679 · +17.8%
- By 2100
- 71,872 · +16.5%
Race, ethnicity, and origin ACS 2023
- Neighborhood character
- Predominantly White (72%)
- Race & ethnicity
- White 72% Hispanic / Latino 14% Two or more races 7% Black 7% Asian 3%
- Hispanic origin (detail)
- Mexican 3% Puerto Rican 4%
- Common ancestry
- Serbian 4% Italian 2% Romanian 2%
- Foreign-born
- 7% · Canada, Philippines
- Languages at home
- 87% English-only · Spanish 9% Other Asian/Pacific 3%
Political lean MEDSL · Jefferson
- 2024 margin
- R (+15.8) · D 41.0% · R 56.8% · Other 2.1%
- 2008→2024 swing
- -20.6pp toward R · 2008: 4.8pp · 2024: -15.8pp
- All cycles
- 2024: R+15.8 2020: R+10.5 2016: R+15.3 2012: R+4.0 2008: D+4.8
Not yet ingested
- Civics
- —
Market trends
- HPI YoY
- ▲ 32.87%
- Current HPI
- 352.707
- Rent YoY
- —
- Metro
- Washington-Arlington-Alexandria, DC-VA-MD-WV
- State GDP YoY
- —
- F500 in state
- 0
Cash-flow waterfall
monthlySold comps — $/sqft
last 12 mo · ≤1 miLoading sold comps…