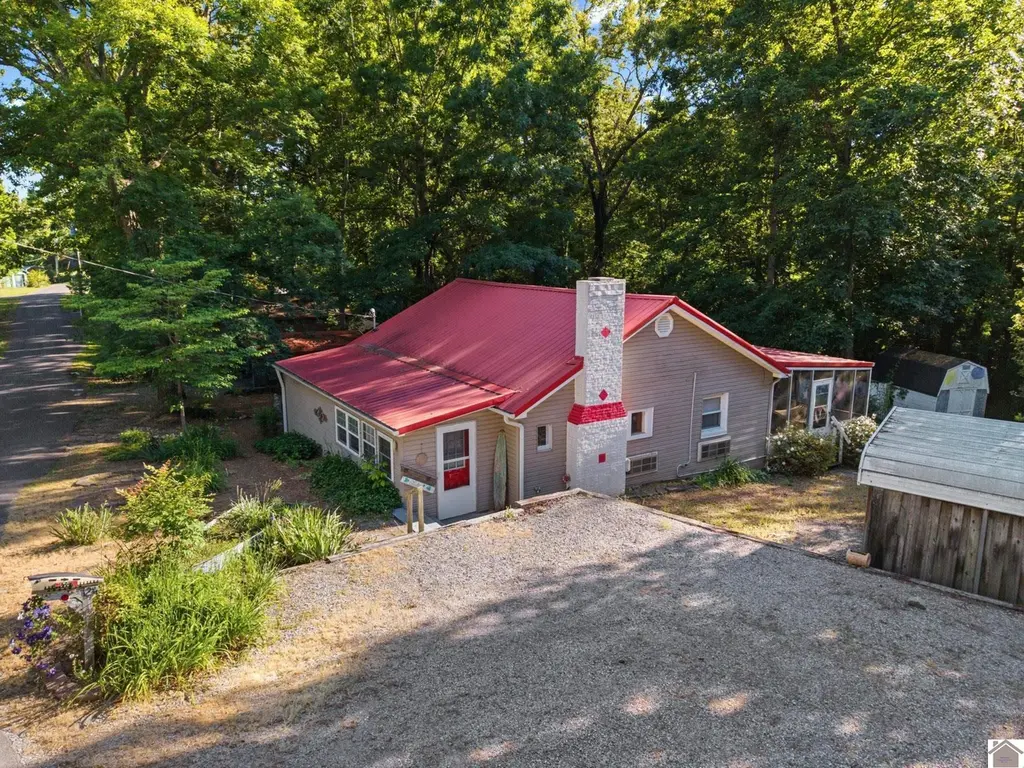
124 Sage Ln · Hardin, KY
Flood risk 1/10 · Minimal
- FEMA flood zone
- X (unshaded)
- Chance of flooding over 30 yrs
- 0.0%
- Est. flood insurance / yr
- $507 – $1,088
Fire risk 3/10 · Minor
- Est. fire insurance / yr
- $839 – $1,559
Heat risk 5/10 · Moderate
- Hot days now (above 109°F)
- 7 days/yr
- Hot days in 30 yrs
- 20 days/yr
Wind risk 4/10 · Minor
- Chance of severe wind over 30 yrs
- 8.0%
Air-quality risk 1/10 · Minimal
- Unhealthy air days now
- 0 days/yr
- Unhealthy air days in 30 yrs
- 0 days/yr
Risk factors via First Street. Map © Google.
Why this score? — see what drove the D+ grade
The composite is a weighted blend of 9 inputs, each scored 0–100. Each bar is that input's sub-score; the figure is the points it added to the 100-point composite (weight × sub-score).
- Cash flow +12.1/30.0
- Appreciation +10.0/10.0
- ARV discount +7.5/15.0
- DSCR +3.6/10.0
- Schools +2.9/10.0
- Livability +2.7/5.0
- Rent growth +2.5/5.0
- Condition / age +2.5/5.0
- 1% rule +2.4/10.0
$199,900
🖨 Deal sheet 📄 Offer letter ✓ Due diligence
Listing remarks MLS
Super cute and completely updated Lake area home! House has a beautiful view of the lake, completely updated interior all the charm of a lake area home. Interior updates include: 200 amp electric service, stained glass windows, new wood walls and ceilings, updated kitchen and bath (Redone by Re-Bath) new windows and new flooring. Exterior updates include: Metal roof, screened rear porch, enclosed front sun room, wood deck and two carport with closed sides to protect your car or boat from the weather.
Key facts
- Wooden fencing
- Enclosed back porch
- Firepit
Tags
Property features AI
Exterior
- Parking: Carport with 2 spaces
- Utilities: Public water; Septic tank
- Home design: Single-family residence; One story
- Construction: Block and vinyl siding construction; Metal roof; Slab foundation; Built as single family
- Exterior features: Covered, screened deck/patio; Fenced yard; Outbuilding; Level lot; Has view
Interior
- Kitchen: Dishwasher; Microwave; Refrigerator; Cooktop
- Flooring: Vinyl
- Bathrooms: 1 full bathroom
- Heating & cooling: Electric heating; Ceiling fan(s)
- Interior features: Eat-in kitchen; Covered, screened deck/patio
- Laundry & utility: Electric water heater
Neighborhood map
What this means for you Summary
Snapshot
- This is a 1-bed/1.0-bath other listed at $200k.
Deal economics
- At list price, monthly cash flow is $-45 ($-535/yr) — negative.
- To cash-flow at today's rent, offer at most $192k (3.9% below list).
- To meet the 1% rule (rent ≥ 1% of price), the offer needs to be $148k (25.9% below list).
- Recommended offer: $148k (25.9% below list) — sets the bar for 1% rule.
Location & tenants
- Location reads 54/100 on livability (#476 in KY) — a working-class tenant base; expect higher turnover. Strengths: cost of living A+, housing A-; Watch: amenities F, commute F, employment F.
- Marshall County (rural): math 29% / reading 38% proficiency, ranked #73 of 165 in KY (top 44%) — families likely to look elsewhere, expect single-tenant / working-renter base with shorter leases.
- Zoned schools: Jonathan Elementary School (math 17% / reading 32%, grade F, #489 of 676 statewide, top 76%, 238 students, 72% FRL); North Marshall Middle School (math 31% / reading 44%, grade F, #73 of 217 statewide, top 36%, 497 students, 45% FRL) — zoned schools average 59% FRL vs 43% district-wide (16 pts higher); higher-poverty schools than district average — tighter screening recommended.
- Market conditions: 178 active listings in the ZIP; 121 units permitted in Marshall County in 2024 (5 in 5+ unit buildings).
Forward outlook
- In year one you build about $21k of equity ($1k loan paydown + $20k appreciation (10.0% local appreciation)).
- Marshall County population projected to shrink 9% by 2050 — rents likely to lag national; underwrite the cash flow, not the appreciation.
- At projected returns (10.0% appreciation + 3.0% rent growth), your $56k cash investment doubles in ~3 years — after that, you're playing with house money.
- By year 2, paydown + projected appreciation supports a ~$34k cash-out refi (75% LTV) — recoverable capital for the next deal without selling this one.
Negotiation context
- It's been on market 35 days — a 3% lower offer ($194k) is reasonable based on typical stale-listing flexibility.
- 4 sale attempts since 7y ago with the ask held roughly flat each time — persistent listings suggest the price (not the market) is what's stuck; bring a comps-based counter.
- Current owner paid $101k; list at $200k implies a 98% gain — meaningful room to come down on a strong offer.
Risks & watch-outs
- Watch-outs: built in 1945 — expect roof / HVAC / electrical / plumbing capex.
- Climate carrying-cost: extreme-heat days projected 7→20/yr by 2055 (HVAC capex compounding) — expect insurance premiums to compound above CPI over the hold.
Questions for the listing agent
- What do current leases actually rent for vs. the listed asking? Can we see a recent rent roll and the last 12 months of T-12 income?
- It's been on market 35 days. Have you received any prior offers? Is the seller open to a 26% concession, seller financing, or rate buy-down credit?
- Built in 1945 — when were the roof, HVAC, electrical panel, plumbing, and water heater last replaced?
- Is there a deadline driving the sale (1031 exchange, divorce, estate, relocation)? That informs how much negotiation room exists.
- Schools are F-rated, which usually means shorter tenancies and higher turnover. Who's the typical renter profile here, and what's been the actual vacancy rate?
- The area grade is low — what's the realistic commute time and amenity access for the typical tenant pool here? Any planned neighborhood developments (good or bad) we should know about?
- What's the average days-on-market for RENTAL listings here right now (not sales)? A rising rental-DOM trend means longer vacancies and softer asking-rent achievability than the comps imply.
- What's the recent tenant-quality profile in this submarket — average credit score on applications, eviction rate, late-payment / NSF rate, and stable-employment percentage? A property-management company in the area should have these aggregated.
- How much new for-sale + rental construction is in the pipeline within 1–3 miles? Heavy new supply typically softens prices + rents 12–24 months out; constrained supply supports both.
Investment metrics
- 1% rule
- 0.74% ✗
- Cap rate
- 6.03%
- Cash-on-cash
- -0.96%
- DSCR
- 0.96
- GRM
- 11.2
CMA / ARV
No comps found within radius.
Projected returns pro-forma
10.0% appreciation · 3.0% rent growth · sell at horizon
- IRR
- 23.6%
- Equity multiple
- 2.89×
- Total profit
- $105,951
- Equity at exit
- $180,086
- IRR
- 21.0%
- Equity multiple
- 6.61×
- Total profit
- $314,082
- Equity at exit
- $388,362
Cash invested: $55,972 (down + closing). Projections, not guarantees.
Landlord ↔ Tenant lean methodology
- Overall (STATE)
- 83 Strongly Landlord-Friendly
- State Kentucky
- 83 Strongly Landlord-Friendly · R+16
- County
- — inherits STATE
- City
- — inherits STATE
ZIP-level market 42025
- Home prices YoY
- 7.1%
- Active inventory
- 178
- Price-to-rent
- 11.2×
Monthly cashflow live
- Estimated rent
- $1,482 medium interval (Pro) →
- Mortgage (P&I)
- −$1,048
- Tax from tax record
- −$83 /mo · $1,001/yr
- Insurance
- −$83
- HOA
- −$0
- Vacancy / Maint / Mgmt
- −$311
- Net cashflow
- $-45
Break-even live
UW: 25.0% down · 7.5% · 30yr · 1.5% tax · 5.0% vac · 8.0% maint · 8.0% mgmt
Financing live
Cash to close
- Down payment
- $49,975
- Closing costs
- $5,997
- Reserves months
- —
- Total cash needed
- —
Loan-product check · same deal, 3 products live
Conventional
25% down · 7.5% · 30yr
- Down + closing
- —
- Monthly P&I
- —
- Monthly cashflow
- —
- DSCR
- —
- Eligible?
- —
Personal DTI + credit; lowest rate.
DSCR
20% down · 8.5% · 30yr
- Down + closing
- —
- Monthly P&I
- —
- Monthly cashflow
- —
- DSCR
- —
- Eligible?
- —
No personal income docs; deal must DSCR.
Hard money
10% down · 12.0% · 12mo
- Down + closing
- —
- Monthly P&I
- —
- Monthly cashflow
- —
- DSCR
- —
- Eligible?
- —
Short-term bridge; refi at stabilization.
Listing history 22 events
-
2026-06-19days on market $199,900 Active 35 DOM
-
2026-06-18days on market $199,900 Active 34 DOM
-
2026-06-17days on market $199,900 Active 33 DOM
-
2026-06-16days on market $199,900 Active 32 DOM
-
2026-06-15days on market $199,900 Active 31 DOM
-
2026-06-14days on market $199,900 Active 29 DOM
-
2026-06-12days on market $199,900 Active 28 DOM
-
2026-06-09days on market $199,900 Active 25 DOM
-
2026-06-08days on market $199,900 Active 24 DOM
-
2026-06-07pricedays on market $199,900 Active 23 DOM
-
2026-06-03days on market $208,000 Active 19 DOM
-
2026-06-02days on market $208,000 Active 18 DOM
-
2026-06-01days on market $208,000 Active 17 DOM
-
2026-05-31days on market $208,000 Active 16 DOM
-
2026-05-30days on market $208,000 Active 15 DOM
-
2026-05-16$208,000 Active
-
2021-03-05soldstatus $101,000
-
2021-02-26soldstatus $98,000 506-char remark
Show marketing remark (506 chars)
Super cute and completely updated Lake area home! House has a beautiful view of the lake, completely updated interior all the charm of a lake area home. Interior updates include: 200 amp electric service, stained glass windows, new wood walls and ceilings, updated kitchen and bath (Redone by Re-Bath) new windows and new flooring. Exterior updates include: Metal roof, screened rear porch, enclosed front sun room, wood deck and two carport with closed sides to protect your car or boat from the weather.
-
2021-01-22$99,900 506-char remark
Show marketing remark (506 chars)
Super cute and completely updated Lake area home! House has a beautiful view of the lake, completely updated interior all the charm of a lake area home. Interior updates include: 200 amp electric service, stained glass windows, new wood walls and ceilings, updated kitchen and bath (Redone by Re-Bath) new windows and new flooring. Exterior updates include: Metal roof, screened rear porch, enclosed front sun room, wood deck and two carport with closed sides to protect your car or boat from the weather.
-
2020-02-01$94,900
-
2019-07-01$120,000
-
2010-09-24soldstatus $46,250
ⓘ Source: listings_history table (triggers on properties + properties_extension) + one-shot
backfill from property_details.listing_events for pre-trigger history.
Tax reassessment forecast KY · Resets to sale price
- Current annual tax
- $1,001 · $83/mo
- Projected year-2 tax
- $1,719 · $143/mo
- Expected delta
- +$718/yr (+$60/mo · 71.8%)
ⓘ Screening estimate from a state-policy table — verify with the county assessor before closing.
Climate risk First Street
- Flood 1/10 Low FEMA zone X (unshaded) · 0% chance over 30 yrs
- Wildfire 3/10 Moderate
- Heat 5/10 Major 7 d/yr ≥109°F today · 20 d/yr by 30 yrs out
- Wind 4/10 Moderate 8% chance of damaging wind over 30 yrs
- Air quality 1/10 Low 0 unhealthy d/yr today · 0 by 30 yrs out
Nearby sold comps map
Loading sold comps map…
Walkable amenities ~0.75 mi
Loading nearby amenities…
Taxation est. · year 1
- Rental income
- $17,778
- − Mortgage interest
- −$11,198
- − Property taxes
- −$1,001
- − Insurance
- −$1,000
- − Repairs & maintenance
- −$1,422
- − Management
- −$1,422
- − Depreciation
- −$5,815
- Taxable loss
- −$4,079
- Est. tax savings @ 24.0%
- +$979
- After-tax cash flow
- $444/yr
For passive investors: Depreciation is non-cash, so a rental often shows a tax loss while cash-flowing — sheltering income. Rental losses are passive: they offset passive income freely, and up to $25,000/yr can offset ordinary (W-2) income if you actively participate and your MAGI is under $100k (phasing out to $0 by $150k); unused losses carry forward. On sale, claimed depreciation is recaptured at up to 25%, and gains may owe capital-gains tax (a 1031 exchange can defer both). Figures are a year-1 estimate at your 24.0% rate — not tax advice; consult a CPA.
Schools (NCES district)
- District
- Marshall County
- NCES district ID
- 2103810
- Math proficiency
- 29% ▼ -7.00%
- Reading proficiency
- 38% ▼ -16.00%
- Median HH income
- $45,324
- Composite
- 28.62/100
- National rank
- #6710
- State rank
- #73 of 165 in KY
Livability — Hardin
- Score
- 54/100
- State rank
- #476
- US rank
- #23849
Category grades
Schools grade is shown separately in the Schools card above.
Census & demographics
- Population (ZIP)
- 19,238
Population outlook (Marshall County) Hauer SSP2
- Today (2025)
- 30,647 people
- By 2030
- 30,276 · -1.2%
- By 2040
- 29,232 · -4.6%
- By 2050
- 27,940 · -8.8%
- By 2075
- 25,289 · -17.5%
- By 2100
- 21,188 · -30.9%
Race, ethnicity, and origin ACS 2023
- Neighborhood character
- Predominantly White (95%)
- Race & ethnicity
- White 95% Two or more races 2% Hispanic / Latino 2%
- Common ancestry
- Iranian 2% Slovak 2% Lithuanian 2%
- Foreign-born
- 1% · Canada
- Languages at home
- 98% English-only · Spanish 1%
Political lean MEDSL · Marshall
- 2024 margin
- Solid R (+56.7) · D 21.0% · R 77.7% · Other 1.3%
- 2008→2024 swing
- -32.0pp toward R · 2008: -24.7pp · 2024: -56.7pp
- All cycles
- 2024: R+56.7 2020: R+52.4 2016: R+51.9 2012: R+34.2 2008: R+24.7
Not yet ingested
- Civics
- —
Market trends
- HPI YoY
- ▲ 19.11%
- Current HPI
- 288.75
- Rent YoY
- —
- Metro
- —
- State GDP YoY
- ▲ 1.81%
- F500 in state
- 4
Industry mix (Fortune 500 HQ in KY)
| Industry | F500 HQs | Revenue |
|---|---|---|
| Healthcare | 1 | $118B |
|
||
| Food / Beverage | 1 | $7B |
|
||
Price history
+349.7% since first listed7 events — show timeline
- 2026-05-16 Listed $208,000 WKRMLS
- 2021-03-05 Sold (Public Records) $101,000 Public Records
- 2021-02-26 Sold (MLS) $98,000 WKRMLS
- 2021-01-22 Listed $99,900 WKRMLS
- 2020-02-01 Listed $94,900 WKRMLS
- 2019-07-01 Listed $120,000 WKRMLS
- 2010-09-24 Sold (Public Records) $46,250 Public Records
Property tax history
+3.4%/yrLatest (2025): $1,001 · -1.5% YoY. Source: county tax records.
Cash-flow waterfall
monthlySold comps — $/sqft
last 12 mo · ≤1 miLoading sold comps…