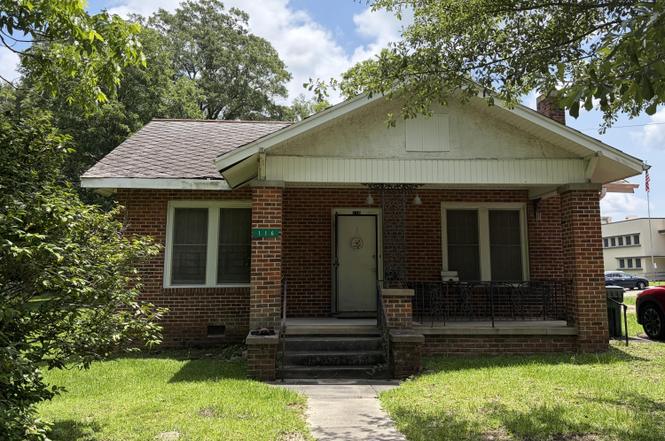
116 S 21st Ave · Hattiesburg, MS
Flood risk 1/10 · Minimal
- FEMA flood zone
- X (unshaded)
- Chance of flooding over 30 yrs
- 0.0%
- Est. flood insurance / yr
- $507 – $1,088
Fire risk 1/10 · Minimal
- Est. fire insurance / yr
- $1,241 – $2,305
Heat risk 8/10 · Major
- Hot days now (above 106°F)
- 7 days/yr
- Hot days in 30 yrs
- 20 days/yr
Wind risk 8/10 · Major
- Chance of severe wind over 30 yrs
- 99.0%
Air-quality risk 1/10 · Minimal
- Unhealthy air days now
- 0 days/yr
- Unhealthy air days in 30 yrs
- 0 days/yr
Risk factors via First Street. Map © Google.
Why this score? — see what drove the B+ grade
The composite is a weighted blend of 9 inputs, each scored 0–100. Each bar is that input's sub-score; the figure is the points it added to the 100-point composite (weight × sub-score).
- Cash flow +30.0/30.0
- ARV discount +15.0/15.0
- 1% rule +10.0/10.0
- DSCR +10.0/10.0
- Rent growth +4.1/5.0
- Livability +4.0/5.0
- Condition / age +2.5/5.0
- Schools +2.0/10.0
- Appreciation +0.0/10.0
$90,000
🖨 Deal sheet 📄 Offer letter ✓ Due diligence
Listing remarks MLS
OVER 65 TAX EXEMPTION. PRECIOUS COTTAGE ON THE AVENUES. BEAUTIFUL HARDWOOD FLOORS. AC NEW JUNE/2003
Key facts
- Spacious yard
- Two lots
- Brick cottage
Tags
Property features AI
Finance
- Other: Tax information available
Exterior
- Parking: Driveway; Paved parking; No garage
- Utilities: Public water; Public sewer
- Home design: Single-family residence; One story; Residential property; Subdivision: H'Burg Height; Zoned R
- Construction: Brick veneer construction; Raised foundation; Roof details provided in remarks
- Exterior features: Front porch; Porch; Level lot
Interior
- Flooring: Wood flooring; Carpet
- Bathrooms: 1 full bathroom
- Heating & cooling: No central heating specified; Window unit cooling
- Interior features: High ceilings
Neighborhood map
What this means for you Summary
Snapshot
- This is a 3-bed/1.0-bath single-family listed at $90k.
Deal economics
- At list price, monthly cash flow is $549 ($7k/yr) — positive.
- The deal already cash-flows at list — no discount required.
- Meets the 1% rule at list price ($2k rent vs $90k).
- Cap rate 13.6% vs local median 4.0% in Hattiesburg — top-decile yield for the area; either an underpriced asset or a hidden risk that comps aren't pricing in. Stress-test before assuming the spread holds.
Location & tenants
- Location reads 79/100 on livability (#5 in MS, #2,046 nationally) — a middle-class / working-renter tenant base. Strengths: commute A+, cost of living A+, health & safety A+; Watch: schools D+, crime D+, employment F.
- Hattiesburg Public School District (urban): math 25% / reading 26% proficiency, ranked #81 of 130 in MS (top 62%) — low school quality limits family demand, transient renter base, plan for 1-2y turnover; 88% free/reduced lunch — lower-income household profile, screen leases tightly.
- Market conditions: Rents rising fast (+6.6%/yr); 261 active listings in the ZIP; 12 comparable units currently listed for rent nearby; rentals at typical pace (median 21d on market — plan ~3-4 weeks tenant-placement turnaround); 42% of comp listings sitting > 30 days — soft ceiling on asking rent; lower-income renter base — watch delinquency; 121 units permitted in Forrest County in 2024 (30 in 5+ unit buildings).
- This rent runs 44% of the median local income ($41k/yr) — at the standard rent-burdened threshold; future hikes will face affordability resistance.
Forward outlook
- Local home prices are declining (-3.0%/yr); year-one equity from $622 of loan paydown is wiped out by about $3k of value loss. Plan a longer hold.
- Forrest County population projected at +6% by 2050 — modest demand growth; plan on rents tracking national, not racing it.
- At projected returns (-3.0% appreciation + 6.6% rent growth), your $25k cash investment doubles in ~5 years — after that, you're playing with house money.
Negotiation context
- Only 4 days on market — expect competitive offers; lowballing is unlikely to land.
- 2 sale attempts since 23y ago with the ask held roughly flat each time — persistent listings suggest the price (not the market) is what's stuck; bring a comps-based counter.
Risks & watch-outs
- Watch-outs: built in 1943 — expect roof / HVAC / electrical / plumbing capex.
- Climate carrying-cost: severe wind risk, 99% chance of damaging wind over 30y; extreme-heat days projected 7→20/yr by 2055 (HVAC capex compounding) — expect insurance premiums to compound above CPI over the hold.
Questions for the listing agent
- Built in 1943 — when were the roof, HVAC, electrical panel, plumbing, and water heater last replaced?
- Is there a deadline driving the sale (1031 exchange, divorce, estate, relocation)? That informs how much negotiation room exists.
- Schools are D-rated, which usually means shorter tenancies and higher turnover. Who's the typical renter profile here, and what's been the actual vacancy rate?
- Crime grade is D in this area — have there been break-ins, vandalism, or insurance claims at this property in the last 3 years? What carrier currently insures it and at what premium?
- What's the average days-on-market for RENTAL listings here right now (not sales)? A rising rental-DOM trend means longer vacancies and softer asking-rent achievability than the comps imply.
- What's the recent tenant-quality profile in this submarket — average credit score on applications, eviction rate, late-payment / NSF rate, and stable-employment percentage? A property-management company in the area should have these aggregated.
- How much new for-sale + rental construction is in the pipeline within 1–3 miles? Heavy new supply typically softens prices + rents 12–24 months out; constrained supply supports both.
Investment metrics
- 1% rule
- 1.67% ✓
- Cap rate
- 13.61%
- Cash-on-cash
- 26.15%
- DSCR
- 2.16
- GRM
- 5.0
CMA / ARV
- ARV (on-the-fly)
- $151,508
- Comps found
- 6
Show comp detail 6 sales within ~0.75 mi
| Address | Dist | Beds/Ba | Sqft | Sold | Price | $/sf | Match |
|---|---|---|---|---|---|---|---|
| 906 Quinn St | 0.54mi | 3/1.0 | 1,475 (-5%) | 13mo | $139,900 | $95 | 57 |
| 338 Venetian Way | 0.60mi | 4/3.0 (+1) | 1,560 (+1%) | 2mo | $149,900 | $96 | 56 |
| 219 N 23rd Ave | 0.38mi | 3/2.0 | 1,652 (+7%) | 15mo | $175,000 | $106 | 54 |
| 412 N 20th Ave | 0.59mi | 3/1.0 | 1,502 (-3%) | 23mo | $99,900 | $67 | 49 |
| 1803 Mable St | 0.61mi | 3/1.5 | 1,715 (+11%) | 6mo | $184,700 | $108 | 47 |
| 1407 Concart St | 0.66mi | 2/1.0 (-1) | 1,520 (-2%) | 18mo | $149,000 | $98 | 46 |
Match score weights: distance 35% · size 25% · config 20% · recency 20%. Top-matched comps best support the ARV.
Projected returns pro-forma
-3.0% appreciation · 6.56% rent growth · sell at horizon
- IRR
- 23.9%
- Equity multiple
- 2.03×
- Total profit
- $26,013
- Equity at exit
- $13,419
- IRR
- 34.0%
- Equity multiple
- 4.67×
- Total profit
- $92,495
- Equity at exit
- $7,782
Cash invested: $25,200 (down + closing). Projections, not guarantees.
Landlord ↔ Tenant lean methodology
- Overall (STATE)
- 90 Strongly Landlord-Friendly
- State Mississippi
- 90 Strongly Landlord-Friendly · R+11
- County
- — inherits STATE
- City
- — inherits STATE
ZIP-level market 39401
- Rents YoY
- 6.6%
- Active inventory
- 261
- Price-to-rent
- 5.0×
Monthly cashflow live
- Estimated rent
- $1,506 high interval (Pro) →
- Mortgage (P&I)
- −$472
- Tax from tax record
- −$131 /mo · $1,572/yr
- Insurance
- −$38
- HOA
- −$0
- Vacancy / Maint / Mgmt
- −$316
- Net cashflow
- $549
Break-even live
UW: 25.0% down · 7.5% · 30yr · 1.5% tax · 5.0% vac · 8.0% maint · 8.0% mgmt
Financing live
Cash to close
- Down payment
- $22,500
- Closing costs
- $2,700
- Reserves months
- —
- Total cash needed
- —
Loan-product check · same deal, 3 products live
Conventional
25% down · 7.5% · 30yr
- Down + closing
- —
- Monthly P&I
- —
- Monthly cashflow
- —
- DSCR
- —
- Eligible?
- —
Personal DTI + credit; lowest rate.
DSCR
20% down · 8.5% · 30yr
- Down + closing
- —
- Monthly P&I
- —
- Monthly cashflow
- —
- DSCR
- —
- Eligible?
- —
No personal income docs; deal must DSCR.
Hard money
10% down · 12.0% · 12mo
- Down + closing
- —
- Monthly P&I
- —
- Monthly cashflow
- —
- DSCR
- —
- Eligible?
- —
Short-term bridge; refi at stabilization.
Rent comps 12 comps
| Address | Beds | Baths | Sqft | Rent | $/sqft | DOM | Units | Dist |
|---|---|---|---|---|---|---|---|---|
| 107 Kimball Ave Hattiesburg, MS | 3.0 | 1.0 | 1500 | $1,375 | $0.92 | 21d | 1 | 0.22mi |
| 307 S 23rd Ave Hattiesburg, MS | 3.0 | 2.0 | 1300 | $1,595 | $1.23 | 43d | 1 | 0.28mi |
| 804 Pineview Dr Hattiesburg, MS | 4.0 | 2.0 | 1880 | $3,000 | $1.60 | 21d | 1 | 0.63mi |
| 416 N 19th Ave Hattiesburg, MS | 2.0 | 1.0 | 1100 | $1,250 | $1.14 | 21d | 1 | 0.63mi |
| 2304 W 7th St Hattiesburg, MS | 1.0–3.0 | 1.0–2.5 | 1175 | $1,065 | $0.91 | 21d | 1 | 0.84mi |
| 313 S 11th Ave Hattiesburg, MS | 3.0 | 2.0 | 1596 | $1,850 | $1.16 | 21d | 1 | 0.90mi |
| 720 N 28th Ave Hattiesburg, MS | 3.0 | 2.5 | 1200 | $1,307 | $1.09 | 43d | 3 | 1.14mi |
| 3414 W 7th St Hattiesburg, MS | 1.0–4.0 | 1.0–2.0 | 1075 | $1,332 | $1.24 | 43d | 1 | 1.35mi |
| 901 W Pine St Hattiesburg, MS | 1.0–2.0 | 1.0–1.5 | 930 | $1,200 | $1.29 | 21d | 1 | 1.37mi |
| 318 N 38th Ave Hattiesburg, MS | 2.0 | 2.0 | 1200 | $1,060 | $0.88 | 43d | 2 | 1.47mi |
| 300 N 38th Ave Apt 26 Hattiesburg, MS | 2.0 | 1.5 | 1070 | $1,035 | $0.97 | 21d | 1 | 1.49mi |
| 300 N 38th Ave Unit 46 Hattiesburg, MS | 2.0 | 1.5 | 1070 | $1,035 | $0.97 | 43d | 1 | 1.49mi |
Listing history 5 events
-
2026-06-15status $90,000 Pending 4 DOM
-
2026-06-15days on market $90,000 Active 4 DOM
-
2026-06-14days on market $90,000 Active 2 DOM
-
2026-06-13remarks 346-char remark
-
2026-06-13$90,000 Active 1 DOM
ⓘ Source: listings_history table (triggers on properties + properties_extension) + one-shot
backfill from property_details.listing_events for pre-trigger history.
Tax reassessment forecast MS · Resets to sale price
- Current annual tax
- $1,572 · $131/mo
- Projected year-2 tax
- $1,572 · $131/mo
- Expected delta
- $0/yr ($0/mo · 0.0%)
ⓘ Screening estimate from a state-policy table — verify with the county assessor before closing.
Climate risk First Street
- Flood 1/10 Low FEMA zone X (unshaded) · 0% chance over 30 yrs
- Wildfire 1/10 Low
- Heat 8/10 Severe 7 d/yr ≥106°F today · 20 d/yr by 30 yrs out
- Wind 8/10 Severe 99% chance of damaging wind over 30 yrs
- Air quality 1/10 Low 0 unhealthy d/yr today · 0 by 30 yrs out
Nearby sold comps map
Loading sold comps map…
Walkable amenities ~0.75 mi
Loading nearby amenities…
Taxation est. · year 1
- Rental income
- $18,070
- − Mortgage interest
- −$5,041
- − Property taxes
- −$1,572
- − Insurance
- −$450
- − Repairs & maintenance
- −$1,446
- − Management
- −$1,446
- − Depreciation
- −$2,618
- Taxable income
- $5,497
- Est. tax owed @ 24.0%
- −$1,319
- After-tax cash flow
- $5,270/yr
For passive investors: Depreciation is non-cash, so a rental often shows a tax loss while cash-flowing — sheltering income. Rental losses are passive: they offset passive income freely, and up to $25,000/yr can offset ordinary (W-2) income if you actively participate and your MAGI is under $100k (phasing out to $0 by $150k); unused losses carry forward. On sale, claimed depreciation is recaptured at up to 25%, and gains may owe capital-gains tax (a 1031 exchange can defer both). Figures are a year-1 estimate at your 24.0% rate — not tax advice; consult a CPA.
Schools (NCES district)
- District
- Hattiesburg Public School District
- NCES district ID
- 2801800
- Math proficiency
- 25% ▼ -12.00%
- Reading proficiency
- 26% ▼ -6.00%
- Median HH income
- $28,058
- Composite
- 20.38/100
- National rank
- #8595
- State rank
- #81 of 130 in MS
Livability — Hattiesburg
- Score
- 79/100
- State rank
- #5
- US rank
- #2046
Category grades
Schools grade is shown separately in the Schools card above.
Census & demographics
- Census place
- Hattiesburg, MS
- County
- Forrest County · 65,413 people
- City population
- 87,151
- Metro
- Hattiesburg, MS
- Population (ZIP)
- 42,531
- Household income
- $41,127
- Rent vs Own
- Severe rent burden
- 2534.0
Population outlook (Forrest County) Hauer SSP2
- Today (2025)
- 79,264 people
- By 2030
- 80,822 · +2.0%
- By 2040
- 82,979 · +4.7%
- By 2050
- 84,324 · +6.4%
- By 2075
- 84,942 · +7.2%
- By 2100
- 80,616 · +1.7%
Race, ethnicity, and origin ACS 2023
- Neighborhood character
- Diverse neighborhood (Simpson 0.57)
- Race & ethnicity
- Black 52% White 40% Two or more races 5% Hispanic / Latino 4%
- Common ancestry
- Slovak 2% Lithuanian 2% Serbian 1%
- Foreign-born
- 3% · Canada, China
- Languages at home
- 96% English-only · Spanish 2%
Political lean MEDSL · Forrest
- 2024 margin
- R (+17.9) · D 40.3% · R 58.2% · Other 1.4%
- 2008→2024 swing
- -4.4pp toward R · 2008: -13.5pp · 2024: -17.9pp
- All cycles
- 2024: R+17.9 2020: R+11.1 2016: R+14.2 2012: R+11.7 2008: R+13.5
Not yet ingested
- Civics
- —
Market trends
- HPI YoY
- ▼ -148.93%
- Current HPI
- 137.87
- Rent YoY
- ▲ 6.56%
- Metro
- Hattiesburg, MS
- State GDP YoY
- —
- F500 in state
- 0
Price history
+12.6% since first listed3 events — show timeline
- 2026-06-11 Listed $90,000 HAAR
- 2003-08-15 Sold (MLS) — HAAR
- 2003-05-13 Listed $79,900 HAAR
Property tax history
+3.0%/yrLatest (2025): $1,572 · +18.8% YoY. Source: county tax records.
Cash-flow waterfall
monthlySold comps — $/sqft
last 12 mo · ≤1 miLoading sold comps…