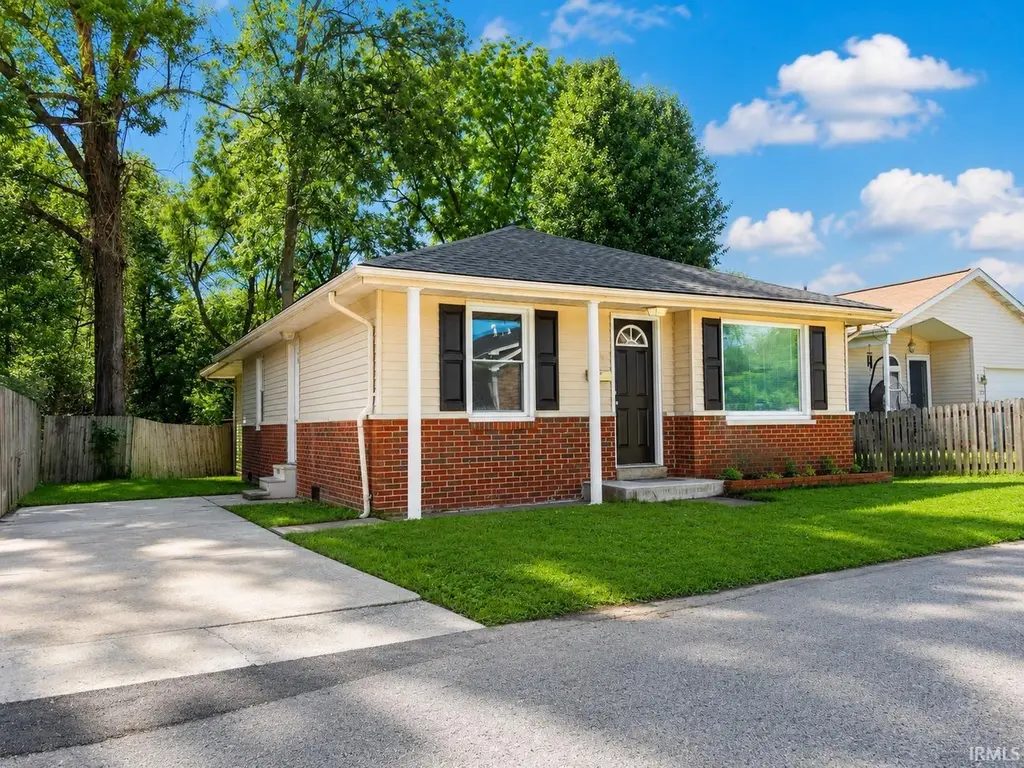
406 Polk St · Newburgh, IN
Flood risk 3/10 · Minor
- FEMA flood zone
- X (unshaded)
- Chance of flooding over 30 yrs
- 0.2%
- Est. flood insurance / yr
- $507 – $1,088
Fire risk 1/10 · Minimal
- Est. fire insurance / yr
- $717 – $1,331
Heat risk 5/10 · Moderate
- Hot days now (above 107°F)
- 7 days/yr
- Hot days in 30 yrs
- 19 days/yr
Wind risk 2/10 · Minimal
- Chance of severe wind over 30 yrs
- 3.0%
Air-quality risk 3/10 · Minor
- Unhealthy air days now
- 3 days/yr
- Unhealthy air days in 30 yrs
- 4 days/yr
Risk factors via First Street. Map © Google.
Why this score? — see what drove the B+ grade
The composite is a weighted blend of 9 inputs, each scored 0–100. Each bar is that input's sub-score; the figure is the points it added to the 100-point composite (weight × sub-score).
- Cash flow +28.9/30.0
- ARV discount +15.0/15.0
- DSCR +10.0/10.0
- 1% rule +7.9/10.0
- Schools +4.9/10.0
- Rent growth +4.7/5.0
- Livability +4.0/5.0
- Condition / age +2.5/5.0
- Appreciation +0.0/10.0
$150,000
🖨 Deal sheet 📄 Offer letter ✓ Due diligence
Listing remarks
Completely remodeled 3-bedroom, 1-bath home located in the heart of downtown Newburgh! This move-in ready home features a brand-new roof, new flooring throughout, fresh paint, new kitchen countertops, new microwave, and new dishwasher. The bathroom has been fully renovated with a new tub, vanity, and toilet, giving the home a clean and modern feel. Enjoy relaxing or entertaining on the wood deck, and take advantage of the convenient location close to restaurants, shopping, and all the charm downtown Newburgh has to offer!
Key facts
- Fresh paint
- New flooring
- New roof
Tags
Property features AI
Exterior
- Parking: Concrete parking
- Utilities: Public water; Public sewer
- Home design: Single-family residence (site-built); 1 story
- Construction: Brick and vinyl siding; Built as site-built home
- Exterior features: Deck; Partial wood fencing; Level lot
Interior
- Kitchen: Dishwasher; Microwave; Refrigerator; Electric range
- Flooring: Carpet; Laminate
- Bathrooms: 1 full bathroom (main level)
- Heating & cooling: Natural gas forced air heating; Central air conditioning; Ceiling fan cooling
- Interior features: Ceiling fans; Eat-in kitchen; Crawl space basement
- Laundry & utility: Laundry on main level
Neighborhood map
What this means for you Summary
Snapshot
- This is a 3-bed/1.0-bath single-family listed at $150k.
Deal economics
- At list price, monthly cash flow is $509 ($6k/yr) — positive.
- The deal already cash-flows at list — no discount required.
- Meets the 1% rule at list price ($2k rent vs $150k).
- Cap rate 10.4% vs local median 3.9% in Newburgh — top-decile yield for the area; either an underpriced asset or a hidden risk that comps aren't pricing in. Stress-test before assuming the spread holds.
Location & tenants
- Location reads 80/100 on livability (#21 in IN, #1,922 nationally) — a professional / high-income tenant draw. Strengths: crime A+, cost of living A+, housing A+; Watch: amenities F, commute F.
- Warrick County School Corporation (suburban): math 54% / reading 59% proficiency, ranked #24 of 301 in IN (top 8%) — acceptable for families but not a draw, mixed tenant base, ~2y average lease.
- Zoned schools: Newburgh Elementary School (math 70% / reading 63%, grade B+, #65 of 994 statewide, top 7%, 629 students, 32% FRL); Castle South Middle School (math 43% / reading 57%, grade C, #48 of 330 statewide, top 15%, 712 students, 34% FRL); Castle High School (math 56% / reading 80%, grade B, #22 of 369 statewide, top 6%, 1,961 students, 26% FRL).
- Market conditions: Rents rising fast (+8.7%/yr); 383 active listings in the ZIP; 9 comparable units currently listed for rent nearby; rentals at typical pace (median 21d on market — plan ~3-4 weeks tenant-placement turnaround); solid renter incomes; 249 units permitted in Warrick County in 2024 (0 in 5+ unit buildings).
Forward outlook
- Local home prices are declining (-3.0%/yr); year-one equity from $1k of loan paydown is wiped out by about $4k of value loss. Plan a longer hold.
- Warrick County population projected at +9% by 2050 — modest demand growth; plan on rents tracking national, not racing it.
- At projected returns (-3.0% appreciation + 8.0% rent growth), your $42k cash investment doubles in ~6 years — after that, you're playing with house money.
Negotiation context
- Only 1 days on market — expect competitive offers; lowballing is unlikely to land.
Risks & watch-outs
- Watch-outs: built in 1956 — expect roof / HVAC / electrical / plumbing capex.
- Climate carrying-cost: extreme-heat days projected 7→19/yr by 2055 (HVAC capex compounding) — expect insurance premiums to compound above CPI over the hold.
Questions for the listing agent
- Built in 1956 — when were the roof, HVAC, electrical panel, plumbing, and water heater last replaced?
- Is there a deadline driving the sale (1031 exchange, divorce, estate, relocation)? That informs how much negotiation room exists.
- Schools are A-rated — typically a magnet for longer-tenancy family renters. What's the average tenant stay here, and is there a school-zone premium baked into asking?
- What's the average days-on-market for RENTAL listings here right now (not sales)? A rising rental-DOM trend means longer vacancies and softer asking-rent achievability than the comps imply.
- What's the recent tenant-quality profile in this submarket — average credit score on applications, eviction rate, late-payment / NSF rate, and stable-employment percentage? A property-management company in the area should have these aggregated.
- How much new for-sale + rental construction is in the pipeline within 1–3 miles? Heavy new supply typically softens prices + rents 12–24 months out; constrained supply supports both.
Investment metrics
- 1% rule
- 1.29% ✓
- Cap rate
- 10.37%
- Cash-on-cash
- 14.55%
- DSCR
- 1.65
- GRM
- 6.5
CMA / ARV
- ARV (on-the-fly)
- $212,257
- Comps found
- 12
Show comp detail 12 sales within ~0.75 mi
| Address | Dist | Beds/Ba | Sqft | Sold | Price | $/sf | Match |
|---|---|---|---|---|---|---|---|
| 626 Monroe St | 0.21mi | 3/2.0 | 1,292 (+2%) | 0mo | $159,000 | $123 | 84 |
| 211 Posey St | 0.09mi | 3/2.0 | 1,265 (-0%) | 10mo | $235,000 | $186 | 83 |
| 126 Posey St | 0.09mi | 3/2.0 | 1,285 (+1%) | 19mo | $77,500 | $60 | 74 |
| 413 W Main St | 0.19mi | 2/1.5 (-1) | 1,350 (+6%) | 2mo | $225,000 | $167 | 72 |
| 324 Locust St | 0.30mi | 3/1.0 | 1,363 (+7%) | 8mo | $224,900 | $165 | 67 |
| 110 E Gray St | 0.26mi | 3/2.0 | 1,440 (+13%) | 0mo | $269,000 | $187 | 62 |
| 610 State St | 0.21mi | 3/2.0 | 1,404 (+10%) | 18mo | $275,000 | $196 | 54 |
| 301 Yorkshire Dr | 0.45mi | 3/2.0 | 1,193 (-6%) | 14mo | $225,000 | $189 | 53 |
| 514 Middle St | 0.20mi | 3/2.0 | 1,457 (+15%) | 15mo | $135,000 | $93 | 50 |
| 612 Prince Dr | 0.47mi | 3/1.5 | 1,153 (-9%) | 14mo | $214,500 | $186 | 49 |
| 419 Section St | 0.42mi | 2/1.0 (-1) | 1,080 (-15%) | 20mo | $140,000 | $130 | 34 |
| 5666 Maple Ln | 0.67mi | 2/1.0 (-1) | 1,081 (-15%) | 22mo | $145,000 | $134 | 21 |
Match score weights: distance 35% · size 25% · config 20% · recency 20%. Top-matched comps best support the ARV.
Projected returns pro-forma
-3.0% appreciation · 8.0% rent growth · sell at horizon
- IRR
- 10.5%
- Equity multiple
- 1.44×
- Total profit
- $18,390
- Equity at exit
- $22,365
- IRR
- 23.3%
- Equity multiple
- 3.49×
- Total profit
- $104,468
- Equity at exit
- $12,969
Cash invested: $42,000 (down + closing). Projections, not guarantees.
Landlord ↔ Tenant lean methodology
- Overall (STATE)
- 90 Strongly Landlord-Friendly
- State Indiana
- 90 Strongly Landlord-Friendly · R+11
- County
- — inherits STATE
- City
- — inherits STATE
ZIP-level market 47630
- Rents YoY
- 8.7%
- Active inventory
- 383
- Price-to-rent
- 6.5×
Monthly cashflow live
- Estimated rent
- $1,938 high interval (Pro) →
- Mortgage (P&I)
- −$787
- Tax from tax record
- −$172 /mo · $2,067/yr
- Insurance
- −$62
- HOA
- −$0
- Vacancy / Maint / Mgmt
- −$407
- Net cashflow
- $509
Break-even live
UW: 25.0% down · 7.5% · 30yr · 1.5% tax · 5.0% vac · 8.0% maint · 8.0% mgmt
Financing live
Cash to close
- Down payment
- $37,500
- Closing costs
- $4,500
- Reserves months
- —
- Total cash needed
- —
Loan-product check · same deal, 3 products live
Conventional
25% down · 7.5% · 30yr
- Down + closing
- —
- Monthly P&I
- —
- Monthly cashflow
- —
- DSCR
- —
- Eligible?
- —
Personal DTI + credit; lowest rate.
DSCR
20% down · 8.5% · 30yr
- Down + closing
- —
- Monthly P&I
- —
- Monthly cashflow
- —
- DSCR
- —
- Eligible?
- —
No personal income docs; deal must DSCR.
Hard money
10% down · 12.0% · 12mo
- Down + closing
- —
- Monthly P&I
- —
- Monthly cashflow
- —
- DSCR
- —
- Eligible?
- —
Short-term bridge; refi at stabilization.
Rent comps 9 comps
| Address | Beds | Baths | Sqft | Rent | $/sqft | DOM | Units | Dist |
|---|---|---|---|---|---|---|---|---|
| 402 W Jennings St Newburgh, IN | 3.0 | 1.5 | 1508 | $2,575 | $1.71 | 44d | 1 | 0.20mi |
| 5700 Kenwood Cir Newburgh, IN | 1.0–2.0 | 1.0 | 858 | $910 | $1.06 | 13d | 2 | 0.77mi |
| 5200 E Timberwood Dr Newburgh, IN | 4.0 | 3.0 | 1643 | $2,200 | $1.34 | 13d | 1 | 1.25mi |
| 9895 Cove Point Ct Newburgh, IN | 3.0 | 2.0 | 1307 | $1,950 | $1.49 | 21d | 1 | 1.27mi |
| 5879 Riverwalk Cir Newburgh, IN | 3.0 | 2.0 | 1128 | $1,600 | $1.42 | 21d | 1 | 1.32mi |
| 8001 Alexandra Ln Newburgh, IN | 3.0 | 1.5 | 1528 | $1,395 | $0.91 | 21d | 1 | 1.36mi |
| 7300 Brentwood Dr Newburgh, IN | 2.0 | 1.0 | 890 | $865 | $0.97 | 13d | 1 | 1.47mi |
| 8584 Lincoln Ave Newburgh, IN | 3.0 | 2.0 | 1330 | $1,549 | $1.16 | 44d | 1 | 1.49mi |
| 8582 Lincoln Ave Newburgh, IN | 2.0 | 2.0 | 1068 | $1,344 | $1.26 | 44d | 1 | 1.49mi |
Listing history 2 events
-
2026-05-28status Pending
-
2026-05-27$150,000 Active
ⓘ Source: listings_history table (triggers on properties + properties_extension) + one-shot
backfill from property_details.listing_events for pre-trigger history.
Tax reassessment forecast IN · Partial reset (capped growth)
- Current annual tax
- $2,067 · $172/mo
- Projected year-2 tax
- $2,067 · $172/mo
- Expected delta
- $0/yr ($0/mo · 0.0%)
ⓘ Screening estimate from a state-policy table — verify with the county assessor before closing.
Climate risk First Street
- Flood 3/10 Moderate FEMA zone X (unshaded) · 20% chance over 30 yrs
- Wildfire 1/10 Low
- Heat 5/10 Major 7 d/yr ≥107°F today · 19 d/yr by 30 yrs out
- Wind 2/10 Low 3% chance of damaging wind over 30 yrs
- Air quality 3/10 Moderate 3 unhealthy d/yr today · 4 by 30 yrs out
Nearby sold comps map
Loading sold comps map…
Walkable amenities ~0.75 mi
Loading nearby amenities…
Taxation est. · year 1
- Rental income
- $23,251
- − Mortgage interest
- −$8,402
- − Property taxes
- −$2,067
- − Insurance
- −$750
- − Repairs & maintenance
- −$1,860
- − Management
- −$1,860
- − Depreciation
- −$4,364
- Taxable income
- $3,947
- Est. tax owed @ 24.0%
- −$947
- After-tax cash flow
- $5,164/yr
For passive investors: Depreciation is non-cash, so a rental often shows a tax loss while cash-flowing — sheltering income. Rental losses are passive: they offset passive income freely, and up to $25,000/yr can offset ordinary (W-2) income if you actively participate and your MAGI is under $100k (phasing out to $0 by $150k); unused losses carry forward. On sale, claimed depreciation is recaptured at up to 25%, and gains may owe capital-gains tax (a 1031 exchange can defer both). Figures are a year-1 estimate at your 24.0% rate — not tax advice; consult a CPA.
Schools (NCES district)
- District
- Warrick County School Corporation
- NCES district ID
- 1812390
- Math proficiency
- 54% ▼ -8.00%
- Reading proficiency
- 59% ▼ -6.00%
- Median HH income
- $62,801
- Composite
- 49.38/100
- National rank
- #2014
- State rank
- #24 of 301 in IN
Livability — Newburgh
- Score
- 80/100
- State rank
- #21
- US rank
- #1922
Category grades
Schools grade is shown separately in the Schools card above.
Census & demographics
- Census place
- Newburgh, IN
- County
- Warrick County · 39,818 people
- City population
- 39,818
- Metro
- Evansville, IN-KY
- Population (ZIP)
- 39,818
- Household income
- $94,162
- Rent vs Own
- Severe rent burden
- 770.0
Population outlook (Warrick County) Hauer SSP2
- Today (2025)
- 66,569 people
- By 2030
- 68,404 · +2.8%
- By 2040
- 71,131 · +6.9%
- By 2050
- 72,743 · +9.3%
- By 2075
- 76,088 · +14.3%
- By 2100
- 72,261 · +8.6%
Race, ethnicity, and origin ACS 2023
- Neighborhood character
- Predominantly White (88%)
- Race & ethnicity
- White 88% Two or more races 5% Black 3% Hispanic / Latino 3% Asian 3%
- Common ancestry
- Italian 3% Lithuanian 2% Romanian 2%
- Foreign-born
- 5% · Canada, China
- Languages at home
- 96% English-only · Spanish 2% Other Indo-European 1%
Political lean MEDSL · Warrick
- 2024 margin
- Solid R (+30.2) · D 34.1% · R 64.3% · Other 1.5%
- 2008→2024 swing
- -17.4pp toward R · 2008: -12.8pp · 2024: -30.2pp
- All cycles
- 2024: R+30.2 2020: R+27.8 2016: R+33.9 2012: R+26.6 2008: R+12.8
Not yet ingested
- Civics
- —
Market trends
- HPI YoY
- ▼ -187.44%
- Current HPI
- 185.7643
- Rent YoY
- ▲ 8.69%
- Metro
- Evansville, IN-KY
- State GDP YoY
- ▲ 2.90%
- F500 in state
- 18
Industry mix (Fortune 500 HQ in IN)
| Industry | F500 HQs | Revenue |
|---|---|---|
| Industrial Machinery | 2 | $37B |
|
||
| Healthcare | 1 | $177B |
|
||
| Pharmaceuticals | 1 | $45B |
|
||
| Metals / Steel | 1 | $18B |
|
||
| Agriculture | 1 | $17B |
|
||
| Packaging | 1 | $12B |
|
||
Price history
2 events — show timeline
- 2026-05-28 Pending — IRMLS
- 2026-05-27 Listed $150,000 IRMLS
Property tax history
+6.1%/yrLatest (2024): $2,067 · +4.7% YoY. Source: county tax records.
Cash-flow waterfall
monthlySold comps — $/sqft
last 12 mo · ≤1 miLoading sold comps…