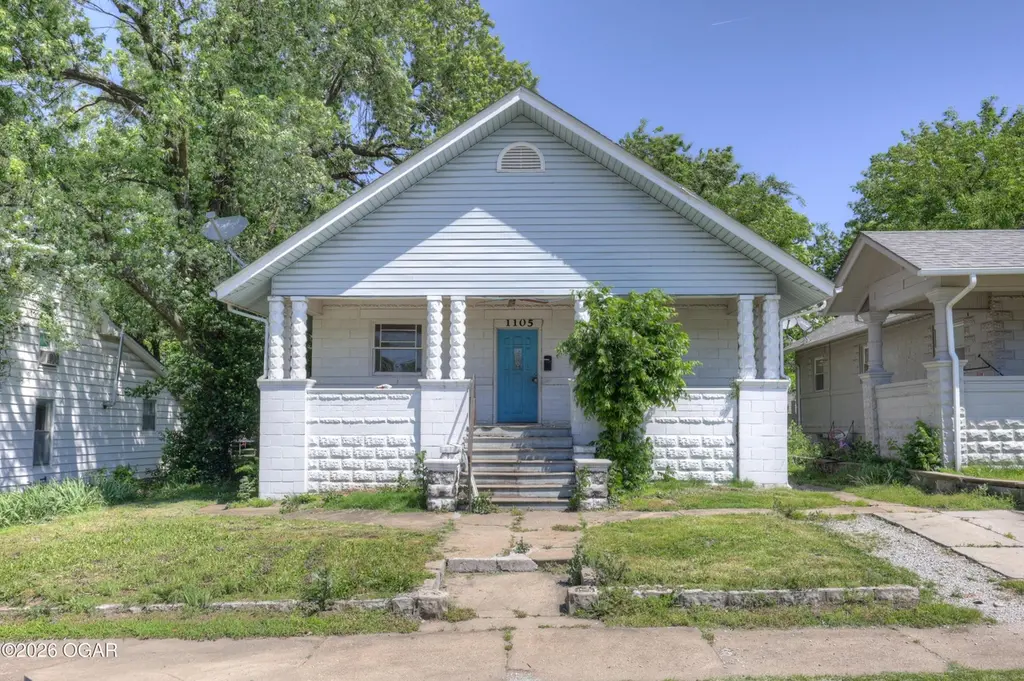
1105 W Broadway St · Webb City, MO
Flood risk 1/10 · Minimal
- FEMA flood zone
- X (unshaded)
- Chance of flooding over 30 yrs
- 0.0%
- Est. flood insurance / yr
- $473 – $860
Fire risk 4/10 · Minor
- Est. fire insurance / yr
- $1,054 – $1,958
Heat risk 5/10 · Moderate
- Hot days now (above 106°F)
- 7 days/yr
- Hot days in 30 yrs
- 20 days/yr
Wind risk 2/10 · Minimal
- Chance of severe wind over 30 yrs
- 2.0%
Air-quality risk 2/10 · Minimal
- Unhealthy air days now
- 1 days/yr
- Unhealthy air days in 30 yrs
- 1 days/yr
Risk factors via First Street. Map © Google.
Why this score? — see what drove the B+ grade
The composite is a weighted blend of 9 inputs, each scored 0–100. Each bar is that input's sub-score; the figure is the points it added to the 100-point composite (weight × sub-score).
- Cash flow +30.0/30.0
- ARV discount +15.0/15.0
- 1% rule +10.0/10.0
- DSCR +10.0/10.0
- Schools +4.8/10.0
- Livability +3.9/5.0
- Rent growth +3.1/5.0
- Condition / age +2.5/5.0
- Appreciation +0.0/10.0
$105,000
🖨 Deal sheet 📄 Offer letter ✓ Due diligence
Listing remarks MLS
Conveniently located off Madison and close to HWY 171. This home has a full basement that is great for entertaining or you could add a couple of bedrooms. Half bath in basement is not enclosed.
Key facts
- 5,662 sq ft lot
- Built 1905
- Listed 33 days
Property features AI
Exterior
- Parking: Driveway
- Utilities: Public sewer
- Home design: Single-family residence, freestanding; Residential property
- Construction: Vinyl siding; Block construction; Block foundation; Composition roof; Built with finished area above and below grade
- Exterior features: Covered patio/porch; Deck; Porch
Interior
- Kitchen: Dishwasher
- Flooring: Carpet; Vinyl; Wood
- Bathrooms: 1 full bathroom; 1 half bathroom
- Heating & cooling: Central heating (natural gas); Has cooling
- Interior features: Finished basement; 7 total rooms
Neighborhood map
What this means for you Summary
Snapshot
- This is a 4-bed/1.5-bath other listed at $105k.
Deal economics
- At list price, monthly cash flow is $602 ($7k/yr) — positive.
- The deal already cash-flows at list — no discount required.
- Meets the 1% rule at list price ($2k rent vs $105k).
- Recommended offer: $102k (3.0% below list) — sets the bar for market timing.
Location & tenants
- Location reads 77/100 on livability (#35 in MO, #3,062 nationally) — a middle-class / working-renter tenant base. Strengths: cost of living A+, housing A+, health & safety A+; Watch: employment C-, amenities D-, commute F.
- Webb City R-VII (suburban): math 53% / reading 60% proficiency, ranked #21 of 324 in MO (top 6%) — acceptable for families but not a draw, mixed tenant base, ~2y average lease.
- Zoned schools: Webb City Middle (math 53% / reading 55%, grade B-, #46 of 391 statewide, top 12%, 696 students, 47% FRL).
- Market conditions: Rents rising (+2.5%/yr); 122 active listings in the ZIP; 9 comparable units currently listed for rent nearby; rentals lingering (median 44d on market — plan ~5-8 weeks vacancy on turnover, expect pricing pressure); 67% of comp listings sitting > 30 days — soft ceiling on asking rent; 602 units permitted in Jasper County in 2024 (0 in 5+ unit buildings).
Forward outlook
- Local home prices are declining (-3.0%/yr); year-one equity from $726 of loan paydown is wiped out by about $3k of value loss. Plan a longer hold.
- At projected returns (-3.0% appreciation + 2.5% rent growth), your $29k cash investment doubles in ~6 years — after that, you're playing with house money.
Negotiation context
- It's been on market 33 days — a 3% lower offer ($102k) is reasonable based on typical stale-listing flexibility.
- 2 sale attempts since 7y ago with the ask held roughly flat each time — persistent listings suggest the price (not the market) is what's stuck; bring a comps-based counter.
Risks & watch-outs
- Watch-outs: built in 1905 — expect roof / HVAC / electrical / plumbing capex.
- Climate carrying-cost: extreme-heat days projected 7→20/yr by 2055 (HVAC capex compounding) — expect insurance premiums to compound above CPI over the hold.
Questions for the listing agent
- It's been on market 33 days. Have you received any prior offers? Is the seller open to a 3% concession, seller financing, or rate buy-down credit?
- Built in 1905 — when were the roof, HVAC, electrical panel, plumbing, and water heater last replaced?
- Is there a deadline driving the sale (1031 exchange, divorce, estate, relocation)? That informs how much negotiation room exists.
- Schools are B-rated — typically a magnet for longer-tenancy family renters. What's the average tenant stay here, and is there a school-zone premium baked into asking?
- What's the average days-on-market for RENTAL listings here right now (not sales)? A rising rental-DOM trend means longer vacancies and softer asking-rent achievability than the comps imply.
- What's the recent tenant-quality profile in this submarket — average credit score on applications, eviction rate, late-payment / NSF rate, and stable-employment percentage? A property-management company in the area should have these aggregated.
- How much new for-sale + rental construction is in the pipeline within 1–3 miles? Heavy new supply typically softens prices + rents 12–24 months out; constrained supply supports both.
Investment metrics
- 1% rule
- 1.50% ✓
- Cap rate
- 13.18%
- Cash-on-cash
- 24.59%
- DSCR
- 2.09
- GRM
- 5.5
CMA / ARV
- ARV (median comp)
- $204,194
- List price
- $105,000
- Delta
- -48.58%
- Verdict
- UNDERPRICED
- Comps
- 9 within 1.0 mi
Projected returns pro-forma
-3.0% appreciation · 2.49% rent growth · sell at horizon
- IRR
- 17.4%
- Equity multiple
- 1.70×
- Total profit
- $20,522
- Equity at exit
- $15,656
- IRR
- 25.5%
- Equity multiple
- 3.17×
- Total profit
- $63,897
- Equity at exit
- $9,078
Cash invested: $29,400 (down + closing). Projections, not guarantees.
Landlord ↔ Tenant lean methodology
- Overall (STATE)
- 81 Strongly Landlord-Friendly
- State Missouri
- 81 Strongly Landlord-Friendly · R+10
- County
- — inherits STATE
- City
- — inherits STATE
ZIP-level market 64870
- Home prices YoY
- -8.3%
- Rents YoY
- 2.5%
- Active inventory
- 122
- Price-to-rent
- 5.5×
Monthly cashflow live
- Estimated rent
- $1,579 high interval (Pro) →
- Mortgage (P&I)
- −$551
- Tax from tax record
- −$51 /mo · $610/yr
- Insurance
- −$44
- HOA
- −$0
- Vacancy / Maint / Mgmt
- −$332
- Net cashflow
- $602
Break-even live
UW: 25.0% down · 7.5% · 30yr · 1.5% tax · 5.0% vac · 8.0% maint · 8.0% mgmt
Financing live
Cash to close
- Down payment
- $26,250
- Closing costs
- $3,150
- Reserves months
- —
- Total cash needed
- —
Loan-product check · same deal, 3 products live
Conventional
25% down · 7.5% · 30yr
- Down + closing
- —
- Monthly P&I
- —
- Monthly cashflow
- —
- DSCR
- —
- Eligible?
- —
Personal DTI + credit; lowest rate.
DSCR
20% down · 8.5% · 30yr
- Down + closing
- —
- Monthly P&I
- —
- Monthly cashflow
- —
- DSCR
- —
- Eligible?
- —
No personal income docs; deal must DSCR.
Hard money
10% down · 12.0% · 12mo
- Down + closing
- —
- Monthly P&I
- —
- Monthly cashflow
- —
- DSCR
- —
- Eligible?
- —
Short-term bridge; refi at stabilization.
Rent comps 9 comps
| Address | Beds | Baths | Sqft | Rent | $/sqft | DOM | Units | Dist |
|---|---|---|---|---|---|---|---|---|
| 1405 W Aylor St Webb City, MO | 4.0 | 2.0 | 1460 | $1,450 | $0.99 | 43d | 1 | 0.43mi |
| 214 S Tom St Webb City, MO | 3.0 | 2.0 | 1556 | $1,400 | $0.90 | 21d | 1 | 0.79mi |
| 618 N Hall St Unit A Webb City, MO | 3.0 | 2.0 | 1250 | $1,400 | $1.12 | 21d | 1 | 0.87mi |
| 1407 S Jefferson Ave Webb City, MO | 3.0 | 2.0 | 1424 | $1,650 | $1.16 | 43d | 1 | 1.00mi |
| 1411 S Jefferson Ave Webb City, MO | 3.0 | 2.0 | 1424 | $1,650 | $1.16 | 43d | 1 | 1.00mi |
| 1301 S Jefferson St Webb City, MO | 3.0 | 2.0 | 1424 | $1,650 | $1.16 | 43d | 1 | 1.01mi |
| 612 Easton Unit B Webb City, MO | 3.0 | 2.0 | 1560 | $1,300 | $0.83 | 21d | 1 | 1.04mi |
| 1524 Brewster Ln Webb City, MO | 3.0 | 2.0 | 1310 | $1,450 | $1.11 | 43d | 1 | 1.34mi |
| 1613 S Oronogo St Webb City, MO | 3.0 | 2.0 | 1310 | $1,400 | $1.07 | 43d | 1 | 1.37mi |
Listing history 16 events
-
2026-06-13status $105,000 Pending 33 DOM
-
2026-06-10days on market $105,000 Active 33 DOM
-
2026-06-09days on market $105,000 Active 32 DOM
-
2026-06-08days on market $105,000 Active 31 DOM
-
2026-06-07days on market $105,000 Active 30 DOM
-
2026-06-05days on market $105,000 Active 27 DOM
-
2026-06-02days on market $105,000 Active 25 DOM
-
2026-06-01days on market $105,000 Active 24 DOM
-
2026-05-31days on market $105,000 Active 23 DOM
-
2026-05-30days on market $105,000 Active 22 DOM
-
2026-05-07$105,000 Active 364-char remark
-
2020-03-31soldstatus
-
2020-03-27soldstatus 193-char remark
Show marketing remark (193 chars)
Conveniently located off Madison and close to HWY 171. This home has a full basement that is great for entertaining or you could add a couple of bedrooms. Half bath in basement is not enclosed.
-
2019-07-24$69,000 193-char remark
Show marketing remark (193 chars)
Conveniently located off Madison and close to HWY 171. This home has a full basement that is great for entertaining or you could add a couple of bedrooms. Half bath in basement is not enclosed.
-
2008-09-03soldstatus
-
2003-12-02soldstatus
ⓘ Source: listings_history table (triggers on properties + properties_extension) + one-shot
backfill from property_details.listing_events for pre-trigger history.
Tax reassessment forecast MO · Resets to sale price
- Current annual tax
- $610 · $51/mo
- Projected year-2 tax
- $1,018 · $85/mo
- Expected delta
- +$408/yr (+$34/mo · 66.8%)
ⓘ Screening estimate from a state-policy table — verify with the county assessor before closing.
Climate risk First Street
- Flood 1/10 Low FEMA zone X (unshaded) · 0% chance over 30 yrs
- Wildfire 4/10 Moderate
- Heat 5/10 Major 7 d/yr ≥106°F today · 20 d/yr by 30 yrs out
- Wind 2/10 Low 2% chance of damaging wind over 30 yrs
- Air quality 2/10 Low 1 unhealthy d/yr today · 1 by 30 yrs out
Nearby sold comps map
Loading sold comps map…
Walkable amenities ~0.75 mi
Loading nearby amenities…
Taxation est. · year 1
- Rental income
- $18,952
- − Mortgage interest
- −$5,882
- − Property taxes
- −$610
- − Insurance
- −$525
- − Repairs & maintenance
- −$1,516
- − Management
- −$1,516
- − Depreciation
- −$3,055
- Taxable income
- $5,848
- Est. tax owed @ 24.0%
- −$1,404
- After-tax cash flow
- $5,826/yr
For passive investors: Depreciation is non-cash, so a rental often shows a tax loss while cash-flowing — sheltering income. Rental losses are passive: they offset passive income freely, and up to $25,000/yr can offset ordinary (W-2) income if you actively participate and your MAGI is under $100k (phasing out to $0 by $150k); unused losses carry forward. On sale, claimed depreciation is recaptured at up to 25%, and gains may owe capital-gains tax (a 1031 exchange can defer both). Figures are a year-1 estimate at your 24.0% rate — not tax advice; consult a CPA.
Schools (NCES district)
- District
- Webb City R-VII
- NCES district ID
- 2931500
- Math proficiency
- 53% ▼ -1.00%
- Reading proficiency
- 60% ▼ -1.00%
- Median HH income
- $45,022
- Composite
- 47.68/100
- National rank
- #2244
- State rank
- #21 of 324 in MO
Livability — Webb City
- Score
- 77/100
- State rank
- #35
- US rank
- #3062
Category grades
Schools grade is shown separately in the Schools card above.
Census & demographics
- Census place
- Webb City, MO
- County
- Jasper County · 79,035 people
- City population
- 16,186
- Metro
- Joplin, MO
- Population (ZIP)
- 16,186
- Household income
- $68,300
- Rent vs Own
- Severe rent burden
- 427.0
Population outlook (Jasper County) Hauer SSP2
- Today (2025)
- 120,033 people
- By 2030
- 120,091 · +0.0%
- By 2040
- 119,297 · -0.6%
- By 2050
- 117,705 · -1.9%
- By 2075
- 110,402 · -8.0%
- By 2100
- 99,719 · -16.9%
Race, ethnicity, and origin ACS 2023
- Neighborhood character
- Predominantly White (86%)
- Race & ethnicity
- White 86% Two or more races 8% Hispanic / Latino 4% Asian 2% Black 2%
- Common ancestry
- Lithuanian 2% Slovak 2% Italian 2%
- Foreign-born
- 2% · Canada, China
- Languages at home
- 98% English-only · Spanish 1%
Political lean MEDSL · Jasper
- 2024 margin
- Solid R (+46.8) · D 25.9% · R 72.7% · Other 1.4%
- 2008→2024 swing
- -13.6pp toward R · 2008: -33.2pp · 2024: -46.8pp
- All cycles
- 2024: R+46.8 2020: R+46.2 2016: R+50.8 2012: R+41.0 2008: R+33.2
Not yet ingested
- Civics
- —
Market trends
- HPI YoY
- ▼ -24.29%
- Current HPI
- 267.5318
- Rent YoY
- ▲ 2.49%
- Metro
- Joplin, MO
- State GDP YoY
- ▲ 1.84%
- F500 in state
- 20
Industry mix (Fortune 500 HQ in MO)
| Industry | F500 HQs | Revenue |
|---|---|---|
| Healthcare | 1 | $163B |
|
||
| Insurance | 1 | $21B |
|
||
| Industrial Technology | 1 | $17B |
|
||
| Retail | 1 | $16B |
|
||
| Industrial Distribution | 1 | $10B |
|
||
| Utilities | 1 | $9B |
|
||
Price history
+52.2% since first listed7 events — show timeline
- 2026-06-10 Pending — OGAR
- 2026-05-07 Listed $105,000 OGAR
- 2020-03-31 Sold (Public Records) — Public Records
- 2020-03-27 Sold (MLS) — OGAR
- 2019-07-24 Listed $69,000 OGAR
- 2008-09-03 Sold (Public Records) — Public Records
- 2003-12-02 Sold (Public Records) — Public Records
Property tax history
+2.1%/yrLatest (2025): $610 · +12.3% YoY. Source: county tax records.
Cash-flow waterfall
monthlySold comps — $/sqft
last 12 mo · ≤1 miLoading sold comps…