 🏗️ New Construction
6702 Pebble Bluff Ct · Cove, TX
Flood risk 1/10 · Minimal
- FEMA flood zone
- X (unshaded)
- Chance of flooding over 30 yrs
- 0.0%
- Est. flood insurance / yr
- $507 – $1,088
Fire risk 4/10 · Minor
- Est. fire insurance / yr
- $1,222 – $2,270
Heat risk 9/10 · Severe
- Hot days now (above 111°F)
- 7 days/yr
- Hot days in 30 yrs
- 24 days/yr
Wind risk 9/10 · Severe
- Chance of severe wind over 30 yrs
- 99.0%
Air-quality risk 2/10 · Minimal
- Unhealthy air days now
- 1 days/yr
- Unhealthy air days in 30 yrs
- 1 days/yr
Risk factors via First Street. Map © Google.
Why this score? — see what drove the D- grade
The composite is a weighted blend of 9 inputs, each scored 0–100. Each bar is that input's sub-score; the figure is the points it added to the 100-point composite (weight × sub-score).
- ARV discount +7.5/15.0
- Cash flow +7.4/30.0
- Schools +6.2/10.0
- Condition / age +4.0/5.0
- Rent growth +3.4/5.0
- Livability +3.2/5.0
- 1% rule +2.4/10.0
- DSCR +1.5/10.0
- Appreciation +0.0/10.0
$294,990
🖨 Deal sheet 📄 Offer letter ✓ Due diligence
Listing remarks
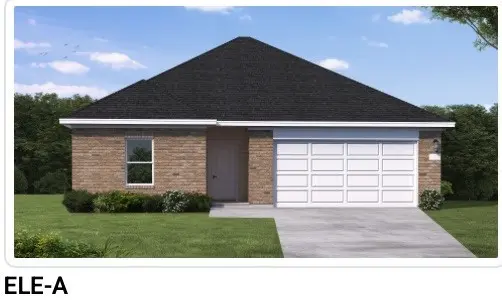
Welcome home to this thoughtfully designed 1,501 sq. ft. Coventry Homes residence featuring 3 bedrooms and 2 full bathrooms with an open-concept layout connecting the kitchen, dining, and living areas. The primary suite offers a private bath and walk-in closet, while two secondary bedrooms provide flexibility for guests or a home office. Brick on four sides adds durability and curb appeal. Located on a Corner Lot in the Windcress community, residents enjoy resort-style amenities including a pool, pickleball courts, putting green, playgrounds, and an amenity center. Zoned to the highly regarded Barbers Hill ISD.
Key facts
- Pickleball courts
- Private bath
- Walk-in closet
Tags
Property features AI
Finance
- Other: Association fee: annually
- HOA & community: Association: Pulte Management; Association amenities include pool, playground, and pickleball; Annual association fee
Exterior
- Parking: Attached garage; 2 garage spaces; Attached parking
- Security: Prewired for security; Security system owned; Smoke detectors
- Utilities: Public water; Public sewer; Concrete road access
- Home design: Residential property; New construction (under construction); Faces northwest; Slab foundation; Composition roof
- Construction: Brick construction; Built in 2026
- Exterior features: Deck; Porch; Patio; Private yard; Subdivision lot
Interior
- Kitchen: Dishwasher; Electric oven; Gas cooktop; Garbage disposal; Microwave; ENERGY STAR qualified appliances
- Bedrooms: 3 total rooms
- Flooring: Carpet; Plank flooring; Tile; Vinyl
- Bathrooms: 2 full bathrooms
- Heating & cooling: Central heating (gas); Central air conditioning (electric); Has heating; Has cooling
- Interior features: Breakfast bar; Granite counters; High ceilings; Kitchen island; Kitchen and family room combo; Separate shower; Tub with shower; Walk-in pantry; Ceiling fans; Programmable thermostat; Low emissivity windows; Ventilation for improved indoor air quality
- Laundry & utility: Washer hookup; Electric dryer hookup; Gas dryer hookup
Neighborhood map
What this means for you Summary
Snapshot
- This is a 3-bed/2.0-bath single-family listed at $295k. Condition is rated good.
Deal economics
- At list price, monthly cash flow is $-391 ($-5k/yr) — negative.
- To cash-flow at today's rent, offer at most $248k (16.0% below list).
- To meet the 1% rule (rent ≥ 1% of price), the offer needs to be $226k (23.3% below list).
- Recommended offer: $226k (23.3% below list) — sets the bar for 1% rule.
Location & tenants
- Location reads 64/100 on livability (#766 in TX) — a middle-class / working-renter tenant base. Strengths: employment A+, housing A+, crime A; Watch: amenities F, commute F, health & safety F.
- Barbers Hill ISD (rural): math 72% / reading 65% proficiency, ranked #12 of 826 in TX (top 2%) — acceptable for families but not a draw, mixed tenant base, ~2y average lease.
- Zoned schools: Barbers Hill El South (math 68% / reading 62%, grade B+, #246 of 4,322 statewide, top 6%, 883 students, 37% FRL); Barbers Hill Middle South (math 77% / reading 63%, grade A, #58 of 1,662 statewide, top 4%, 636 students, 0% FRL); Barbers Hill H S (math 70% / reading 74%, grade B+, #95 of 1,632 statewide, top 7%, 1,972 students, 0% FRL) — zoned schools average 12% FRL vs 28% district-wide (16 pts lower); this property's tenant base skews higher-income than the district average.
- Market conditions: Rents rising (+3.4%/yr); 776 active listings in the ZIP; 6 comparable units currently listed for rent nearby; rentals at typical pace (median 20d on market — plan ~3-4 weeks tenant-placement turnaround); high-income renter base; 629 units permitted in Chambers County in 2024 (0 in 5+ unit buildings).
Forward outlook
- Local home prices are declining (-3.0%/yr); year-one equity from $2k of loan paydown is wiped out by about $9k of value loss. Plan a longer hold.
- Chambers County population projected at +46% by 2050 — long-run rental-demand tailwind backs the buy-and-hold thesis.
Negotiation context
- It's been on market 25 days — a 2% lower offer ($291k) is reasonable based on typical stale-listing flexibility.
- 2 sale attempts with the ask held roughly flat each time — persistent listings suggest the price (not the market) is what's stuck; bring a comps-based counter.
Risks & watch-outs
- Climate carrying-cost: severe wind risk, 99% chance of damaging wind over 30y; extreme-heat days projected 7→24/yr by 2055 (HVAC capex compounding) — expect insurance premiums to compound above CPI over the hold.
Questions for the listing agent
- What do current leases actually rent for vs. the listed asking? Can we see a recent rent roll and the last 12 months of T-12 income?
- What does the HOA fee cover, when was the last increase, and are there any pending special assessments or reserve-fund shortfalls?
- Is there a deadline driving the sale (1031 exchange, divorce, estate, relocation)? That informs how much negotiation room exists.
- Schools are D-rated, which usually means shorter tenancies and higher turnover. Who's the typical renter profile here, and what's been the actual vacancy rate?
- The area grade is low — what's the realistic commute time and amenity access for the typical tenant pool here? Any planned neighborhood developments (good or bad) we should know about?
- What's the average days-on-market for RENTAL listings here right now (not sales)? A rising rental-DOM trend means longer vacancies and softer asking-rent achievability than the comps imply.
- What's the recent tenant-quality profile in this submarket — average credit score on applications, eviction rate, late-payment / NSF rate, and stable-employment percentage? A property-management company in the area should have these aggregated.
- How much new for-sale + rental construction is in the pipeline within 1–3 miles? Heavy new supply typically softens prices + rents 12–24 months out; constrained supply supports both.
Investment metrics
- 1% rule
- 0.74% ✗
- Cap rate
- 4.75%
- Cash-on-cash
- -5.51%
- DSCR
- 0.75
- GRM
- 11.2
CMA / ARV
- ARV (median comp)
- $304,215
- List price
- $294,990
- Delta
- -3.03%
- Verdict
- FAIR
- Comps
- 20 within 1.0 mi
Show comp detail 12 sales within ~0.75 mi
| Address | Dist | Beds/Ba | Sqft | Sold | Price | $/sf | Match |
|---|---|---|---|---|---|---|---|
| 535 Louis Ln | 0.29mi | 3/2.0 | 1,512 (+1%) | 8mo | $260,950 | $173 | 79 |
| 6810 Bens Lndg | 0.46mi | 3/2.0 | 1,512 (+1%) | 2mo | $259,140 | $171 | 75 |
| 303 Ruby Ford Dr | 0.46mi | 3/2.0 | 1,496 (-0%) | 5mo | $279,990 | $187 | 74 |
| 411 Ruby Ford Dr | 0.33mi | 3/2.0 | 1,408 (-6%) | 1mo | $254,970 | $181 | 74 |
| 6707 Alejandro Pl | 0.42mi | 3/2.0 | 1,592 (+6%) | 1mo | $299,100 | $188 | 70 |
| 507 Louis Ln | 0.36mi | 3/2.0 | 1,408 (-6%) | 8mo | $269,990 | $192 | 66 |
| 6830 Bens Lndg | 0.58mi | 3/2.0 | 1,580 (+5%) | 1mo | $274,870 | $174 | 63 |
| 6743 Camila St | 0.30mi | 4/2.0 (+1) | 1,682 (+12%) | 2mo | $284,000 | $169 | 59 |
| 419 Ruby Ford Dr | 0.33mi | 4/2.0 (+1) | 1,682 (+12%) | 4mo | $289,950 | $172 | 56 |
| 6818 Bens Lndg | 0.57mi | 4/2.5 (+1) | 1,642 (+9%) | 1mo | $269,800 | $164 | 50 |
| 6922 Bens Lndg | 0.62mi | 4/2.5 (+1) | 1,642 (+9%) | 1mo | $269,180 | $164 | 48 |
| 8415 Rio Spring Dr | 0.63mi | 3/2.0 | 1,688 (+12%) | 6mo | $309,640 | $183 | 44 |
Match score weights: distance 35% · size 25% · config 20% · recency 20%. Top-matched comps best support the ARV.
Projected returns pro-forma
-3.0% appreciation · 3.42% rent growth · sell at horizon
- IRR
- -25.2%
- Equity multiple
- 0.14×
- Total profit
- $-73,154
- Equity at exit
- $45,359
- IRR
- -19.9%
- Equity multiple
- -0.07×
- Total profit
- $-91,465
- Equity at exit
- $26,303
Cash invested: $85,180 (down + closing). Projections, not guarantees.
Landlord ↔ Tenant lean methodology
- Overall (STATE)
- 87 Strongly Landlord-Friendly
- State Texas
- 87 Strongly Landlord-Friendly · R+5
- County
- — inherits STATE
- City
- — inherits STATE
ZIP-level market 77523
- Home prices YoY
- -31.5%
- Rents YoY
- 3.4%
- Active inventory
- 776
- Price-to-rent
- 10.9×
Monthly cashflow live
- Estimated rent
- $2,261 high interval (Pro) →
- Mortgage (P&I)
- −$1,595
- Tax est. 1.5%
- −$380 /mo · $4,563/yr
- Insurance
- −$127
- HOA
- −$75
- Vacancy / Maint / Mgmt
- −$475
- Net cashflow
- $-391
Break-even live
UW: 25.0% down · 7.5% · 30yr · 1.5% tax · 5.0% vac · 8.0% maint · 8.0% mgmt
Financing live
Cash to close
- Down payment
- $76,054
- Closing costs
- $9,126
- Reserves months
- —
- Total cash needed
- —
Loan-product check · same deal, 3 products live
Conventional
25% down · 7.5% · 30yr
- Down + closing
- —
- Monthly P&I
- —
- Monthly cashflow
- —
- DSCR
- —
- Eligible?
- —
Personal DTI + credit; lowest rate.
DSCR
20% down · 8.5% · 30yr
- Down + closing
- —
- Monthly P&I
- —
- Monthly cashflow
- —
- DSCR
- —
- Eligible?
- —
No personal income docs; deal must DSCR.
Hard money
10% down · 12.0% · 12mo
- Down + closing
- —
- Monthly P&I
- —
- Monthly cashflow
- —
- DSCR
- —
- Eligible?
- —
Short-term bridge; refi at stabilization.
Rent comps 6 comps
| Address | Beds | Baths | Sqft | Rent | $/sqft | DOM | Units | Dist |
|---|---|---|---|---|---|---|---|---|
| 14930 Spring Forest Ln Baytown, TX | 4.0 | 2.0 | 1829 | $2,750 | $1.50 | 43d | 1 | 0.85mi |
| 14739 Sweet Water Dr Baytown, TX | 4.0 | 2.0 | 1821 | $2,395 | $1.32 | 1d | 1 | 0.92mi |
| 5815 Littoral Rd Baytown, TX | 3.0 | 2.0 | 1305 | $1,845 | $1.41 | 19d | 1 | 1.25mi |
| 8414 Liberty Sky Rd Baytown, TX | 3.0 | 2.5 | 2046 | $2,095 | $1.02 | 24d | 1 | 1.36mi |
| 21 Cotton Bayou Cir Cove, TX | 3.0 | 2.0 | 1216 | $1,195 | $0.98 | 3d | 1 | 1.36mi |
| 21 Cotton Bayou Cir Cove, TX | 3.0 | 2.0 | 1216 | $1,195 | $0.98 | 15d | 1 | 1.36mi |
HOA detail
- Monthly dues
- $75 · $900/yr
- Likely covers
- landscapingpool
Listing history 10 events
-
2026-05-14price $299,990 603-char remark
-
2026-05-13price $299,990 729-char remark
-
2026-05-02price $304,990 729-char remark
-
2026-05-01$304,990 Active 603-char remark
-
2026-05-01historical
-
2026-04-30price $304,990
-
2026-03-18price $309,990
-
2026-02-26price $309,990 729-char remark
-
2026-02-26$318,590 Active 729-char remark
-
2026-02-23$318,590 Active
ⓘ Source: listings_history table (triggers on properties + properties_extension) + one-shot
backfill from property_details.listing_events for pre-trigger history.
Climate risk First Street
- Flood 1/10 Low FEMA zone X (unshaded) · 0% chance over 30 yrs
- Wildfire 4/10 Moderate
- Heat 9/10 Extreme 7 d/yr ≥111°F today · 24 d/yr by 30 yrs out
- Wind 9/10 Extreme 99% chance of damaging wind over 30 yrs
- Air quality 2/10 Low 1 unhealthy d/yr today · 1 by 30 yrs out
Nearby sold comps map
Loading sold comps map…
Walkable amenities ~0.75 mi
Loading nearby amenities…
Taxation est. · year 1
- Rental income
- $27,136
- − Mortgage interest
- −$17,041
- − Property taxes
- −$4,563
- − Insurance
- −$1,521
- − Repairs & maintenance
- −$2,171
- − Management
- −$2,171
- − HOA
- −$900
- − Depreciation
- −$8,850
- Taxable loss
- −$10,081
- Est. tax savings @ 24.0%
- +$2,419
- After-tax cash flow
- $-2,272/yr
For passive investors: Depreciation is non-cash, so a rental often shows a tax loss while cash-flowing — sheltering income. Rental losses are passive: they offset passive income freely, and up to $25,000/yr can offset ordinary (W-2) income if you actively participate and your MAGI is under $100k (phasing out to $0 by $150k); unused losses carry forward. On sale, claimed depreciation is recaptured at up to 25%, and gains may owe capital-gains tax (a 1031 exchange can defer both). Figures are a year-1 estimate at your 24.0% rate — not tax advice; consult a CPA.
Condition & rehab AI · 1 photo
This home is in excellent condition with no visible repairs needed. It offers a good return on investment with updates that can significantly increase its resale and rental value.
Value-add opportunities
- Both Painting exterior and interior — Enhances curb appeal and interior aesthetics
- Both Landscaping improvements — Enhances curb appeal and adds value
- Both New flooring in bathrooms and kitchen — Improves functionality and aesthetics
- Both New paint in interior — Enhances interior aesthetics and value
Renovation cost estimate screening
Value-add ROI direction
- Both Painting exterior and interior — Enhances curb appeal and interior aesthetics ↑
- Both Landscaping improvements — Enhances curb appeal and adds value ↑
- Both New flooring in bathrooms and kitchen — Improves functionality and aesthetics ↑
- Both New paint in interior — Enhances interior aesthetics and value ↑
ⓘ Cost ranges are severity-bucket heuristics (US national rule-of-thumb). Get contractor quotes + a written scope before underwriting a rehab budget.
Schools (NCES district)
- District
- Barbers Hill ISD
- NCES district ID
- 4809450
- Math proficiency
- 72% ▼ -5.00%
- Reading proficiency
- 65% ▼ -1.00%
- Median HH income
- $87,257
- Composite
- 61.73/100
- National rank
- #737
- State rank
- #12 of 826 in TX
Livability — Cove
- Score
- 64/100
- State rank
- #766
- US rank
- #13996
Category grades
Schools grade is shown separately in the Schools card above.
Census & demographics
- County
- Chambers County · 30,186 people
- Metro
- Houston-The Woodlands-Sugar Land, TX
- Population (ZIP)
- 30,186
- Household income
- $124,188
- Rent vs Own
- Severe rent burden
- 549.0
Population outlook (Chambers County) Hauer SSP2
- Today (2025)
- 46,946 people
- By 2030
- 51,094 · +8.8%
- By 2040
- 59,578 · +26.9%
- By 2050
- 68,318 · +45.5%
- By 2075
- 90,485 · +92.7%
- By 2100
- 104,885 · +123.4%
Race, ethnicity, and origin ACS 2023
- Neighborhood character
- Majority White (62%)
- Race & ethnicity
- White 62% Hispanic / Latino 25% Two or more races 11% Black 8% Asian 2%
- Hispanic origin (detail)
- Mexican 22%
- Common ancestry
- Lithuanian 1% Slovak 1% Serbian 1%
- Foreign-born
- 9% · Canada
- Languages at home
- 82% English-only · Spanish 17%
Political lean MEDSL · Chambers
- 2024 margin
- Solid R (+65.6) · D 16.8% · R 82.4%
- 2008→2024 swing
- -14.4pp toward R · 2008: -51.2pp · 2024: -65.6pp
- All cycles
- 2024: R+65.6 2020: R+61.7 2016: R+62.1 2012: R+61.1 2008: R+51.2
Not yet ingested
- Civics
- —
Market trends
- HPI YoY
- ▼ -102.33%
- Current HPI
- 222.6999
- Rent YoY
- ▲ 3.42%
- Metro
- Houston-The Woodlands-Sugar Land, TX
- State GDP YoY
- ▲ 3.95%
- F500 in state
- 110
Industry mix (Fortune 500 HQ in TX)
| Industry | F500 HQs | Revenue |
|---|---|---|
| Energy | 16 | $1,198B |
|
||
| Technology | 5 | $198B |
|
||
| Engineering / Construction | 4 | $72B |
|
||
| Energy Services | 3 | $60B |
|
||
| Utilities | 3 | $41B |
|
||
| Healthcare | 2 | $330B |
|
||
Price history
-7.4% since first listed8 events — show timeline
- 2026-05-26 Pending — HARMLS
- 2026-05-20 Price Changed $294,990 HARMLS
- 2026-05-14 Price Changed $299,990 HARMLS
- 2026-05-01 Listing Removed — HARMLS
- 2026-05-01 Listed $304,990 HARMLS
- 2026-04-30 Price Changed $304,990 HARMLS
- 2026-03-18 Price Changed $309,990 HARMLS
- 2026-02-23 Listed $318,590 HARMLS
Cash-flow waterfall
monthlySold comps — $/sqft
last 12 mo · ≤1 miLoading sold comps…