 Triplex
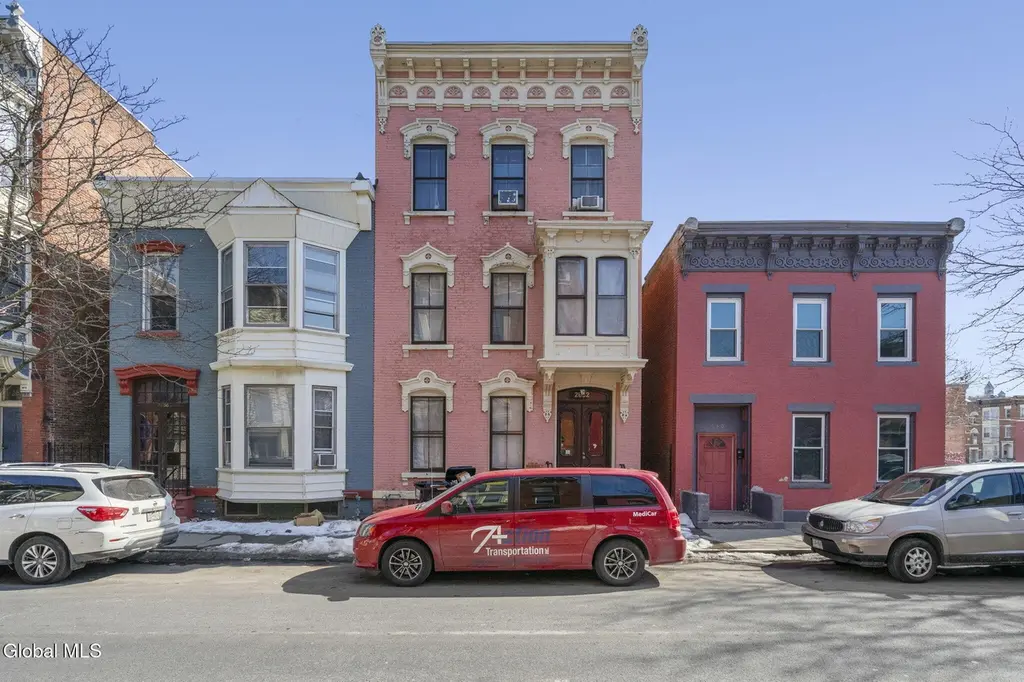
2632 5th Ave · Troy, NY
Flood risk 1/10 · Minimal
- FEMA flood zone
- X
- Chance of flooding over 30 yrs
- 0.0%
- Est. flood insurance / yr
- $473 – $860
Fire risk 3/10 · Minor
- Est. fire insurance / yr
- $691 – $1,283
Heat risk 4/10 · Minor
- Hot days now (above 98°F)
- 7 days/yr
- Hot days in 30 yrs
- 17 days/yr
Wind risk 3/10 · Minor
- Chance of severe wind over 30 yrs
- 6.0%
Air-quality risk 2/10 · Minimal
- Unhealthy air days now
- 0 days/yr
- Unhealthy air days in 30 yrs
- 1 days/yr
Risk factors via First Street. Map © Google.
Why this score? — see what drove the B- grade
The composite is a weighted blend of 9 inputs, each scored 0–100. Each bar is that input's sub-score; the figure is the points it added to the 100-point composite (weight × sub-score).
- Cash flow +30.0/30.0
- 1% rule +10.0/10.0
- DSCR +10.0/10.0
- Livability +4.0/5.0
- Schools +3.8/10.0
- Rent growth +3.7/5.0
- ARV discount +2.9/15.0
- Condition / age +2.5/5.0
- Appreciation +0.0/10.0
$329,000
🖨 Deal sheet (PDF) 📄 Offer letter ✓ Due diligence
Multi-family units
County records classify this as Multi-Family (2-4 Unit). Listing-text estimate: 3 units. confirmed
Listing remarks MLS
Turn Key Investment Property, Newly Remodeled Brick 3 Family. Great Rental Income. New Heating Systems in each unit. Second floor unit is Vacant & Ready to show. Excellent Condition
Key facts
- 3,484 sq ft lot
- 2 parking spots
- Built 1890
Tags
Neighborhood map
What this means for you Summary
Snapshot
- This is a 3 × 3-bed/1.0-bath units multifamily listed at $329k.
Deal economics
- At list price, monthly cash flow is $2k ($20k/yr) — positive. Per door: $549/mo.
- The deal already cash-flows at list — no discount required.
- Meets the 1% rule at list price ($5k rent vs $329k).
- Recommended offer: $319k (3.0% below list) — sets the bar for market timing.
- Cap rate 12.3% vs local median 5.3% in Troy — top-decile yield for the area; either an underpriced asset or a hidden risk that comps aren't pricing in. Stress-test before assuming the spread holds.
Location & tenants
- Location reads 81/100 on livability (#88 in NY, #1,350 nationally) — a professional / high-income tenant draw. Strengths: amenities A+, commute A+, housing A+; Watch: schools C-, employment C-, crime F.
- Troy City School District (urban): math 44% / reading 46% proficiency, ranked #467 of 590 in NY (top 79%) — families likely to look elsewhere, expect single-tenant / working-renter base with shorter leases; 62% free/reduced lunch — lower-income household profile, screen leases tightly.
- Market conditions: Rents rising fast (+4.9%/yr); 220 active listings in the ZIP; 1 comparable units currently listed for rent nearby; solid renter incomes; 405 units permitted in Rensselaer County in 2024 (224 in 5+ unit buildings).
- At $4,964/mo this rent would consume 79% of the median local household income ($76k/yr) (locally 2698% of renters already pay >50% of income on rent) — very limited rent-growth headroom before tenants either downsize or default.
Forward outlook
- Local home prices are declining (-3.0%/yr); year-one equity from $2k of loan paydown is wiped out by about $10k of value loss. Plan a longer hold.
- Rensselaer County population projected to shrink 6% by 2050 — rents likely to lag national; underwrite the cash flow, not the appreciation.
- At projected returns (-3.0% appreciation + 4.9% rent growth), your $92k cash investment doubles in ~6 years — after that, you're playing with house money.
Negotiation context
- It's been on market 37 days — a 3% lower offer ($319k) is reasonable based on typical stale-listing flexibility.
- 4 sale attempts since 26y ago; this cycle's ask has dropped $18k (5%) from the opening price — seller is motivated, your offer sets the floor, not the list.
- Current owner paid $180k; list at $329k implies a 83% gain — meaningful room to come down on a strong offer.
Risks & watch-outs
- Watch-outs: built in 1890 — expect roof / HVAC / electrical / plumbing capex.
Questions for the listing agent
- It's been on market 37 days. Have you received any prior offers? Is the seller open to a 3% concession, seller financing, or rate buy-down credit?
- Can we see the unit-by-unit rent roll, current vacancy, and any below-market leases? What's the average tenancy length?
- What capital expenditures (roof, boiler, parking lot, exteriors) have been made in the last 5 years, and what's planned in the next 2?
- Built in 1890 — when were the roof, HVAC, electrical panel, plumbing, and water heater last replaced?
- Is there a deadline driving the sale (1031 exchange, divorce, estate, relocation)? That informs how much negotiation room exists.
- Crime grade is F in this area — have there been break-ins, vandalism, or insurance claims at this property in the last 3 years? What carrier currently insures it and at what premium?
- What's the average days-on-market for RENTAL listings here right now (not sales)? A rising rental-DOM trend means longer vacancies and softer asking-rent achievability than the comps imply.
- What's the recent tenant-quality profile in this submarket — average credit score on applications, eviction rate, late-payment / NSF rate, and stable-employment percentage? A property-management company in the area should have these aggregated.
- How much new apartment / multifamily construction is in the pipeline within 1–3 miles? Heavy new supply (>2% of stock underway) typically softens rents 12–24 months out; light construction supports rent growth.
Investment metrics
- 1% rule
- 1.51% ✓
- Cap rate
- 12.30%
- Cash-on-cash
- 21.47%
- DSCR
- 1.96
- GRM
- 5.5
CMA / ARV
- ARV (on-the-fly)
- $298,647
- Comps found
- 5
Show comp detail 5 sales within ~0.75 mi
| Address | Dist | Beds/Ba | Sqft | Sold | Price | $/sf | Match |
|---|---|---|---|---|---|---|---|
| 280 9th St | 0.21mi | 10/3.0 (+1) | 3,687 (0%) | 18mo | $175,000 | $47 | 71 |
| 2265 Old 6th Ave | 0.37mi | 10/3.0 (+1) | 3,696 (+0%) | 10mo | $300,000 | $81 | 70 |
| 32 Douw St | 0.45mi | 8/3.0 (-1) | 3,380 (-8%) | 5mo | $275,000 | $81 | 55 |
| 2377 Burdett Ave | 0.75mi | 10/3.0 (+1) | 3,316 (-10%) | 11mo | $350,000 | $106 | 34 |
| 2338 15th St | 0.54mi | 8/4.0 (-1) | 3,200 (-13%) | 13mo | $375,000 | $117 | 33 |
Match score weights: distance 35% · size 25% · config 20% · recency 20%. Top-matched comps best support the ARV.
Projected returns pro-forma
-3.0% appreciation · 4.88% rent growth · sell at horizon
- IRR
- 16.2%
- Equity multiple
- 1.67×
- Total profit
- $61,285
- Equity at exit
- $49,055
- IRR
- 26.1%
- Equity multiple
- 3.49×
- Total profit
- $229,608
- Equity at exit
- $28,446
Cash invested: $92,120 (down + closing). Projections, not guarantees.
Landlord ↔ Tenant lean methodology
- Overall (STATE)
- 15 Strongly Tenant-Friendly
- State New York
- 15 Strongly Tenant-Friendly · D+10
- County
- — inherits STATE
- City
- — inherits STATE
ZIP-level market 12180
- Home prices YoY
- -33.3%
- Rents YoY
- 4.9%
- Active inventory
- 220
- Price-to-rent
- 16.6×
Monthly cashflow live
- Estimated rent
- $4,964 high interval (Pro) →
- Mortgage (P&I)
- −$1,725
- Tax est. 1.5%
- −$411 /mo · $4,935/yr
- Insurance
- −$137
- HOA
- −$0
- Vacancy / Maint / Mgmt
- −$1,042
- Net cashflow
- $1,648
Break-even live
Sensitivity live
| Price | -10% $1,875 | -5% $1,762 | +0% $1,648 | +5% $1,534 | +10% $1,421 |
|---|---|---|---|---|---|
| Rent | -10% $1,256 | -5% $1,452 | +0% $1,648 | +5% $1,844 | +10% $2,040 |
| Rate | -1.0pp $1,814 | -0.5pp $1,732 | base $1,648 | +0.5pp $1,563 | +1.0pp $1,476 |
3-unit breakdown (identical units grouped — click to expand)
| Units | Beds | Baths | Est. rent |
|---|---|---|---|
| 3× units | 3 | 1 | $4,965 |
| #1 | 3 | 1 | $1,655 |
| #2 | 3 | 1 | $1,655 |
| #3 | 3 | 1 | $1,655 |
| Total (3 units) | $4,964 | ||
UW: 25.0% down · 7.5% · 30yr · 1.5% tax · 5.0% vac · 8.0% maint · 8.0% mgmt
Financing live
Cash to close
- Down payment
- $82,250
- Closing costs
- $9,870
- Reserves months
- —
- Total cash needed
- —
Loan-product check · same deal, 3 products live
Conventional
25% down · 7.5% · 30yr
- Down + closing
- —
- Monthly P&I
- —
- Monthly cashflow
- —
- DSCR
- —
- Eligible?
- —
Personal DTI + credit; lowest rate.
DSCR
20% down · 8.5% · 30yr
- Down + closing
- —
- Monthly P&I
- —
- Monthly cashflow
- —
- DSCR
- —
- Eligible?
- —
No personal income docs; deal must DSCR.
Hard money
10% down · 12.0% · 12mo
- Down + closing
- —
- Monthly P&I
- —
- Monthly cashflow
- —
- DSCR
- —
- Eligible?
- —
Short-term bridge; refi at stabilization.
Rent comps 1 comps
| Address | Beds | Baths | Sqft | Rent | $/sqft | DOM | Units | Dist |
|---|---|---|---|---|---|---|---|---|
| 2326 15th St Unit 2 Troy, NY | 8.0 | 2.5 | 2500 | $650 | $0.26 | 15d | 1 | 0.55mi |
Listing history 15 events
-
2026-04-23status Pending
-
2026-03-23price $329,000
-
2026-03-17$347,000 Active
-
2022-03-10soldstatus $180,000
-
2014-07-10soldstatus $115,000
-
2014-06-30soldstatus $115,000 185-char remark
Show marketing remark (185 chars)
Turn Key Investment Property, Newly Remodeled Brick 3 Family. Great Rental Income. New Heating Systems in each unit. Second floor unit is Vacant & Ready to show. Excellent Condition
-
2014-02-11historical 185-char remark
Show marketing remark (185 chars)
Turn Key Investment Property, Newly Remodeled Brick 3 Family. Great Rental Income. New Heating Systems in each unit. Second floor unit is Vacant & Ready to show. Excellent Condition
-
2013-11-29$129,000 185-char remark
Show marketing remark (185 chars)
Turn Key Investment Property, Newly Remodeled Brick 3 Family. Great Rental Income. New Heating Systems in each unit. Second floor unit is Vacant & Ready to show. Excellent Condition
-
2008-01-15soldstatus $55,000 28-char remark
Show marketing remark (28 chars)
GREAT AREA -- Fair Condition
-
2007-12-10historical 28-char remark
Show marketing remark (28 chars)
GREAT AREA -- Fair Condition
-
2007-10-09$59,000 28-char remark
Show marketing remark (28 chars)
GREAT AREA -- Fair Condition
-
2002-01-16soldstatus $88,000
-
2001-01-30soldstatus $1,000
-
2000-03-27$33,900
-
1995-02-28soldstatus $70,000
ⓘ Source: listings_history table (triggers on properties + properties_extension) + one-shot
backfill from property_details.listing_events for pre-trigger history.
Climate risk First Street
- Flood 1/10 Low FEMA zone X · 0% chance over 30 yrs
- Wildfire 3/10 Moderate
- Heat 4/10 Moderate 7 d/yr ≥98°F today · 17 d/yr by 30 yrs out
- Wind 3/10 Moderate 6% chance of damaging wind over 30 yrs
- Air quality 2/10 Low 0 unhealthy d/yr today · 1 by 30 yrs out
Nearby sold comps map
Loading sold comps map…
Walkable amenities ~0.75 mi
Loading nearby amenities…
Taxation est. · year 1
- Rental income
- $59,568
- − Mortgage interest
- −$18,429
- − Property taxes
- −$4,935
- − Insurance
- −$1,645
- − Repairs & maintenance
- −$4,765
- − Management
- −$4,765
- − Depreciation
- −$9,571
- Taxable income
- $15,457
- Est. tax owed @ 24.0%
- −$3,710
- After-tax cash flow
- $16,065/yr
For passive investors: Depreciation is non-cash, so a rental often shows a tax loss while cash-flowing — sheltering income. Rental losses are passive: they offset passive income freely, and up to $25,000/yr can offset ordinary (W-2) income if you actively participate and your MAGI is under $100k (phasing out to $0 by $150k); unused losses carry forward. On sale, claimed depreciation is recaptured at up to 25%, and gains may owe capital-gains tax (a 1031 exchange can defer both). Figures are a year-1 estimate at your 24.0% rate — not tax advice; consult a CPA.
Schools (NCES district)
- District
- Troy City School District
- NCES district ID
- 3628950
- Math proficiency
- 44% ▲ 6.00%
- Reading proficiency
- 46% ▲ 6.00%
- Median HH income
- $42,143
- Composite
- 37.89/100
- National rank
- #4318
- State rank
- #467 of 590 in NY
Livability — Troy
- Score
- 81/100
- State rank
- #88
- US rank
- #1350
Category grades
Schools grade is shown separately in the Schools card above.
Census & demographics
- Census place
- Troy, NY
- County
- Rensselaer County · 75,590 people
- City population
- 53,479
- Metro
- Albany-Schenectady-Troy, NY
- Population (ZIP)
- 53,479
- Household income
- $75,851
- Rent vs Own
- Severe rent burden
- 2698.0
Population outlook (Rensselaer County) Hauer SSP2
- Today (2025)
- 162,400 people
- By 2030
- 161,746 · -0.4%
- By 2040
- 158,095 · -2.7%
- By 2050
- 152,966 · -5.8%
- By 2075
- 140,767 · -13.3%
- By 2100
- 124,727 · -23.2%
Race, ethnicity, and origin ACS 2023
- Neighborhood character
- Predominantly White (70%)
- Race & ethnicity
- White 70% Black 12% Hispanic / Latino 8% Two or more races 8% Asian 5%
- Hispanic origin (detail)
- Mexican 1% Puerto Rican 4%
- Common ancestry
- Romanian 5% Lithuanian 5% Slovak 1%
- Foreign-born
- 10% · Canada, China
- Languages at home
- 88% English-only · Spanish 4% Other Indo-European 2% Arabic 2%
Political lean MEDSL · Rensselaer
- 2024 margin
- Toss-up / Even · D 50.7% · R 49.3%
- 2008→2024 swing
- -8.0pp toward R · 2008: 9.3pp · 2024: 1.4pp
- All cycles
- 2024: D+1.4 2020: D+5.6 2016: R+2.9 2012: D+11.8 2008: D+9.3
Not yet ingested
- Civics
- —
Market trends
- HPI YoY
- ▼ -142.53%
- Current HPI
- 285.0762
- Rent YoY
- ▲ 4.88%
- Metro
- Albany-Schenectady-Troy, NY
- State GDP YoY
- ▲ 2.60%
- F500 in state
- 92
Industry mix (Fortune 500 HQ in NY)
| Industry | F500 HQs | Revenue |
|---|---|---|
| Financial Services | 10 | $950B |
|
||
| Consumer Goods | 9 | $162B |
|
||
| Insurance | 4 | $225B |
|
||
| Telecommunications | 2 | $144B |
|
||
| Pharmaceuticals | 2 | $112B |
|
||
| Media / Entertainment | 2 | $69B |
|
||
Price history
+370.0% since first listed15 events — show timeline
- 2026-04-23 Pending — Global MLS
- 2026-03-23 Price Changed $329,000 Global MLS
- 2026-03-17 Listed $347,000 Global MLS
- 2022-03-10 Sold (Public Records) $180,000 Public Records
- 2014-07-10 Sold (Public Records) $115,000 Public Records
- 2014-06-30 Sold (MLS) $115,000 Global MLS
- 2014-02-11 Listing Removed — Global MLS
- 2013-11-29 Listed $129,000 Global MLS
- 2008-01-15 Sold (MLS) $55,000 Global MLS
- 2007-12-10 Listing Removed — Global MLS
- 2007-10-09 Listed $59,000 Global MLS
- 2002-01-16 Sold (Public Records) $88,000 Public Records
- 2001-01-30 Sold (MLS) $1,000 Global MLS
- 2000-03-27 Listed $33,900 Global MLS
- 1995-02-28 Sold (Public Records) $70,000 Public Records
Property tax history
+32.8%/yrLatest (2025): $20,126 · +490.4% YoY. Source: county tax records.
Cash-flow waterfall
monthlySold comps — $/sqft
last 12 mo · ≤1 miLoading sold comps…