529 Sunset Rd N · Rotonda, FL
Flood risk 5/10 · Moderate
- FEMA flood zone
- X (unshaded)
- Chance of flooding over 30 yrs
- 0.47%
- Est. flood insurance / yr
- $507 – $1,088
Fire risk 1/10 · Minimal
- Est. fire insurance / yr
- $947 – $1,759
Heat risk 10/10 · Severe
- Hot days now (above 107°F)
- 7 days/yr
- Hot days in 30 yrs
- 28 days/yr
Wind risk 10/10 · Severe
- Chance of severe wind over 30 yrs
- 99.0%
Air-quality risk 2/10 · Minimal
- Unhealthy air days now
- 1 days/yr
- Unhealthy air days in 30 yrs
- 1 days/yr
Risk factors via First Street. Map © Google.
Why this score? — see what drove the D+ grade
The composite is a weighted blend of 9 inputs, each scored 0–100. Each bar is that input's sub-score; the figure is the points it added to the 100-point composite (weight × sub-score).
- ARV discount +13.8/15.0
- Cash flow +9.9/30.0
- Appreciation +5.6/10.0
- Schools +4.6/10.0
- Livability +3.4/5.0
- DSCR +2.8/10.0
- 1% rule +2.5/10.0
- Condition / age +2.5/5.0
- Rent growth +2.4/5.0
$299,000
🖨 Deal sheet (PDF) 📄 Offer letter ✓ Due diligence
Listing remarks MLS
Double lot Located in Rotonda Heights. Price is per lot. Both lots must be sold together.
Key facts
- New landscaping
- Hurricane shutters
- 8,125 sq ft lot
Tags
Property features AI
Finance
- Other: Pets allowed; Located in zoning RSF5
- Financial info: No lease restrictions reported; Total acreage less than 1/4 acre (approx. 0.19 acres)
- HOA & community: Has HOA (Legacy Property MANAGEMENT); Monthly association fee approximately $8
Exterior
- Parking: Attached garage; 2 garage spaces
- Utilities: Public water; Public sewer; Electricity connected; Water connected; Sewer connected
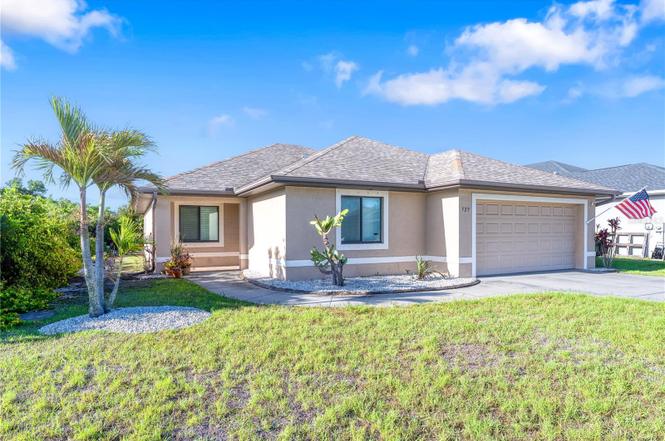
- Home design: Single Family Residence; One story; Faces north; Homestead status
- Construction: Block construction; Shingle roof; Slab foundation; Built area approximately 1,487 living area (public records)
- Exterior features: Covered rear porch; Screened porch; Hurricane shutters; Private mailbox; Rain gutters; Sidewalk; Lot is cleared, landscaped and level; Asphalt/paved road access
Interior
- Kitchen: Dishwasher; Microwave; Range; Refrigerator; Stone counters; Eat-in kitchen; Exhaust fan
- Bedrooms: 3 bedrooms
- Flooring: Ceramic tile
- Bathrooms: 2 full bathrooms
- Heating & cooling: Central heating; Central air
- Interior features: Ceiling fans; Eat-in kitchen; High ceilings; Open floorplan; Living room/dining room combo; Stone counters; Thermostat; Tray ceilings; Walk-in closets; ENERGY STAR qualified windows; Shutters; Exhaust fan; Sliding doors
- Laundry & utility: Washer; Dryer; Laundry room (inside); Electric water heater
Neighborhood map
What this means for you Summary
Snapshot
- This is a 3-bed/2.0-bath single-family listed at $299k.
Deal economics
- At list price, monthly cash flow is $-188 ($-2k/yr) — negative.
- To cash-flow at today's rent, offer at most $266k (11.1% below list).
- To meet the 1% rule (rent ≥ 1% of price), the offer needs to be $224k (25.2% below list).
- Recommended offer: $224k (25.2% below list) — sets the bar for 1% rule.
- Cap rate 5.5% vs local median 3.1% in Rotonda — top-decile yield for the area; either an underpriced asset or a hidden risk that comps aren't pricing in. Stress-test before assuming the spread holds.
Location & tenants
- Location reads 67/100 on livability (#548 in FL) — a middle-class / working-renter tenant base. Strengths: crime A+, housing A-, cost of living B+; Watch: amenities F, commute F, health & safety D-.
- Charlotte (suburban): math 54% / reading 54% proficiency, ranked #22 of 73 in FL (top 30%) — acceptable for families but not a draw, mixed tenant base, ~2y average lease.
- Zoned schools: Vineland Elementary School (math 74% / reading 67%, grade A-, #333 of 2,144 statewide, top 16%, 579 students, 45% FRL); L. A. Ainger Middle School (math 65% / reading 53%, grade B, #144 of 571 statewide, top 26%, 720 students, 40% FRL); Lemon Bay High School (math 50% / reading 56%, grade C-, #148 of 667 statewide, top 23%, 1,360 students, 28% FRL) — zoned schools average 38% FRL vs 54% district-wide (16 pts lower); this property's tenant base skews higher-income than the district average.
- Market conditions: Rents soft (-0.2%/yr); 869 active listings in the ZIP; 27 comparable units currently listed for rent nearby; rentals at typical pace (median 23d on market — plan ~3-4 weeks tenant-placement turnaround); solid renter incomes; 4,585 units permitted in Charlotte County in 2024 (703 in 5+ unit buildings).
- This rent runs 33% of the median local income ($80k/yr) — at the standard rent-burdened threshold; future hikes will face affordability resistance.
Forward outlook
- In year one you build about $6k of equity ($2k loan paydown + $4k appreciation (1.2% local appreciation)).
- Charlotte County population projected at +24% by 2050 — long-run rental-demand tailwind backs the buy-and-hold thesis.
- By year 6, paydown + projected appreciation supports a ~$32k cash-out refi (75% LTV) — recoverable capital for the next deal without selling this one.
Negotiation context
- It's been on market 116 days — a 9% lower offer ($272k) is reasonable based on typical stale-listing flexibility.
- 9 sale attempts since 20y ago; this cycle's ask has dropped $26k (8%) from the opening price — seller is motivated, your offer sets the floor, not the list.
- Current owner paid $218k; 37% above their basis — modest negotiation headroom, anchor on the comps not their cost.
Risks & watch-outs
- Climate carrying-cost: moderate flood risk; severe wind risk, 99% chance of damaging wind over 30y; extreme-heat days projected 7→28/yr by 2055 (HVAC capex compounding) — expect insurance premiums to compound above CPI over the hold.
Questions for the listing agent
- What do current leases actually rent for vs. the listed asking? Can we see a recent rent roll and the last 12 months of T-12 income?
- It's been on market 116 days. Have you received any prior offers? Is the seller open to a 25% concession, seller financing, or rate buy-down credit?
- What does the HOA fee cover, when was the last increase, and are there any pending special assessments or reserve-fund shortfalls?
- Why hasn't it sold? Are there any deal-killer items the seller is aware of (foundation, flood, title, zoning, code violations)?
- Is there a deadline driving the sale (1031 exchange, divorce, estate, relocation)? That informs how much negotiation room exists.
- Schools are D-rated, which usually means shorter tenancies and higher turnover. Who's the typical renter profile here, and what's been the actual vacancy rate?
- The area grade is low — what's the realistic commute time and amenity access for the typical tenant pool here? Any planned neighborhood developments (good or bad) we should know about?
- What's the average days-on-market for RENTAL listings here right now (not sales)? A rising rental-DOM trend means longer vacancies and softer asking-rent achievability than the comps imply.
- What's the recent tenant-quality profile in this submarket — average credit score on applications, eviction rate, late-payment / NSF rate, and stable-employment percentage? A property-management company in the area should have these aggregated.
- How much new for-sale + rental construction is in the pipeline within 1–3 miles? Heavy new supply typically softens prices + rents 12–24 months out; constrained supply supports both.
Investment metrics
- 1% rule
- 0.75% ✗
- Cap rate
- 5.54%
- Cash-on-cash
- -2.70%
- DSCR
- 0.88
- GRM
- 11.1
CMA / ARV
- ARV (on-the-fly)
- $347,958
- Comps found
- 12
Show comp detail 12 sales within ~0.75 mi
| Address | Dist | Beds/Ba | Sqft | Sold | Price | $/sf | Match |
|---|---|---|---|---|---|---|---|
| 7346 Bargello St | 0.40mi | 3/2.0 | 1,530 (+3%) | 4mo | $275,000 | $180 | 74 |
| 102 Rebel Ct | 0.35mi | 3/2.0 | 1,483 (-0%) | 15mo | $300,000 | $202 | 71 |
| 15 Mariner Ln | 0.63mi | 3/2.0 | 1,480 (-0%) | 1mo | $370,000 | $250 | 69 |
| 126 Spur Dr | 0.17mi | 3/2.0 | 1,659 (+12%) | 9mo | $430,000 | $259 | 65 |
| 105 Spur Dr | 0.30mi | 3/2.0 | 1,637 (+10%) | 8mo | $425,000 | $260 | 62 |
| 7305 Innsbrook St | 0.53mi | 3/2.0 | 1,462 (-2%) | 14mo | $250,000 | $171 | 61 |
| 7418 Clearwater St | 0.69mi | 3/2.0 | 1,502 (+1%) | 14mo | $320,000 | $213 | 55 |
| 10157 Seabrook Ave | 0.46mi | 3/2.0 | 1,690 (+14%) | 5mo | $395,000 | $234 | 52 |
| 7401 Teaberry St | 0.73mi | 3/2.0 | 1,645 (+11%) | 0mo | $448,455 | $273 | 48 |
| 10133 Gulfstream Blvd | 0.39mi | 3/2.0 | 1,267 (-15%) | 11mo | $200,000 | $158 | 48 |
| 25 Mariner Ln | 0.70mi | 3/2.0 | 1,592 (+7%) | 11mo | $330,000 | $207 | 47 |
| 27 Mariner Ln | 0.71mi | 3/2.5 | 1,652 (+11%) | 1mo | $420,000 | $254 | 45 |
Match score weights: distance 35% · size 25% · config 20% · recency 20%. Top-matched comps best support the ARV.
Projected returns pro-forma
1.25% appreciation · 0.0% rent growth · sell at horizon
- IRR
- -2.2%
- Equity multiple
- 0.89×
- Total profit
- $-9,300
- Equity at exit
- $105,983
- IRR
- 1.2%
- Equity multiple
- 1.14×
- Total profit
- $11,735
- Equity at exit
- $143,915
Cash invested: $83,720 (down + closing). Projections, not guarantees.
Landlord ↔ Tenant lean methodology
- Overall (STATE)
- 87 Strongly Landlord-Friendly
- State Florida
- 87 Strongly Landlord-Friendly · R+3
- County
- — inherits STATE
- City
- — inherits STATE
ZIP-level market 33947
- Home prices YoY
- 0.4%
- Rents YoY
- -0.2%
- Active inventory
- 869
- Price-to-rent
- 11.1×
Monthly cashflow live
- Estimated rent
- $2,236 high interval (Pro) →
- Mortgage (P&I)
- −$1,568
- Tax from tax record
- −$254 /mo · $3,043/yr
- Insurance
- −$125
- HOA
- −$8
- Vacancy / Maint / Mgmt
- −$469
- Net cashflow
- $-188
Break-even live
Sensitivity live
| Price | -10% $-19 | -5% $-103 | +0% $-188 | +5% $-273 | +10% $-357 |
|---|---|---|---|---|---|
| Rent | -10% $-365 | -5% $-276 | +0% $-188 | +5% $-100 | +10% $-11 |
| Rate | -1.0pp $-38 | -0.5pp $-112 | base $-188 | +0.5pp $-266 | +1.0pp $-344 |
UW: 25.0% down · 7.5% · 30yr · 1.5% tax · 5.0% vac · 8.0% maint · 8.0% mgmt
Financing live
Cash to close
- Down payment
- $74,750
- Closing costs
- $8,970
- Reserves months
- —
- Total cash needed
- —
Loan-product check · same deal, 3 products live
Conventional
25% down · 7.5% · 30yr
- Down + closing
- —
- Monthly P&I
- —
- Monthly cashflow
- —
- DSCR
- —
- Eligible?
- —
Personal DTI + credit; lowest rate.
DSCR
20% down · 8.5% · 30yr
- Down + closing
- —
- Monthly P&I
- —
- Monthly cashflow
- —
- DSCR
- —
- Eligible?
- —
No personal income docs; deal must DSCR.
Hard money
10% down · 12.0% · 12mo
- Down + closing
- —
- Monthly P&I
- —
- Monthly cashflow
- —
- DSCR
- —
- Eligible?
- —
Short-term bridge; refi at stabilization.
Rent comps 27 comps
| Address | Beds | Baths | Sqft | Rent | $/sqft | DOM | Units | Dist |
|---|---|---|---|---|---|---|---|---|
| 502 Sunset Rd N Rotonda West, FL | 3.0 | 2.0 | 1636 | $2,100 | $1.28 | 23d | 1 | 0.19mi |
| 285 Mark Twain Ln Rotonda West, FL | 3.0 | 2.0 | 1759 | $1,750 | $0.99 | 23d | 1 | 0.59mi |
| 309 Boundary Blvd Unit B Rotonda West, FL | 2.0 | 2.0 | 960 | $1,450 | $1.51 | 23d | 1 | 0.78mi |
| 7344 Brookhaven Ter Englewood, FL | 3.0 | 2.0 | 1594 | $2,095 | $1.31 | 23d | 1 | 0.80mi |
| 289 Boundary Blvd Unit 202 Rotonda West, FL | 3.0 | 2.0 | 1168 | $1,645 | $1.41 | 23d | 1 | 0.93mi |
| 65 Fairway Rd Rotonda West, FL | 3.0 | 2.0 | 1865 | $2,700 | $1.45 | 23d | 1 | 0.94mi |
| 9372 San Bernandino Ave Englewood, FL | 2.0 | 2.0 | 1020 | $4,666 | $4.57 | 23d | 1 | 0.95mi |
| 278 Boundary Blvd Unit B Rotonda West, FL | 2.0 | 2.0 | 1138 | $1,625 | $1.43 | 23d | 1 | 1.00mi |
| 36 Bunker Cir Rotonda West, FL | 2.0 | 2.0 | 1533 | $3,999 | $2.61 | 23d | 1 | 1.07mi |
| 527 Rotonda Cir Rotonda West, FL | 3.0 | 2.0 | 1586 | $2,375 | $1.50 | 23d | 1 | 1.07mi |
| 181 Bunker Rd Rotonda West, FL | 2.0 | 2.0 | 1355 | $4,600 | $3.39 | 23d | 1 | 1.17mi |
| 8363 Sago Ct Englewood, FL | 2.0 | 2.0 | 1360 | $1,950 | $1.43 | 23d | 1 | 1.20mi |
| 10195 Burlington Ave Englewood, FL | 2.0 | 2.0 | 1048 | $1,750 | $1.67 | 15d | 1 | 1.22mi |
| 9416 Anita Ave Englewood, FL | 3.0 | 2.0 | 1162 | $1,750 | $1.51 | 15d | 1 | 1.30mi |
| 9322 Anita Ave Englewood, FL | 2.0 | 2.0 | 1133 | $1,495 | $1.32 | 23d | 1 | 1.35mi |
| 9312 Anita Ave Unit B Englewood, FL | 2.0 | 1.0 | 972 | $1,600 | $1.65 | 23d | 1 | 1.36mi |
| 10336 Pendleton Ave Englewood, FL | 3.0 | 2.0 | 1162 | $1,800 | $1.55 | 23d | 1 | 1.37mi |
| 226 Boundary Blvd Rotonda West, FL | 2.0 | 2.0 | 1200 | $1,495 | $1.25 | 15d | 1 | 1.39mi |
| 9264 Anita Ave Unit A Englewood, FL | 2.0 | 2.0 | 1008 | $1,400 | $1.39 | 23d | 1 | 1.40mi |
| 114 Albatross Rd Rotonda West, FL | 3.0 | 2.0 | 1648 | $5,300 | $3.22 | 23d | 1 | 1.40mi |
| 7114 Sunnybrook Blvd Englewood, FL | 4.0 | 2.0 | 1636 | $2,297 | $1.40 | 23d | 1 | 1.41mi |
| 42 Mark Twain Ln Rotonda West, FL | 3.0 | 2.5 | 1677 | $2,800 | $1.67 | 23d | 1 | 1.44mi |
| 9410 Tacoma Ave Unit A Englewood, FL | 3.0 | 2.0 | 1062 | $1,600 | $1.51 | 15d | 1 | 1.45mi |
| 9271 Tacoma Ave Unit B Englewood, FL | 2.0 | 2.0 | 1206 | $1,650 | $1.37 | 23d | 1 | 1.47mi |
| 6320 Brookridge St Englewood, FL | 3.0 | 2.0 | 1445 | $5,550 | $3.84 | 23d | 1 | 1.49mi |
| 10452 Pendleton Ave Englewood, FL | 3.0 | 2.0 | 1164 | $1,700 | $1.46 | 15d | 1 | 1.49mi |
| 87 Mark Twain Ln Rotonda West, FL | 3.0 | 2.0 | 1235 | $2,500 | $2.02 | 23d | 1 | 1.50mi |
HOA detail
- Monthly dues
- $8 · $96/yr
Listing history 40 events
-
2026-06-22days on market $299,000 Active 116 DOM
-
2026-06-18days on market $299,000 Active 113 DOM
-
2026-06-17days on market $299,000 Active 112 DOM
-
2026-06-16days on market $299,000 Active 111 DOM
-
2026-06-15days on market $299,000 Active 110 DOM
-
2026-06-14days on market $299,000 Active 108 DOM
-
2026-06-13days on market $299,000 Active 107 DOM
-
2026-06-10days on market $299,000 Active 105 DOM
-
2026-06-09days on market $299,000 Active 104 DOM
-
2026-06-08days on market $299,000 Active 103 DOM
-
2026-06-07days on market $299,000 Active 102 DOM
-
2026-06-05days on market $299,000 Active 99 DOM
-
2026-06-03days on market $299,000 Active 98 DOM
-
2026-06-02days on market $299,000 Active 97 DOM
-
2026-06-01days on market $299,000 Active 96 DOM
-
2026-05-31days on market $299,000 Active 95 DOM
-
2026-05-30days on market $299,000 Active 94 DOM
-
2026-04-27price $299,000
-
2026-04-14price $308,750
-
2026-02-25$325,000 Active
-
2026-02-18historical
-
2026-02-13status Active
-
2025-11-12price $315,000
-
2025-09-17price $324,500
-
2025-07-28price $329,900
-
2025-06-27$335,000 Active
-
2017-04-28soldstatus $218,000
-
2016-02-25status Pending 89-char remark
Show marketing remark (89 chars)
Double lot Located in Rotonda Heights. Price is per lot. Both lots must be sold together.
-
2016-02-25soldstatus $9,000 Sold 89-char remark
Show marketing remark (89 chars)
Double lot Located in Rotonda Heights. Price is per lot. Both lots must be sold together.
-
2016-02-25soldstatus $9,000 Sold 89-char remark
Show marketing remark (89 chars)
Double lot Located in Rotonda Heights. Price is per lot. Both lots must be sold together.
-
2016-02-11status Pending 89-char remark
Show marketing remark (89 chars)
Double lot Located in Rotonda Heights. Price is per lot. Both lots must be sold together.
-
2016-02-04status Active 89-char remark
Show marketing remark (89 chars)
Double lot Located in Rotonda Heights. Price is per lot. Both lots must be sold together.
-
2016-02-04status Pending 89-char remark
Show marketing remark (89 chars)
Double lot Located in Rotonda Heights. Price is per lot. Both lots must be sold together.
-
2014-09-26status Active 89-char remark
Show marketing remark (89 chars)
Double lot Located in Rotonda Heights. Price is per lot. Both lots must be sold together.
-
2014-09-18status Pending 89-char remark
Show marketing remark (89 chars)
Double lot Located in Rotonda Heights. Price is per lot. Both lots must be sold together.
-
2014-06-14status Active 89-char remark
Show marketing remark (89 chars)
Double lot Located in Rotonda Heights. Price is per lot. Both lots must be sold together.
-
2014-06-10historical 89-char remark
Show marketing remark (89 chars)
Double lot Located in Rotonda Heights. Price is per lot. Both lots must be sold together.
-
2013-11-12$11,900 Active 89-char remark
Show marketing remark (89 chars)
Double lot Located in Rotonda Heights. Price is per lot. Both lots must be sold together.
-
2006-03-09$74,900
-
2006-03-08$74,900
ⓘ Source: listings_history table (triggers on properties + properties_extension) + one-shot
backfill from property_details.listing_events for pre-trigger history.
Tax reassessment forecast FL · Resets to sale price
- Current annual tax
- $3,043 · $254/mo
- Projected year-2 tax
- $3,043 · $254/mo
- Expected delta
- $0/yr ($0/mo · 0.0%)
ⓘ Screening estimate from a state-policy table — verify with the county assessor before closing.
Climate risk First Street
- Flood 5/10 Major FEMA zone X (unshaded) · 47% chance over 30 yrs
- Wildfire 1/10 Low
- Heat 10/10 Extreme 7 d/yr ≥107°F today · 28 d/yr by 30 yrs out
- Wind 10/10 Extreme 99% chance of damaging wind over 30 yrs
- Air quality 2/10 Low 1 unhealthy d/yr today · 1 by 30 yrs out
Nearby sold comps map
Loading sold comps map…
Walkable amenities ~0.75 mi
Loading nearby amenities…
Taxation est. · year 1
- Rental income
- $26,826
- − Mortgage interest
- −$16,749
- − Property taxes
- −$3,043
- − Insurance
- −$1,495
- − Repairs & maintenance
- −$2,146
- − Management
- −$2,146
- − HOA
- −$96
- − Depreciation
- −$8,698
- Taxable loss
- −$7,547
- Est. tax savings @ 24.0%
- +$1,811
- After-tax cash flow
- $-446/yr
For passive investors: Depreciation is non-cash, so a rental often shows a tax loss while cash-flowing — sheltering income. Rental losses are passive: they offset passive income freely, and up to $25,000/yr can offset ordinary (W-2) income if you actively participate and your MAGI is under $100k (phasing out to $0 by $150k); unused losses carry forward. On sale, claimed depreciation is recaptured at up to 25%, and gains may owe capital-gains tax (a 1031 exchange can defer both). Figures are a year-1 estimate at your 24.0% rate — not tax advice; consult a CPA.
Schools (NCES district)
- District
- Charlotte
- NCES district ID
- 1200240
- Math proficiency
- 54% ▼ -6.00%
- Reading proficiency
- 54% ▼ -1.00%
- Median HH income
- $44,864
- Composite
- 45.62/100
- National rank
- #2586
- State rank
- #22 of 73 in FL
Livability — Rotonda
- Score
- 67/100
- State rank
- #548
- US rank
- #10359
Category grades
Schools grade is shown separately in the Schools card above.
Census & demographics
- County
- Charlotte County · 196,994 people
- City population
- 10,490
- Metro
- Punta Gorda, FL
- Population (ZIP)
- 10,447
- Household income
- $80,091
- Rent vs Own
- Severe rent burden
- 91.0
Population outlook (Charlotte County) Hauer SSP2
- Today (2025)
- 198,646 people
- By 2030
- 210,507 · +6.0%
- By 2040
- 230,857 · +16.2%
- By 2050
- 247,148 · +24.4%
- By 2075
- 281,777 · +41.8%
- By 2100
- 293,609 · +47.8%
Race, ethnicity, and origin ACS 2023
- Neighborhood character
- Predominantly White (96%)
- Race & ethnicity
- White 96% Hispanic / Latino 2% Two or more races 2%
- Common ancestry
- Romanian 5% Lithuanian 4% Slovak 4%
- Foreign-born
- 8% · Canada, Vietnam
- Languages at home
- 93% English-only · Russian/Polish/Slavic 3% Spanish 2% German/W. Germanic 1%
Political lean MEDSL · Charlotte
- 2024 margin
- Solid R (+34.0) · D 32.7% · R 66.7%
- 2008→2024 swing
- -26.7pp toward R · 2008: -7.2pp · 2024: -34.0pp
- All cycles
- 2024: R+34.0 2020: R+26.6 2016: R+27.8 2012: R+14.3 2008: R+7.2
Not yet ingested
- Civics
- —
Market trends
- HPI YoY
- ▲ 1.25%
- Current HPI
- 311.3231
- Rent YoY
- ▼ -0.22%
- Metro
- Punta Gorda, FL
- State GDP YoY
- ▲ 3.28%
- F500 in state
- 36
Industry mix (Fortune 500 HQ in FL)
| Industry | F500 HQs | Revenue |
|---|---|---|
| Industrial Technology | 2 | $29B |
|
||
| Insurance | 2 | $17B |
|
||
| Retail | 1 | $60B |
|
||
| Technology Distribution | 1 | $58B |
|
||
| Homebuilding | 1 | $35B |
|
||
| Technology Manufacturing | 1 | $35B |
|
||
Price history
+299.2% since first listed23 events — show timeline
- 2026-04-27 Price Changed $299,000 Stellar MLS as Distributed by MLS Grid
- 2026-04-14 Price Changed $308,750 Stellar MLS as Distributed by MLS Grid
- 2026-02-25 Listed $325,000 Stellar MLS as Distributed by MLS Grid
- 2026-02-18 Listing Removed — Stellar MLS as Distributed by MLS Grid
- 2026-02-13 Relisted — Stellar MLS as Distributed by MLS Grid
- 2025-11-12 Price Changed $315,000 Stellar MLS as Distributed by MLS Grid
- 2025-09-17 Price Changed $324,500 Stellar MLS as Distributed by MLS Grid
- 2025-07-28 Price Changed $329,900 Stellar MLS as Distributed by MLS Grid
- 2025-06-27 Listed $335,000 Stellar MLS as Distributed by MLS Grid
- 2017-04-28 Sold (Public Records) $218,000 Public Records
- 2016-02-25 Pending — Stellar MLS as Distributed by MLS Grid
- 2016-02-25 Sold (MLS) $9,000 Stellar MLS as Distributed by MLS Grid
- 2016-02-25 Sold (MLS) $9,000 Stellar MLS as Distributed by MLS Grid
- 2016-02-11 Pending — Stellar MLS as Distributed by MLS Grid
- 2016-02-04 Relisted — Stellar MLS as Distributed by MLS Grid
- 2016-02-04 Pending — Stellar MLS as Distributed by MLS Grid
- 2014-09-26 Relisted — Stellar MLS as Distributed by MLS Grid
- 2014-09-18 Pending — Stellar MLS as Distributed by MLS Grid
- 2014-06-14 Relisted — Stellar MLS as Distributed by MLS Grid
- 2014-06-10 Listing Removed — Stellar MLS as Distributed by MLS Grid
- 2013-11-12 Listed $11,900 Stellar MLS as Distributed by MLS Grid
- 2006-03-09 Listed $74,900 Stellar MLS as Distributed by MLS Grid
- 2006-03-08 Listed $74,900 Stellar MLS as Distributed by MLS Grid
Property tax history
+27.2%/yrLatest (2025): $3,043 · +3.0% YoY. Source: county tax records.
Cash-flow waterfall
monthlySold comps — $/sqft
last 12 mo · ≤1 miLoading sold comps…