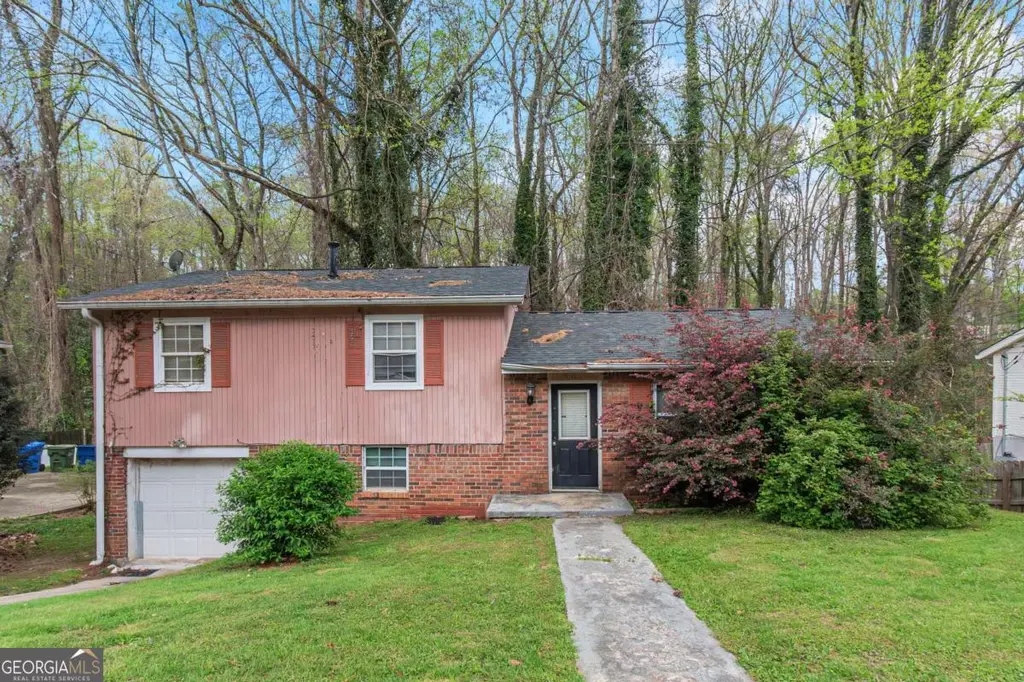
316 Argus Cir NW · Atlanta, GA
Flood risk 4/10 · Minor
- FEMA flood zone
- X (unshaded)
- Chance of flooding over 30 yrs
- 0.22%
- Est. flood insurance / yr
- $473 – $860
Fire risk 2/10 · Minimal
- Est. fire insurance / yr
- $963 – $1,789
Heat risk 5/10 · Moderate
- Hot days now (above 103°F)
- 6 days/yr
- Hot days in 30 yrs
- 16 days/yr
Wind risk 6/10 · Moderate
- Chance of severe wind over 30 yrs
- 27.0%
Air-quality risk 4/10 · Minor
- Unhealthy air days now
- 3 days/yr
- Unhealthy air days in 30 yrs
- 5 days/yr
Risk factors via First Street. Map © Google.
Why this score? — see what drove the B grade
The composite is a weighted blend of 9 inputs, each scored 0–100. Each bar is that input's sub-score; the figure is the points it added to the 100-point composite (weight × sub-score).
- Cash flow +30.0/30.0
- 1% rule +10.0/10.0
- DSCR +10.0/10.0
- ARV discount +7.5/15.0
- Livability +4.2/5.0
- Rent growth +3.2/5.0
- Schools +2.7/10.0
- Condition / age +2.5/5.0
- Appreciation +0.0/10.0
$120,000
🖨 Deal sheet (PDF) 📄 Offer letter ✓ Due diligence
Listing remarks MLS
Incredible Opportunity! Looking for a renovation project to make your own? This property boasts a functional layout, spacious living room, oversized bedrooms, stunning porches, and so much more. This property is sold in as-is condition. All information in this listing is estimated and should be verified by potential buyer.
Key facts
- 0.32 acre lot
- Garage
- Built 1969
Property features AI
Exterior
- Parking: Garage (1 car)
- Utilities: Public water; Public sewer
- Home design: One and one-half levels; Basement (partial); Property listed as a fixer
- Construction: Brick construction; Composition roof; Slab foundation; Built with above-grade and below-grade finished areas
- Exterior features: Concrete road access
Interior
- Kitchen: Pantry
- Bedrooms: 4 main-level bedrooms; Bedrooms with other features
- Flooring: Hardwood floors
- Bathrooms: 2 full bathrooms; 2 half bathrooms; Master bath with tub/shower combo; 2 main-level bathrooms (including 2 half baths)
- Heating & cooling: Central heating; Central air conditioning
- Interior features: No common walls; Partial basement
- Laundry & utility: Common area laundry
Neighborhood map
What this means for you Summary
Snapshot
- This is a 4-bed/2.0-bath single-family listed at $120k.
Deal economics
- At list price, monthly cash flow is $654 ($8k/yr) — positive.
- The deal already cash-flows at list — no discount required.
- Meets the 1% rule at list price ($2k rent vs $120k).
- Cap rate 12.8% vs local median 3.1% in Atlanta — top-decile yield for the area; either an underpriced asset or a hidden risk that comps aren't pricing in. Stress-test before assuming the spread holds.
Location & tenants
- Location reads 83/100 on livability (#6 in GA, #919 nationally) — a professional / high-income tenant draw. Strengths: amenities A+, commute A+, housing A+; Watch: cost of living C-.
- Atlanta Public Schools (urban): math 28% / reading 35% proficiency, ranked #80 of 174 in GA (top 46%) — families likely to look elsewhere, expect single-tenant / working-renter base with shorter leases; 71% free/reduced lunch — lower-income household profile, screen leases tightly.
- Zoned schools: Harper-Archer Elementary School (math 2% / reading 8%, grade F, #1,160 of 1,228 statewide, top 98%, 641 students, 100% FRL); John Lewis Invictus Academy (math 2% / reading 2%, grade F, #470 of 470 statewide, top 100%, 825 students, 100% FRL); Frederick Douglass High School (math 24%, 1,112 students, 100% FRL) — zoned schools average 100% FRL vs 71% district-wide (29 pts higher); higher-poverty schools than district average — tighter screening recommended.
- Zoned-school proficiency averages 4% at this address vs 32% district-wide (-28 pts) — the specific schools serving this property underperform the Atlanta Public Schools average; the district grade overstates school quality for this exact location.
- Market conditions: Rents rising (+2.6%/yr); 485 active listings in the ZIP; 31 comparable units currently listed for rent nearby; rentals at typical pace (median 18d on market — plan ~3-4 weeks tenant-placement turnaround); 11,565 units permitted in Fulton County in 2024 (8,159 in 5+ unit buildings).
- This rent runs 38% of the median local income ($63k/yr) — at the standard rent-burdened threshold; future hikes will face affordability resistance.
Forward outlook
- Local home prices are declining (-3.0%/yr); year-one equity from $830 of loan paydown is wiped out by about $4k of value loss. Plan a longer hold.
- Fulton County population projected at +38% by 2050 — long-run rental-demand tailwind backs the buy-and-hold thesis.
- At projected returns (-3.0% appreciation + 2.6% rent growth), your $34k cash investment doubles in ~6 years — after that, you're playing with house money.
Negotiation context
- Only 10 days on market — expect competitive offers; lowballing is unlikely to land.
- 2 sale attempts with the ask held roughly flat each time — persistent listings suggest the price (not the market) is what's stuck; bring a comps-based counter.
Risks & watch-outs
- Climate carrying-cost: major wind risk, 27% chance of damaging wind over 30y; extreme-heat days projected 6→16/yr by 2055 (HVAC capex compounding) — expect insurance premiums to compound above CPI over the hold.
Questions for the listing agent
- Built in 1969 — when were the roof, HVAC, electrical panel, plumbing, and water heater last replaced?
- Is there a deadline driving the sale (1031 exchange, divorce, estate, relocation)? That informs how much negotiation room exists.
- What's the average days-on-market for RENTAL listings here right now (not sales)? A rising rental-DOM trend means longer vacancies and softer asking-rent achievability than the comps imply.
- What's the recent tenant-quality profile in this submarket — average credit score on applications, eviction rate, late-payment / NSF rate, and stable-employment percentage? A property-management company in the area should have these aggregated.
- How much new for-sale + rental construction is in the pipeline within 1–3 miles? Heavy new supply typically softens prices + rents 12–24 months out; constrained supply supports both.
Investment metrics
- 1% rule
- 1.64% ✓
- Cap rate
- 12.84%
- Cash-on-cash
- 23.37%
- DSCR
- 2.04
- GRM
- 5.1
CMA / ARV
- ARV (on-the-fly)
- $253,344
- Comps found
- 12
Show comp detail 12 sales within ~0.75 mi
| Address | Dist | Beds/Ba | Sqft | Sold | Price | $/sf | Match |
|---|---|---|---|---|---|---|---|
| 316 Argus Cir NW | 0.00mi | 4/3.0 | 1,392 (0%) | 1mo | $110,000 | $79 | 95 |
| 4023 Kenner Dr SW | 0.43mi | 3/2.0 (-1) | 1,389 (-0%) | 16mo | $248,000 | $179 | 61 |
| 3698 Fairlane Dr | 0.28mi | 3/2.0 (-1) | 1,432 (+3%) | 20mo | $153,000 | $107 | 61 |
| 438 Fairlock Ln NW | 0.28mi | 4/2.0 | 1,500 (+8%) | 20mo | $273,000 | $182 | 58 |
| 220 Harwell Rd NW | 0.63mi | 3/2.0 (-1) | 1,421 (+2%) | 6mo | $193,000 | $136 | 57 |
| 3510 Thompson Dr NW | 0.21mi | 3/2.5 (-1) | 1,559 (+12%) | 9mo | $355,000 | $228 | 56 |
| 473 Oakside Dr SW | 0.61mi | 3/2.0 (-1) | 1,362 (-2%) | 12mo | $155,000 | $114 | 53 |
| 3851 Kenner Dr SW | 0.60mi | 4/3.0 | 1,364 (-2%) | 16mo | $279,000 | $205 | 51 |
| 192 Hemphill School Rd NW | 0.32mi | 4/2.0 | 1,216 (-13%) | 20mo | $300,000 | $247 | 47 |
| 3565 Collier Drive Rd NW | 0.28mi | 4/3.0 | 1,598 (+15%) | 15mo | $295,000 | $185 | 46 |
| 344 Woodstock Dr SW | 0.58mi | 4/3.0 | 1,600 (+15%) | 10mo | $305,000 | $191 | 36 |
| 664 Bolton Rd NW | 0.60mi | 3/1.0 (-1) | 1,188 (-15%) | 4mo | $165,000 | $139 | 35 |
Match score weights: distance 35% · size 25% · config 20% · recency 20%. Top-matched comps best support the ARV.
Projected returns pro-forma
-3.0% appreciation · 2.63% rent growth · sell at horizon
- IRR
- 16.0%
- Equity multiple
- 1.64×
- Total profit
- $21,569
- Equity at exit
- $17,892
- IRR
- 24.4%
- Equity multiple
- 3.08×
- Total profit
- $69,765
- Equity at exit
- $10,375
Cash invested: $33,600 (down + closing). Projections, not guarantees.
Landlord ↔ Tenant lean methodology
- Overall (STATE)
- 90 Strongly Landlord-Friendly
- State Georgia
- 90 Strongly Landlord-Friendly · R+3
- County
- — inherits STATE
- City
- — inherits STATE
ZIP-level market 30331
- Home prices YoY
- -34.2%
- Rents YoY
- 2.6%
- Active inventory
- 485
- Price-to-rent
- 5.1×
Monthly cashflow live
- Estimated rent
- $1,969 high interval (Pro) →
- Mortgage (P&I)
- −$629
- Tax from tax record
- −$222 /mo · $2,666/yr
- Insurance
- −$50
- HOA
- −$0
- Vacancy / Maint / Mgmt
- −$414
- Net cashflow
- $654
Break-even live
Sensitivity live
| Price | -10% $722 | -5% $688 | +0% $654 | +5% $620 | +10% $586 |
|---|---|---|---|---|---|
| Rent | -10% $499 | -5% $576 | +0% $654 | +5% $732 | +10% $810 |
| Rate | -1.0pp $715 | -0.5pp $685 | base $654 | +0.5pp $623 | +1.0pp $592 |
UW: 25.0% down · 7.5% · 30yr · 1.5% tax · 5.0% vac · 8.0% maint · 8.0% mgmt
Financing live
Cash to close
- Down payment
- $30,000
- Closing costs
- $3,600
- Reserves months
- —
- Total cash needed
- —
Loan-product check · same deal, 3 products live
Conventional
25% down · 7.5% · 30yr
- Down + closing
- —
- Monthly P&I
- —
- Monthly cashflow
- —
- DSCR
- —
- Eligible?
- —
Personal DTI + credit; lowest rate.
DSCR
20% down · 8.5% · 30yr
- Down + closing
- —
- Monthly P&I
- —
- Monthly cashflow
- —
- DSCR
- —
- Eligible?
- —
No personal income docs; deal must DSCR.
Hard money
10% down · 12.0% · 12mo
- Down + closing
- —
- Monthly P&I
- —
- Monthly cashflow
- —
- DSCR
- —
- Eligible?
- —
Short-term bridge; refi at stabilization.
Rent comps 31 comps
| Address | Beds | Baths | Sqft | Rent | $/sqft | DOM | Units | Dist |
|---|---|---|---|---|---|---|---|---|
| 3590 Collier Dr NW Atlanta, GA | 4.0 | 4.0 | 1110 | $1,100 | $0.99 | 12d | 1 | 0.27mi |
| 451 Fairlock Ln NW Atlanta, GA | 3.0 | 1.0 | 1141 | $1,450 | $1.27 | 25d | 1 | 0.29mi |
| 3456 Thompson Dr NW Atlanta, GA | 3.0 | 1.0 | 975 | $1,750 | $1.79 | 25d | 1 | 0.30mi |
| 3466 Fairlane Dr NW Atlanta, GA | 3.0 | 1.0 | 950 | $1,495 | $1.57 | 25d | 1 | 0.32mi |
| 3554 Adkins Rd NW Atlanta, GA | 4.0 | 2.0 | 1350 | $2,031 | $1.50 | 0d | 1 | 0.52mi |
| 87 Howell Dr SW Atlanta, GA | 3.0 | 2.5 | 1840 | $2,700 | $1.47 | 25d | 1 | 0.57mi |
| 95 Howell Dr SW Atlanta, GA | 3.0 | 2.5 | 1840 | $1,840 | $1.00 | 15d | 1 | 0.58mi |
| 3919 Wisteria Ln SW Atlanta, GA | 4.0 | 2.0 | 1126 | $1,730 | $1.54 | 15d | 1 | 0.61mi |
| 3354 Delmar Ln NW Atlanta, GA | 3.0 | 2.0 | 1170 | $1,700 | $1.45 | 25d | 1 | 0.67mi |
| 440 Dartmouth Dr SW Atlanta, GA | 4.0 | 3.0 | 1148 | $1,795 | $1.56 | 22d | 1 | 0.71mi |
| 586 Oakside Dr SW Unit A Atlanta, GA | 3.0 | 1.0 | 1075 | $1,325 | $1.23 | 16d | 1 | 0.74mi |
| 3774 Clovis Ct NW Atlanta, GA | 3.0 | 1.0 | 1000 | $1,425 | $1.43 | 0d | 1 | 0.77mi |
| 3610 Bolfair Dr NW Atlanta, GA | 3.0 | 1.5 | 1178 | $1,900 | $1.61 | 25d | 1 | 0.91mi |
| 3566 Bolfair Dr NW Atlanta, GA | 3.0 | 2.0 | 1192 | $1,595 | $1.34 | 15d | 1 | 0.91mi |
| 3188 Delmar Ln NW Atlanta, GA | 3.0 | 2.0 | 1124 | $2,400 | $2.14 | 25d | 1 | 0.95mi |
| 350 Fennel Way SW Atlanta, GA | 4.0 | 2.0 | 1450 | $1,500 | $1.03 | 22d | 1 | 1.03mi |
| 639 Skipper Dr NW Atlanta, GA | 5.0 | 2.0 | 1379 | $2,250 | $1.63 | 0d | 1 | 1.04mi |
| 639 Skipper Dr NW Atlanta, GA | 5.0 | 2.0 | 1379 | $2,250 | $1.63 | 25d | 1 | 1.04mi |
| 3915 Basil Way SW Atlanta, GA | 3.0 | 2.0 | 1287 | $2,600 | $2.02 | 25d | 1 | 1.07mi |
| 942 Fairburn Rd NW Atlanta, GA | 3.0 | 2.0 | 900 | $1,623 | $1.80 | 23d | 1 | 1.08mi |
| 4172 Renfrew Ct SW Atlanta, GA | 4.0 | 2.0 | 1136 | $1,200 | $1.06 | 9d | 1 | 1.10mi |
| 40 Candlelight Ln SW Apt B Atlanta, GA | 3.0 | 3.0 | 1274 | $1,800 | $1.41 | 25d | 1 | 1.12mi |
| 900 Society Cir SW Atlanta, GA | 4.0 | 3.5 | 1710 | $2,500 | $1.46 | 25d | 1 | 1.17mi |
| 865 Society Cir SW Atlanta, GA | 4.0 | 3.5 | 1440 | $2,700 | $1.88 | 0d | 1 | 1.18mi |
| 975 Society Cir SW Atlanta, GA | 4.0 | 3.5 | 1700 | $2,350 | $1.38 | 3d | 1 | 1.26mi |
| 2875 Hedgewood Dr NW Atlanta, GA | 3.0 | 2.0 | 1100 | $1,700 | $1.55 | 18d | 1 | 1.39mi |
| 1015 Hayden St Atlanta, GA | 3.0 | 2.5 | 1339 | $2,400 | $1.79 | 0d | 1 | 1.42mi |
| 1040 Summerfield Way Atlanta, GA | 3.0 | 2.5 | 1378 | $2,000 | $1.45 | 0d | 1 | 1.42mi |
| 648 Providence Pl SW #37 Atlanta, GA | 3.0 | 3.5 | 1416 | $2,195 | $1.55 | 25d | 1 | 1.48mi |
| 648 Providence Pl SW #37 Atlanta, GA | 3.0 | 3.5 | 1416 | $2,195 | $1.55 | 0d | 1 | 1.48mi |
| 415 Fairburn Rd SW Atlanta, GA | 1.0–3.0 | 1.0–2.0 | 890 | $1,490 | $1.67 | 0d | 31 | 1.49mi |
Listing history 5 events
-
2026-05-04status Under Contract 324-char remark
Show marketing remark (324 chars)
Incredible Opportunity! Looking for a renovation project to make your own? This property boasts a functional layout, spacious living room, oversized bedrooms, stunning porches, and so much more. This property is sold in as-is condition. All information in this listing is estimated and should be verified by potential buyer.
-
2026-04-30status Pending
-
2026-04-16$120,000 New 324-char remark
Show marketing remark (324 chars)
Incredible Opportunity! Looking for a renovation project to make your own? This property boasts a functional layout, spacious living room, oversized bedrooms, stunning porches, and so much more. This property is sold in as-is condition. All information in this listing is estimated and should be verified by potential buyer.
-
2026-04-16$120,000 Active
Show marketing remark (324 chars)
Incredible Opportunity! Looking for a renovation project to make your own? This property boasts a functional layout, spacious living room, oversized bedrooms, stunning porches, and so much more. This property is sold in as-is condition. All information in this listing is estimated and should be verified by potential buyer.
-
2020-07-27soldstatus $129,300
ⓘ Source: listings_history table (triggers on properties + properties_extension) + one-shot
backfill from property_details.listing_events for pre-trigger history.
Tax reassessment forecast GA · Resets to sale price
- Current annual tax
- $2,666 · $222/mo
- Projected year-2 tax
- $2,666 · $222/mo
- Expected delta
- $0/yr ($0/mo · 0.0%)
ⓘ Screening estimate from a state-policy table — verify with the county assessor before closing.
Climate risk First Street
- Flood 4/10 Moderate FEMA zone X (unshaded) · 22% chance over 30 yrs
- Wildfire 2/10 Low
- Heat 5/10 Major 6 d/yr ≥103°F today · 16 d/yr by 30 yrs out
- Wind 6/10 Major 27% chance of damaging wind over 30 yrs
- Air quality 4/10 Moderate 3 unhealthy d/yr today · 5 by 30 yrs out
Nearby sold comps map
Loading sold comps map…
Walkable amenities ~0.75 mi
Loading nearby amenities…
Taxation est. · year 1
- Rental income
- $23,631
- − Mortgage interest
- −$6,722
- − Property taxes
- −$2,666
- − Insurance
- −$600
- − Repairs & maintenance
- −$1,890
- − Management
- −$1,890
- − Depreciation
- −$3,491
- Taxable income
- $6,371
- Est. tax owed @ 24.0%
- −$1,529
- After-tax cash flow
- $6,322/yr
For passive investors: Depreciation is non-cash, so a rental often shows a tax loss while cash-flowing — sheltering income. Rental losses are passive: they offset passive income freely, and up to $25,000/yr can offset ordinary (W-2) income if you actively participate and your MAGI is under $100k (phasing out to $0 by $150k); unused losses carry forward. On sale, claimed depreciation is recaptured at up to 25%, and gains may owe capital-gains tax (a 1031 exchange can defer both). Figures are a year-1 estimate at your 24.0% rate — not tax advice; consult a CPA.
Schools (NCES district)
- District
- Atlanta Public Schools
- NCES district ID
- 1300120
- Math proficiency
- 28% ▼ -6.00%
- Reading proficiency
- 35% ▼ -2.00%
- Median HH income
- $48,306
- Composite
- 27.27/100
- National rank
- #7006
- State rank
- #80 of 174 in GA
Livability — Atlanta
- Score
- 83/100
- State rank
- #6
- US rank
- #919
Category grades
Schools grade is shown separately in the Schools card above.
Census & demographics
- Census place
- Atlanta, GA
- County
- Fulton County · 1,094,430 people
- City population
- 629,525
- Metro
- Atlanta-Sandy Springs-Alpharetta, GA
- Population (ZIP)
- 62,567
- Household income
- $62,623
- Rent vs Own
- Severe rent burden
- 3748.0
Population outlook (Fulton County) Hauer SSP2
- Today (2025)
- 1,203,707 people
- By 2030
- 1,299,706 · +8.0%
- By 2040
- 1,488,256 · +23.6%
- By 2050
- 1,664,580 · +38.3%
- By 2075
- 2,036,072 · +69.2%
- By 2100
- 2,222,402 · +84.6%
Race, ethnicity, and origin ACS 2023
- Neighborhood character
- Predominantly Black (94%)
- Race & ethnicity
- Black 94% Two or more races 3% Hispanic / Latino 2%
- Common ancestry
- Hispanic 1%
- Foreign-born
- 4% · Canada
- Languages at home
- 95% English-only · Spanish 1% French/Haitian/Cajun 1%
Political lean MEDSL · Fulton
- 2024 margin
- Solid D (+44.9) · D 71.9% · R 27.0% · Other 1.1%
- 2008→2024 swing
- +9.8pp toward D · 2008: 35.0pp · 2024: 44.9pp
- All cycles
- 2024: D+44.9 2020: D+46.4 2016: D+42.1 2012: D+29.6 2008: D+35.0
Not yet ingested
- Civics
- —
Market trends
- HPI YoY
- ▼ -106.38%
- Current HPI
- 204.5402
- Rent YoY
- ▲ 2.63%
- Metro
- Atlanta-Sandy Springs-Alpharetta, GA
- State GDP YoY
- ▲ 2.66%
- F500 in state
- 28
Industry mix (Fortune 500 HQ in GA)
| Industry | F500 HQs | Revenue |
|---|---|---|
| Paper / Packaging | 2 | $29B |
|
||
| Retail | 1 | $160B |
|
||
| Transportation / Logistics | 1 | $91B |
|
||
| Airlines | 1 | $62B |
|
||
| Consumer Goods | 1 | $47B |
|
||
| Utilities | 1 | $25B |
|
||
Price history
-7.2% since first listed5 events — show timeline
- 2026-05-04 Pending — GAMLS
- 2026-04-30 Pending — FMLS
- 2026-04-16 Listed $120,000 FMLS
- 2026-04-16 Listed $120,000 GAMLS
- 2020-07-27 Sold (Public Records) $129,300 Public Records
Property tax history
+28.6%/yrLatest (2025): $2,666 · -12.6% YoY. Source: county tax records.
Cash-flow waterfall
monthlySold comps — $/sqft
last 12 mo · ≤1 miLoading sold comps…