 Duplex
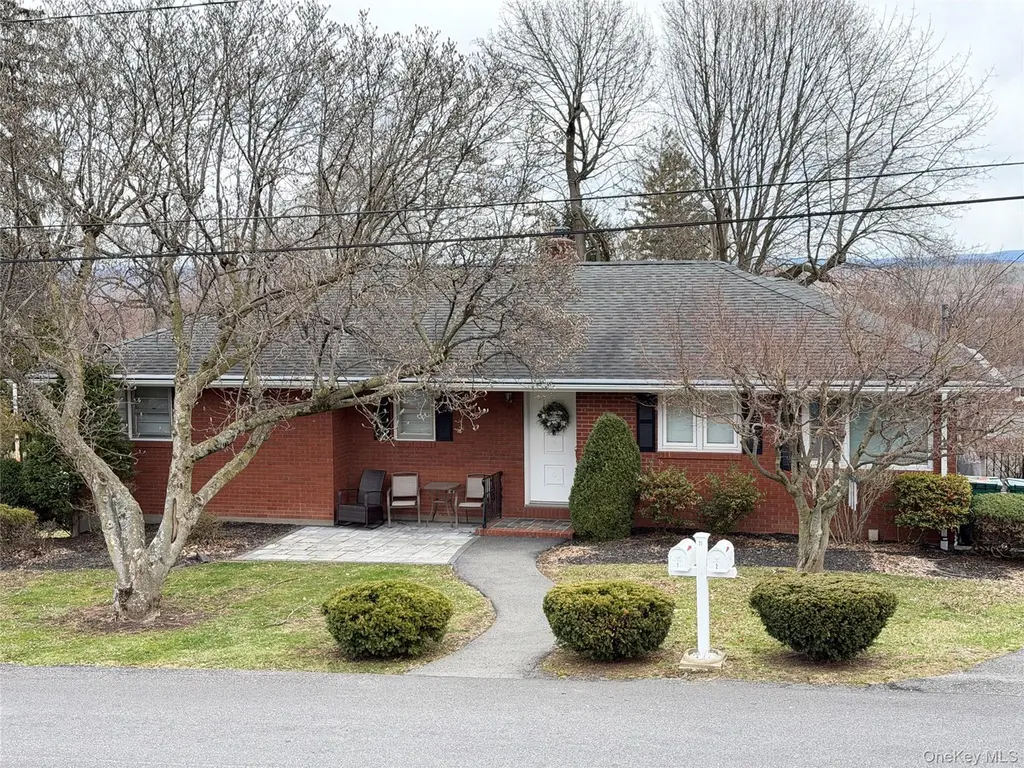
71 Orange St · Marlboro, NY
Flood risk 1/10 · Minimal
- FEMA flood zone
- X (unshaded)
- Chance of flooding over 30 yrs
- 0.0%
- Est. flood insurance / yr
- $473 – $860
Fire risk 1/10 · Minimal
- Est. fire insurance / yr
- $691 – $1,283
Heat risk 5/10 · Moderate
- Hot days now (above 100°F)
- 7 days/yr
- Hot days in 30 yrs
- 15 days/yr
Wind risk 4/10 · Minor
- Chance of severe wind over 30 yrs
- 13.0%
Air-quality risk 2/10 · Minimal
- Unhealthy air days now
- 1 days/yr
- Unhealthy air days in 30 yrs
- 2 days/yr
Risk factors via First Street. Map © Google.
Why this score? — see what drove the D+ grade
The composite is a weighted blend of 9 inputs, each scored 0–100. Each bar is that input's sub-score; the figure is the points it added to the 100-point composite (weight × sub-score).
- Cash flow +9.9/30.0
- Appreciation +9.5/10.0
- ARV discount +7.5/15.0
- Schools +4.4/10.0
- Livability +3.6/5.0
- 1% rule +3.1/10.0
- DSCR +2.8/10.0
- Rent growth +2.5/5.0
- Condition / age +2.5/5.0
$519,000
🖨 Deal sheet 📄 Offer letter ✓ Due diligence
Multi-family units
County records classify this as Multi-Family (2-4 Unit). Listing-text estimate: 2 units. confirmed
Listing remarks
Income Producing Brick Ranch: This charming, well-kept ranch-style two-family home is ready for you to make it your own. Imagine the ease of living with both apartments offering convenient ground-floor entrances—no steps to worry about, making everyday life so much simpler. Each apartment is thoughtfully laid out with three cozy bedrooms and a full bathroom, ideal for guests. The kitchens are fully equipped with modern appliances, inviting you to create delicious meals and lasting memories. The basement unit is relatively new, built in 2021, ensuring peace of mind and contemporary comfort. With a roof and HVAC system that are both in excellent condition, plus classic all-brick sidin
Key facts
- New basement unit
- Modern appliances
- Excellent roof
Tags
Property features AI
Exterior
- Parking: Driveway; Off-street parking; On-street parking; Parking lot access; Private parking; Shared driveway
- Utilities: Central Hudson electric service; Public sewer; Cable connected; Electricity connected; Natural gas connected; Phone connected
- Home design: Duplex; Updated/remodeled condition
- Construction: Brick construction; Block foundation
- Exterior features: Brick exterior; Finished basement; Attic with unfinished storage; Not waterfront
Interior
- Kitchen: Chef's kitchen; Granite counters; Kitchen island; Eat-in and open kitchen layout
- Bedrooms: Two 3-bedroom units (duplex configuration)
- Flooring: Carpet; Ceramic tile; Hardwood; Laminate
- Bathrooms: Two full bathrooms
- Heating & cooling: Baseboard heating; Hot water heating; Oil heating; Central air conditioning; Wood-burning fireplace in family room
- Interior features: First-floor bedroom; First-floor full bathroom; Chef's kitchen with granite counters and kitchen island; Eat-in kitchen and open kitchen with open floorplan; Recessed lighting; High-speed internet available; Washer/dryer hookup
- Laundry & utility: In-unit laundry with washer hookup and electric dryer hookup
Neighborhood map
What this means for you Summary
Snapshot
- This is a 2 × 3-bed/1.0-bath units multifamily listed at $519k.
Deal economics
- At list price, monthly cash flow is $-319 ($-4k/yr) — negative. Per door: $-160/mo.
- To cash-flow at today's rent, offer at most $463k (10.9% below list).
- To meet the 1% rule (rent ≥ 1% of price), the offer needs to be $420k (19.1% below list).
- Recommended offer: $420k (19.1% below list) — sets the bar for 1% rule.
- Cap rate 5.6% vs local median 3.0% in Marlboro — top-decile yield for the area; either an underpriced asset or a hidden risk that comps aren't pricing in. Stress-test before assuming the spread holds.
Location & tenants
- Location reads 72/100 on livability (#347 in NY) — a middle-class / working-renter tenant base. Strengths: employment A+, housing A+, crime A; Watch: cost of living D+, amenities F, commute D-.
- Marlboro Central School District (suburban): math 43% / reading 55% proficiency, ranked #366 of 590 in NY (top 62%) — families likely to look elsewhere, expect single-tenant / working-renter base with shorter leases.
- Zoned schools: Marlboro Elementary School (math 28% / reading 50%, grade F, #1,505 of 2,108 statewide, top 72%, 761 students, 0% FRL); Marlboro Middle School (math 36% / reading 43%, grade F, #418 of 729 statewide, top 59%, 433 students, 45% FRL); Marlboro Central High School (math 92% / reading 92%, grade A+, #171 of 1,100 statewide, top 18%, 628 students, 37% FRL) — zoned schools at 27% FRL track the district average.
- Market conditions: 56 active listings in the ZIP; 1 comparable units currently listed for rent nearby; 464 units permitted in Ulster County in 2024 (170 in 5+ unit buildings).
Forward outlook
- In year one you build about $50k of equity ($4k loan paydown + $47k appreciation (9.0% local appreciation)).
- Ulster County population projected at -14% by 2050 — secular population decline; favor cash flow + early exit over multi-decade hold.
- By year 2, paydown + projected appreciation supports a ~$80k cash-out refi (75% LTV) — recoverable capital for the next deal without selling this one.
Negotiation context
- Only 13 days on market — expect competitive offers; lowballing is unlikely to land.
- 5 sale attempts since 4y ago with the ask held roughly flat each time — persistent listings suggest the price (not the market) is what's stuck; bring a comps-based counter.
Risks & watch-outs
- Watch-outs: built in 1950 — expect roof / HVAC / electrical / plumbing capex.
- Climate carrying-cost: extreme-heat days projected 7→15/yr by 2055 (HVAC capex compounding) — expect insurance premiums to compound above CPI over the hold.
Questions for the listing agent
- What do current leases actually rent for vs. the listed asking? Can we see a recent rent roll and the last 12 months of T-12 income?
- Can we see the unit-by-unit rent roll, current vacancy, and any below-market leases? What's the average tenancy length?
- What capital expenditures (roof, boiler, parking lot, exteriors) have been made in the last 5 years, and what's planned in the next 2?
- Built in 1950 — when were the roof, HVAC, electrical panel, plumbing, and water heater last replaced?
- Is there a deadline driving the sale (1031 exchange, divorce, estate, relocation)? That informs how much negotiation room exists.
- Schools are B-rated — typically a magnet for longer-tenancy family renters. What's the average tenant stay here, and is there a school-zone premium baked into asking?
- The area grade is low — what's the realistic commute time and amenity access for the typical tenant pool here? Any planned neighborhood developments (good or bad) we should know about?
- What's the average days-on-market for RENTAL listings here right now (not sales)? A rising rental-DOM trend means longer vacancies and softer asking-rent achievability than the comps imply.
- What's the recent tenant-quality profile in this submarket — average credit score on applications, eviction rate, late-payment / NSF rate, and stable-employment percentage? A property-management company in the area should have these aggregated.
- How much new apartment / multifamily construction is in the pipeline within 1–3 miles? Heavy new supply (>2% of stock underway) typically softens rents 12–24 months out; light construction supports rent growth.
Investment metrics
- 1% rule
- 0.81% ✗
- Cap rate
- 5.56%
- Cash-on-cash
- -2.63%
- DSCR
- 0.88
- GRM
- 10.3
CMA / ARV
- ARV (on-the-fly)
- $331,344
- Comps found
- 1
Show comp detail 1 sale within ~0.75 mi
| Address | Dist | Beds/Ba | Sqft | Sold | Price | $/sf | Match |
|---|---|---|---|---|---|---|---|
| 44 Church St | 0.29mi | 4/2.0 (+1) | 1,716 (+12%) | 8mo | $370,000 | $216 | 53 |
Match score weights: distance 35% · size 25% · config 20% · recency 20%. Top-matched comps best support the ARV.
Projected returns pro-forma
8.97% appreciation · 3.0% rent growth · sell at horizon
- IRR
- 20.2%
- Equity multiple
- 2.56×
- Total profit
- $226,181
- Equity at exit
- $428,988
- IRR
- 18.5%
- Equity multiple
- 5.64×
- Total profit
- $674,914
- Equity at exit
- $886,940
Cash invested: $145,320 (down + closing). Projections, not guarantees.
Landlord ↔ Tenant lean methodology
- Overall (STATE)
- 15 Strongly Tenant-Friendly
- State New York
- 15 Strongly Tenant-Friendly · D+10
- County
- — inherits STATE
- City
- — inherits STATE
ZIP-level market 12542
- Home prices YoY
- 2.8%
- Active inventory
- 56
- Price-to-rent
- 20.6×
Monthly cashflow live
- Estimated rent
- $4,200 medium interval (Pro) →
- Mortgage (P&I)
- −$2,722
- Tax from tax record
- −$699 /mo · $8,389/yr
- Insurance
- −$216
- HOA
- −$0
- Vacancy / Maint / Mgmt
- −$882
- Net cashflow
- $-319
Break-even live
2-unit breakdown (identical units grouped — click to expand)
| Units | Beds | Baths | Est. rent |
|---|---|---|---|
| 2× units | 3 | 1 | $4,200 |
| #1 | 3 | 1 | $2,100 |
| #2 | 3 | 1 | $2,100 |
| Total (2 units) | $4,200 | ||
UW: 25.0% down · 7.5% · 30yr · 1.5% tax · 5.0% vac · 8.0% maint · 8.0% mgmt
Financing live
Cash to close
- Down payment
- $129,750
- Closing costs
- $15,570
- Reserves months
- —
- Total cash needed
- —
Loan-product check · same deal, 3 products live
Conventional
25% down · 7.5% · 30yr
- Down + closing
- —
- Monthly P&I
- —
- Monthly cashflow
- —
- DSCR
- —
- Eligible?
- —
Personal DTI + credit; lowest rate.
DSCR
20% down · 8.5% · 30yr
- Down + closing
- —
- Monthly P&I
- —
- Monthly cashflow
- —
- DSCR
- —
- Eligible?
- —
No personal income docs; deal must DSCR.
Hard money
10% down · 12.0% · 12mo
- Down + closing
- —
- Monthly P&I
- —
- Monthly cashflow
- —
- DSCR
- —
- Eligible?
- —
Short-term bridge; refi at stabilization.
Rent comps 1 comps
| Address | Beds | Baths | Sqft | Rent | $/sqft | DOM | Units | Dist |
|---|---|---|---|---|---|---|---|---|
| 6 Hudson West Dr Marlboro, NY | 2.0–3.0 | 2.0 | 1347 | $3,275 | $2.43 | 13d | 2 | 0.54mi |
Listing history 13 events
-
2026-04-21status Pending
-
2026-03-23$519,000 Active
-
2025-01-15historical $2,300
-
2024-12-09$2,300
-
2022-10-27historical
-
2022-09-30price $444,400
-
2022-09-30price $444,400
-
2022-09-30status Active
-
2022-09-26historical Accepted (Show)
-
2022-09-07price $449,400
-
2022-09-07price $449,400
-
2022-08-19$449,900 Active
-
2022-08-19$449,900 Active
ⓘ Source: listings_history table (triggers on properties + properties_extension) + one-shot
backfill from property_details.listing_events for pre-trigger history.
Tax reassessment forecast NY · Partial reset (capped growth)
- Current annual tax
- $8,389 · $699/mo
- Projected year-2 tax
- $8,580 · $715/mo
- Expected delta
- +$191/yr (+$16/mo · 2.3%)
ⓘ Screening estimate from a state-policy table — verify with the county assessor before closing.
Climate risk First Street
- Flood 1/10 Low FEMA zone X (unshaded) · 0% chance over 30 yrs
- Wildfire 1/10 Low
- Heat 5/10 Major 7 d/yr ≥100°F today · 15 d/yr by 30 yrs out
- Wind 4/10 Moderate 13% chance of damaging wind over 30 yrs
- Air quality 2/10 Low 1 unhealthy d/yr today · 2 by 30 yrs out
Nearby sold comps map
Loading sold comps map…
Walkable amenities ~0.75 mi
Loading nearby amenities…
Taxation est. · year 1
- Rental income
- $50,400
- − Mortgage interest
- −$29,072
- − Property taxes
- −$8,389
- − Insurance
- −$2,595
- − Repairs & maintenance
- −$4,032
- − Management
- −$4,032
- − Depreciation
- −$15,098
- Taxable loss
- −$12,819
- Est. tax savings @ 24.0%
- +$3,076
- After-tax cash flow
- $-752/yr
For passive investors: Depreciation is non-cash, so a rental often shows a tax loss while cash-flowing — sheltering income. Rental losses are passive: they offset passive income freely, and up to $25,000/yr can offset ordinary (W-2) income if you actively participate and your MAGI is under $100k (phasing out to $0 by $150k); unused losses carry forward. On sale, claimed depreciation is recaptured at up to 25%, and gains may owe capital-gains tax (a 1031 exchange can defer both). Figures are a year-1 estimate at your 24.0% rate — not tax advice; consult a CPA.
Schools (NCES district)
- District
- Marlboro Central School District
- NCES district ID
- 3618570
- Math proficiency
- 43% ▼ -10.00%
- Reading proficiency
- 55% ▲ 8.00%
- Median HH income
- $68,737
- Composite
- 43.7/100
- National rank
- #2953
- State rank
- #366 of 590 in NY
Livability — Marlboro
- Score
- 72/100
- State rank
- #347
- US rank
- #5847
Category grades
Schools grade is shown separately in the Schools card above.
Census & demographics
- Census place
- Marlboro, NY
- Population (ZIP)
- 5,859
Population outlook (Ulster County) Hauer SSP2
- Today (2025)
- 175,887 people
- By 2030
- 171,876 · -2.3%
- By 2040
- 161,771 · -8.0%
- By 2050
- 151,470 · -13.9%
- By 2075
- 133,023 · -24.4%
- By 2100
- 113,504 · -35.5%
Race, ethnicity, and origin ACS 2023
- Neighborhood character
- Predominantly White (74%)
- Race & ethnicity
- White 74% Hispanic / Latino 14% Two or more races 11% Black 5%
- Hispanic origin (detail)
- Mexican 4% Puerto Rican 3% Dominican 2%
- Common ancestry
- Lithuanian 3% Romanian 3% Slovak 2%
- Foreign-born
- 7% · Canada, Jamaica
- Languages at home
- 88% English-only · Spanish 8% Other Indo-European 2% Arabic 1%
Political lean MEDSL · Ulster
- 2024 margin
- D (+18.7) · D 59.3% · R 40.7%
- 2008→2024 swing
- -4.9pp toward R · 2008: 23.6pp · 2024: 18.7pp
- All cycles
- 2024: D+18.7 2020: D+20.9 2016: D+9.1 2012: D+21.9 2008: D+23.6
Not yet ingested
- Civics
- —
Market trends
- HPI YoY
- ▲ 8.97%
- Current HPI
- 325.4749
- Rent YoY
- —
- Metro
- —
- State GDP YoY
- ▲ 2.60%
- F500 in state
- 92
Industry mix (Fortune 500 HQ in NY)
| Industry | F500 HQs | Revenue |
|---|---|---|
| Financial Services | 10 | $950B |
|
||
| Consumer Goods | 9 | $162B |
|
||
| Insurance | 4 | $225B |
|
||
| Telecommunications | 2 | $144B |
|
||
| Pharmaceuticals | 2 | $112B |
|
||
| Media / Entertainment | 2 | $69B |
|
||
Price history
+15.4% since first listed13 events — show timeline
- 2026-04-21 Pending — OneKey® MLS as Distributed by MLS Grid
- 2026-03-23 Listed $519,000 OneKey® MLS as Distributed by MLS Grid
- 2025-01-15 Rental Removed $2,300 ONEKEY
- 2024-12-09 Listed for Rent $2,300 ONEKEY
- 2022-10-27 Listing Removed — OneKey® MLS as Distributed by MLS Grid
- 2022-09-30 Price Changed $444,400 HVCRMLS
- 2022-09-30 Price Changed $444,400 OneKey® MLS as Distributed by MLS Grid
- 2022-09-30 Relisted — HVCRMLS
- 2022-09-26 Contingent — HVCRMLS
- 2022-09-07 Price Changed $449,400 HVCRMLS
- 2022-09-07 Price Changed $449,400 OneKey® MLS as Distributed by MLS Grid
- 2022-08-19 Listed $449,900 OneKey® MLS as Distributed by MLS Grid
- 2022-08-19 Listed $449,900 HVCRMLS
Property tax history
+15.7%/yrLatest (2025): $8,389 · +1.2% YoY. Source: county tax records.
Cash-flow waterfall
monthlySold comps — $/sqft
last 12 mo · ≤1 miLoading sold comps…