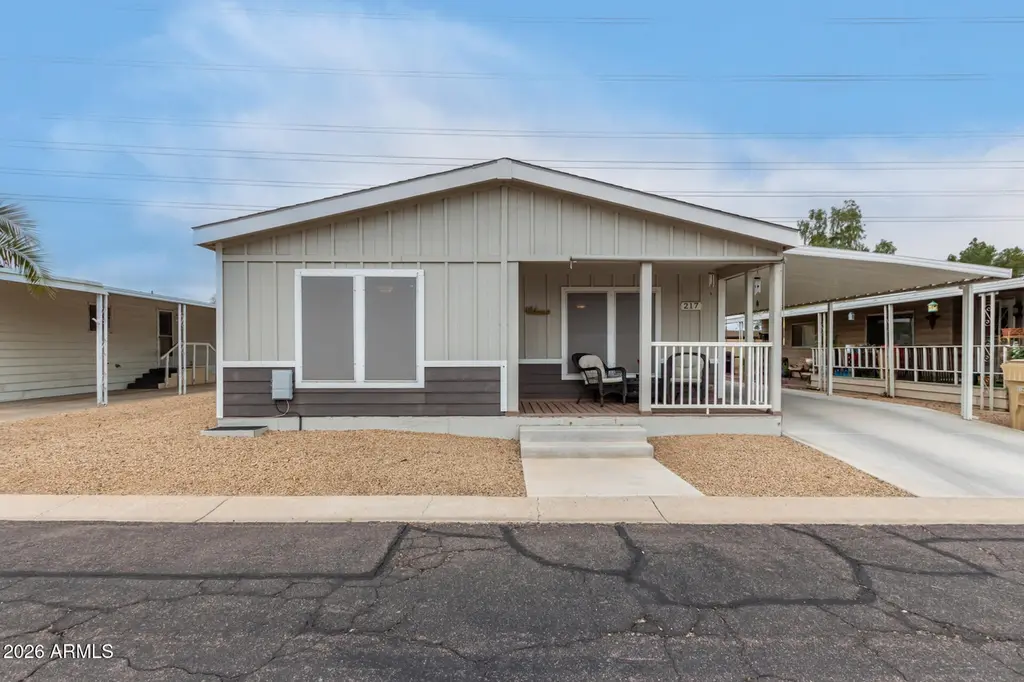
10960 N 67th Ave #217 · Peoria, AZ
Flood risk 1/10 · Minimal
- FEMA flood zone
- X (shaded)
- Chance of flooding over 30 yrs
- 0.0%
- Est. flood insurance / yr
- $507 – $1,088
Fire risk 1/10 · Minimal
- Est. fire insurance / yr
- $610 – $1,132
Heat risk 9/10 · Severe
- Hot days now (above 112°F)
- 6 days/yr
- Hot days in 30 yrs
- 17 days/yr
Wind risk 1/10 · Minimal
- Chance of severe wind over 30 yrs
- —
Air-quality risk 3/10 · Minor
- Unhealthy air days now
- 3 days/yr
- Unhealthy air days in 30 yrs
- 3 days/yr
Risk factors via First Street. Map © Google.
Why this score? — see what drove the B grade
The composite is a weighted blend of 9 inputs, each scored 0–100. Each bar is that input's sub-score; the figure is the points it added to the 100-point composite (weight × sub-score).
- Cash flow +30.0/30.0
- 1% rule +10.0/10.0
- DSCR +10.0/10.0
- ARV discount +7.5/15.0
- Condition / age +4.0/5.0
- Livability +3.8/5.0
- Schools +3.5/10.0
- Rent growth +2.2/5.0
- Appreciation +0.0/10.0
$89,999
🖨 Deal sheet 📄 Offer letter ✓ Due diligence
Listing remarks MLS
Beautiful 2019 home in the gated 55+ Casa del Sol East community! This 2 bedroom with walk in closets, 2 bath residence offers 1,173 sq ft of modern, move-in-ready living space and stands out as one of the newer homes in the neighborhood. The open-concept layout features a spacious kitchen that flows into the living and dining areas, ideal for everyday living and entertaining.
Key facts
- 2 parking spots
- Community pool
- Built 2019
Neighborhood map
What this means for you Summary
Snapshot
- This is a 2-bed/2.0-bath manufactured listed at $90k. Condition is rated good.
Deal economics
- At list price, monthly cash flow is $828 ($10k/yr) — positive.
- The deal already cash-flows at list — no discount required.
- Meets the 1% rule at list price ($2k rent vs $90k).
- Recommended offer: $79k (12.0% below list) — sets the bar for market timing.
- Cap rate 17.3% vs local median 3.3% in Peoria — top-decile yield for the area; either an underpriced asset or a hidden risk that comps aren't pricing in. Stress-test before assuming the spread holds.
Location & tenants
- Location reads 76/100 on livability (#14 in AZ, #3,603 nationally) — a middle-class / working-renter tenant base. Strengths: housing A+, commute A, employment A; Watch: cost of living C-, amenities D, health & safety F.
- Peoria Unified School District (4237) (suburban): math 36% / reading 42% proficiency, ranked #64 of 249 in AZ (top 26%) — families likely to look elsewhere, expect single-tenant / working-renter base with shorter leases.
- Market conditions: Rents soft (-1.3%/yr); 125 active listings in the ZIP; 30 comparable units currently listed for rent nearby; rentals at typical pace (median 25d on market — plan ~3-4 weeks tenant-placement turnaround); solid renter incomes; 36,011 units permitted in Maricopa County in 2024 (12,801 in 5+ unit buildings).
Forward outlook
- Local home prices are declining (-3.0%/yr); year-one equity from $622 of loan paydown is wiped out by about $3k of value loss. Plan a longer hold.
- Maricopa County population projected at +38% by 2050 — long-run rental-demand tailwind backs the buy-and-hold thesis.
- At projected returns (-3.0% appreciation + 0.0% rent growth), your $25k cash investment doubles in ~4 years — after that, you're playing with house money.
Negotiation context
- It's been on market 160 days — a 12% lower offer ($79k) is reasonable based on typical stale-listing flexibility.
- 2 sale attempts since 3y ago; this cycle's ask has dropped $10k (10%) from the opening price — seller is motivated, your offer sets the floor, not the list.
Risks & watch-outs
- Climate carrying-cost: extreme-heat days projected 6→17/yr by 2055 (HVAC capex compounding) — expect insurance premiums to compound above CPI over the hold.
Questions for the listing agent
- It's been on market 160 days. Have you received any prior offers? Is the seller open to a 12% concession, seller financing, or rate buy-down credit?
- Why hasn't it sold? Are there any deal-killer items the seller is aware of (foundation, flood, title, zoning, code violations)?
- Is there a deadline driving the sale (1031 exchange, divorce, estate, relocation)? That informs how much negotiation room exists.
- Schools are B-rated — typically a magnet for longer-tenancy family renters. What's the average tenant stay here, and is there a school-zone premium baked into asking?
- What's the average days-on-market for RENTAL listings here right now (not sales)? A rising rental-DOM trend means longer vacancies and softer asking-rent achievability than the comps imply.
- What's the recent tenant-quality profile in this submarket — average credit score on applications, eviction rate, late-payment / NSF rate, and stable-employment percentage? A property-management company in the area should have these aggregated.
- How much new for-sale + rental construction is in the pipeline within 1–3 miles? Heavy new supply typically softens prices + rents 12–24 months out; constrained supply supports both.
Investment metrics
- 1% rule
- 2.04% ✓
- Cap rate
- 17.34%
- Cash-on-cash
- 39.44%
- DSCR
- 2.76
- GRM
- 4.1
CMA / ARV
- ARV (median comp)
- $50,558
- List price
- $89,999
- Delta
- 78.01%
- Verdict
- OVERPRICED
- Comps
- 20 within 1.0 mi
Show comp detail 12 sales within ~0.75 mi
| Address | Dist | Beds/Ba | Sqft | Sold | Price | $/sf | Match |
|---|---|---|---|---|---|---|---|
| 10960 N 67th Ave #227 | 0.01mi | 2/2.0 | 1,150 (-2%) | 11mo | $72,000 | $63 | 87 |
| 10960 N 67th Ave #180 | 0.01mi | 2/2.0 | 1,152 (-2%) | 12mo | $50,000 | $43 | 87 |
| 10960 N 67th Ave #202 | 0.00mi | 2/2.0 | 1,248 (+6%) | 4mo | $57,500 | $46 | 86 |
| 10960 N 67th Ave #72 | 0.01mi | 2/2.0 | 1,096 (-7%) | 11mo | $41,000 | $37 | 79 |
| 6960 W Peoria Ave #59 | 0.31mi | 2/2.0 | 1,188 (+1%) | 7mo | $74,000 | $62 | 78 |
| 10960 N 67 Ave #117 | 0.00mi | 2/2.0 | 1,260 (+7%) | 12mo | $65,000 | $52 | 77 |
| 10960 N 67th Ave #223 | 0.01mi | 2/2.0 | 1,056 (-10%) | 10mo | $66,000 | $63 | 74 |
| 6960 W Peoria Ave #166 | 0.43mi | 2/2.0 | 1,152 (-2%) | 4mo | $72,000 | $63 | 74 |
| 10960 N 67th Ave #39 | 0.00mi | 2/2.0 | 1,344 (+15%) | 6mo | $95,000 | $71 | 71 |
| 6960 W Peoria Ave #181 | 0.33mi | 2/2.0 | 1,056 (-10%) | 2mo | $77,000 | $73 | 67 |
| 6960 W Peoria Ave #183 | 0.42mi | 2/2.0 | 1,248 (+6%) | 7mo | $36,000 | $29 | 64 |
| 6960 W Peoria Ave #168 | 0.31mi | 2/2.0 | 1,056 (-10%) | 13mo | $57,000 | $54 | 58 |
Match score weights: distance 35% · size 25% · config 20% · recency 20%. Top-matched comps best support the ARV.
Projected returns pro-forma
-3.0% appreciation · 0.0% rent growth · sell at horizon
- IRR
- 32.3%
- Equity multiple
- 2.30×
- Total profit
- $32,820
- Equity at exit
- $13,419
- IRR
- 37.7%
- Equity multiple
- 4.01×
- Total profit
- $75,832
- Equity at exit
- $7,781
Cash invested: $25,200 (down + closing). Projections, not guarantees.
Landlord ↔ Tenant lean methodology
- Overall (STATE)
- 87 Strongly Landlord-Friendly
- State Arizona
- 87 Strongly Landlord-Friendly · R+3
- County
- — inherits STATE
- City
- — inherits STATE
ZIP-level market 85304
- Rents YoY
- -1.3%
- Active inventory
- 125
- Price-to-rent
- 4.1×
Monthly cashflow live
- Estimated rent
- $1,836 high interval (Pro) →
- Mortgage (P&I)
- −$472
- Tax est. 1.5%
- −$112 /mo · $1,350/yr
- Insurance
- −$37
- HOA
- −$0
- Vacancy / Maint / Mgmt
- −$386
- Net cashflow
- $828
Break-even live
UW: 25.0% down · 7.5% · 30yr · 1.5% tax · 5.0% vac · 8.0% maint · 8.0% mgmt
Financing live
Cash to close
- Down payment
- $22,500
- Closing costs
- $2,700
- Reserves months
- —
- Total cash needed
- —
Loan-product check · same deal, 3 products live
Conventional
25% down · 7.5% · 30yr
- Down + closing
- —
- Monthly P&I
- —
- Monthly cashflow
- —
- DSCR
- —
- Eligible?
- —
Personal DTI + credit; lowest rate.
DSCR
20% down · 8.5% · 30yr
- Down + closing
- —
- Monthly P&I
- —
- Monthly cashflow
- —
- DSCR
- —
- Eligible?
- —
No personal income docs; deal must DSCR.
Hard money
10% down · 12.0% · 12mo
- Down + closing
- —
- Monthly P&I
- —
- Monthly cashflow
- —
- DSCR
- —
- Eligible?
- —
Short-term bridge; refi at stabilization.
Rent comps 30 comps
| Address | Beds | Baths | Sqft | Rent | $/sqft | DOM | Units | Dist |
|---|---|---|---|---|---|---|---|---|
| 6605 W Mescal St Glendale, AZ | 3.0 | 2.0 | 1369 | $1,895 | $1.38 | 5d | 1 | 0.15mi |
| 6960 W Peoria Ave #90 Peoria, AZ | 2.0 | 1.0 | 704 | $1,320 | $1.88 | 24d | 1 | 0.40mi |
| 10013 N 66th Ln Glendale, AZ | 3.0 | 2.0 | 1063 | $1,999 | $1.88 | 24d | 1 | 0.65mi |
| 6325 W Cheryl Dr Glendale, AZ | 2.0 | 2.0 | 1092 | $2,100 | $1.92 | 24d | 1 | 0.65mi |
| 10654 N 60th Ave Glendale, AZ | 1.0–2.0 | 1.0–2.0 | 732 | $1,475 | $2.01 | 2d | 27 | 0.79mi |
| 7027 W Palo Verde Ave Peoria, AZ | 3.0 | 2.0 | 1500 | $1,999 | $1.33 | 44d | 1 | 1.01mi |
| 6421 W Carol Ave Glendale, AZ | 3.0 | 2.0 | 1243 | $1,799 | $1.45 | 18d | 1 | 1.02mi |
| 9914 N 73rd Ave Peoria, AZ | 3.0 | 1.5 | 1312 | $1,716 | $1.31 | 44d | 1 | 1.03mi |
| 7102 W Palo Verde Ave Peoria, AZ | 3.0 | 2.0 | 1360 | $2,000 | $1.47 | 44d | 1 | 1.03mi |
| 9350 N 67th Ave Unit B1 Glendale, AZ | 2.0 | 1.0 | 842 | $1,070 | $1.27 | 24d | 1 | 1.07mi |
| 9350 N 67th Ave Unit B2 Glendale, AZ | 2.0 | 2.0 | 970 | $1,250 | $1.29 | 44d | 1 | 1.07mi |
| 9350 N 67th Ave Glendale, AZ | 2.0 | 2.0 | 970 | $1,385 | $1.43 | 13d | 1 | 1.08mi |
| 9350 N 67th Ave Glendale, AZ | 2.0 | 2.0 | 970 | $1,429 | $1.47 | 44d | 1 | 1.08mi |
| 11600 N 75th Ave Peoria, AZ | 2.0 | 2.0 | 814 | $1,325 | $1.63 | 2d | 4 | 1.12mi |
| 7102 W Carol Ave Peoria, AZ | 3.0 | 2.0 | 1288 | $1,970 | $1.53 | 5d | 1 | 1.12mi |
| 9160 N 67th Ave Peoria, AZ | 2.0 | 2.0 | 1100 | $2,065 | $1.88 | 44d | 6 | 1.18mi |
| 9160 N 67th Ave Unit 212 Peoria, AZ | 2.0 | 2.0 | 992 | $1,680 | $1.69 | 24d | 1 | 1.18mi |
| 11807 N 76th Ave Peoria, AZ | 3.0 | 2.0 | 1228 | $1,995 | $1.62 | 44d | 1 | 1.20mi |
| 9121 N 68th Ave Peoria, AZ | 2.0 | 2.0 | 1126 | $1,699 | $1.51 | 44d | 1 | 1.20mi |
| 7040 W Olive Ave #12 Peoria, AZ | 2.0 | 2.0 | 900 | $1,445 | $1.61 | 24d | 1 | 1.23mi |
| 11851 N 76th Dr Peoria, AZ | 3.0 | 2.0 | 1266 | $1,899 | $1.50 | 5d | 1 | 1.27mi |
| 9022 N 63rd Dr Glendale, AZ | 3.0 | 2.0 | 1401 | $2,195 | $1.57 | 13d | 1 | 1.28mi |
| 7040 W Olive Ave Peoria, AZ | 2.0 | 2.0 | 953 | $1,465 | $1.54 | 5d | 1 | 1.34mi |
| 5625 W Sunnyside Dr Glendale, AZ | 3.0 | 2.0 | 1192 | $1,850 | $1.55 | 5d | 1 | 1.38mi |
| 8938 N 64th Ln Glendale, AZ | 3.0 | 2.0 | 1256 | $2,095 | $1.67 | 1d | 1 | 1.39mi |
| 6201 W Olive Ave Unit B1 Glendale, AZ | 2.0 | 1.0 | 759 | $1,225 | $1.61 | 1d | 1 | 1.43mi |
| 9903 N 77th Ave Peoria, AZ | 3.0 | 2.0 | 1446 | $1,895 | $1.31 | 4d | 1 | 1.43mi |
| 5648 W Mountain View Rd Glendale, AZ | 3.0 | 2.0 | 1380 | $2,095 | $1.52 | 13d | 1 | 1.46mi |
| 9205 N 59th Ave Unit 108 Glendale, AZ | 2.0 | 2.0 | 1238 | $1,600 | $1.29 | 44d | 1 | 1.47mi |
| 6201 W Olive Ave Glendale, AZ | 2.0 | 1.0 | 759 | $1,445 | $1.90 | 22d | 1 | 1.49mi |
Listing history 23 events
-
2026-06-18days on market $89,999 Active 160 DOM
-
2026-06-17days on market $89,999 Active 159 DOM
-
2026-06-16days on market $89,999 Active 158 DOM
-
2026-06-15days on market $89,999 Active 157 DOM
-
2026-06-13days on market $89,999 Active 155 DOM
-
2026-06-13days on market $89,999 Active 154 DOM
-
2026-06-09days on market $89,999 Active 151 DOM
-
2026-06-08days on market $89,999 Active 150 DOM
-
2026-06-07days on market $89,999 Active 149 DOM
-
2026-06-04days on market $89,999 Active 146 DOM
-
2026-06-03days on market $89,999 Active 145 DOM
-
2026-06-02days on market $89,999 Active 144 DOM
-
2026-06-01days on market $89,999 Active 143 DOM
-
2026-05-31days on market $89,999 Active 142 DOM
-
2026-03-24price $89,999 379-char remark
Show marketing remark (379 chars)
Beautiful 2019 home in the gated 55+ Casa del Sol East community! This 2 bedroom with walk in closets, 2 bath residence offers 1,173 sq ft of modern, move-in-ready living space and stands out as one of the newer homes in the neighborhood. The open-concept layout features a spacious kitchen that flows into the living and dining areas, ideal for everyday living and entertaining.
-
2026-02-04price $97,500 379-char remark
Show marketing remark (379 chars)
Beautiful 2019 home in the gated 55+ Casa del Sol East community! This 2 bedroom with walk in closets, 2 bath residence offers 1,173 sq ft of modern, move-in-ready living space and stands out as one of the newer homes in the neighborhood. The open-concept layout features a spacious kitchen that flows into the living and dining areas, ideal for everyday living and entertaining.
-
2026-01-09$99,999 Active 379-char remark
Show marketing remark (379 chars)
Beautiful 2019 home in the gated 55+ Casa del Sol East community! This 2 bedroom with walk in closets, 2 bath residence offers 1,173 sq ft of modern, move-in-ready living space and stands out as one of the newer homes in the neighborhood. The open-concept layout features a spacious kitchen that flows into the living and dining areas, ideal for everyday living and entertaining.
-
2024-07-08historical
-
2024-04-29price $121,990
-
2024-04-04price $124,990
-
2024-02-11price $129,990
-
2023-11-08price $133,990
-
2023-10-27$134,990 Active
ⓘ Source: listings_history table (triggers on properties + properties_extension) + one-shot
backfill from property_details.listing_events for pre-trigger history.
Climate risk First Street
- Flood 1/10 Low FEMA zone X (shaded) · 0% chance over 30 yrs
- Wildfire 1/10 Low
- Heat 9/10 Extreme 6 d/yr ≥112°F today · 17 d/yr by 30 yrs out
- Wind 1/10 Low
- Air quality 3/10 Moderate 3 unhealthy d/yr today · 3 by 30 yrs out
Nearby sold comps map
Loading sold comps map…
Walkable amenities ~0.75 mi
Loading nearby amenities…
Taxation est. · year 1
- Rental income
- $22,030
- − Mortgage interest
- −$5,041
- − Property taxes
- −$1,350
- − Insurance
- −$450
- − Repairs & maintenance
- −$1,762
- − Management
- −$1,762
- − Depreciation
- −$2,618
- Taxable income
- $9,045
- Est. tax owed @ 24.0%
- −$2,171
- After-tax cash flow
- $7,769/yr
For passive investors: Depreciation is non-cash, so a rental often shows a tax loss while cash-flowing — sheltering income. Rental losses are passive: they offset passive income freely, and up to $25,000/yr can offset ordinary (W-2) income if you actively participate and your MAGI is under $100k (phasing out to $0 by $150k); unused losses carry forward. On sale, claimed depreciation is recaptured at up to 25%, and gains may owe capital-gains tax (a 1031 exchange can defer both). Figures are a year-1 estimate at your 24.0% rate — not tax advice; consult a CPA.
Condition & rehab AI · 12 photos
This 2019 manufactured home in Casa del Sol East is in good condition with modern appliances and a clean exterior. It offers a good investment opportunity with minor updates that can significantly increase its value.
Value-add opportunities
- Both Paint interior walls — Fresh paint can make a home more appealing and increase its value
- Both Replace window treatments — New window treatments can enhance curb appeal and interior aesthetics
- Both Install smart home devices — Smart home devices can increase convenience and add value
- Both Upgrade flooring in living areas — Upgrading flooring can enhance the home's appearance and increase its value
Renovation cost estimate screening
Value-add ROI direction
- Both Paint interior walls — Fresh paint can make a home more appealing and increase its value ↑
- Both Replace window treatments — New window treatments can enhance curb appeal and interior aesthetics ↑
- Both Install smart home devices — Smart home devices can increase convenience and add value ↑
- Both Upgrade flooring in living areas — Upgrading flooring can enhance the home's appearance and increase its value ↑
ⓘ Cost ranges are severity-bucket heuristics (US national rule-of-thumb). Get contractor quotes + a written scope before underwriting a rehab budget.
Schools (NCES district)
- District
- Peoria Unified School District (4237)
- NCES district ID
- 0406250
- Math proficiency
- 36% ▼ -14.00%
- Reading proficiency
- 42% ▼ -8.00%
- Median HH income
- $60,171
- Composite
- 34.62/100
- National rank
- #5152
- State rank
- #64 of 249 in AZ
Livability — Peoria
- Score
- 76/100
- State rank
- #14
- US rank
- #3603
Category grades
Schools grade is shown separately in the Schools card above.
Census & demographics
- Census place
- Peoria, AZ
- County
- Maricopa County · 4,537,380 people
- City population
- 206,687
- Metro
- Phoenix-Mesa-Chandler, AZ
- Population (ZIP)
- 29,861
- Household income
- $86,927
- Rent vs Own
- Severe rent burden
- 640.0
Population outlook (Maricopa County) Hauer SSP2
- Today (2025)
- 4,979,203 people
- By 2030
- 5,378,229 · +8.0%
- By 2040
- 6,156,598 · +23.6%
- By 2050
- 6,872,376 · +38.0%
- By 2075
- 8,401,270 · +68.7%
- By 2100
- 9,247,439 · +85.7%
Race, ethnicity, and origin ACS 2023
- Neighborhood character
- Majority White (61%)
- Race & ethnicity
- White 61% Hispanic / Latino 30% Two or more races 16% Black 2% Asian 2% Native American 2%
- Hispanic origin (detail)
- Mexican 24%
- Common ancestry
- Lithuanian 3% Romanian 2% Portuguese 2%
- Foreign-born
- 7% · Canada, Vietnam, China
- Languages at home
- 83% English-only · Spanish 14% Other Indo-European 1% Vietnamese 1%
Political lean MEDSL · Maricopa
- 2024 margin
- Toss-up / Even · D 47.7% · R 51.2% · Other 1.1%
- 2008→2024 swing
- +7.1pp toward D · 2008: -10.6pp · 2024: -3.5pp
- All cycles
- 2024: R+3.5 2020: D+2.2 2016: R+3.5 2012: R+12.0 2008: R+10.6
Not yet ingested
- Civics
- —
Market trends
- HPI YoY
- ▼ -259.68%
- Current HPI
- 310.0679
- Rent YoY
- ▼ -1.30%
- Metro
- Phoenix-Mesa-Chandler, AZ
- State GDP YoY
- ▲ 4.54%
- F500 in state
- 20
Industry mix (Fortune 500 HQ in AZ)
| Industry | F500 HQs | Revenue |
|---|---|---|
| Technology | 2 | $13B |
|
||
| Mining / Metals | 1 | $23B |
|
||
| Environmental Services | 1 | $16B |
|
||
| Metals / Steel | 1 | $14B |
|
||
| Technology Distribution | 1 | $9B |
|
||
| Homebuilding | 1 | $8B |
|
||
Price history
-33.3% since first listed9 events — show timeline
- 2026-03-24 Price Changed $89,999 ARMLS
- 2026-02-04 Price Changed $97,500 ARMLS
- 2026-01-09 Listed $99,999 ARMLS
- 2024-07-08 Listing Removed — ARMLS
- 2024-04-29 Price Changed $121,990 ARMLS
- 2024-04-04 Price Changed $124,990 ARMLS
- 2024-02-11 Price Changed $129,990 ARMLS
- 2023-11-08 Price Changed $133,990 ARMLS
- 2023-10-27 Listed $134,990 ARMLS
Cash-flow waterfall
monthlySold comps — $/sqft
last 12 mo · ≤1 miLoading sold comps…