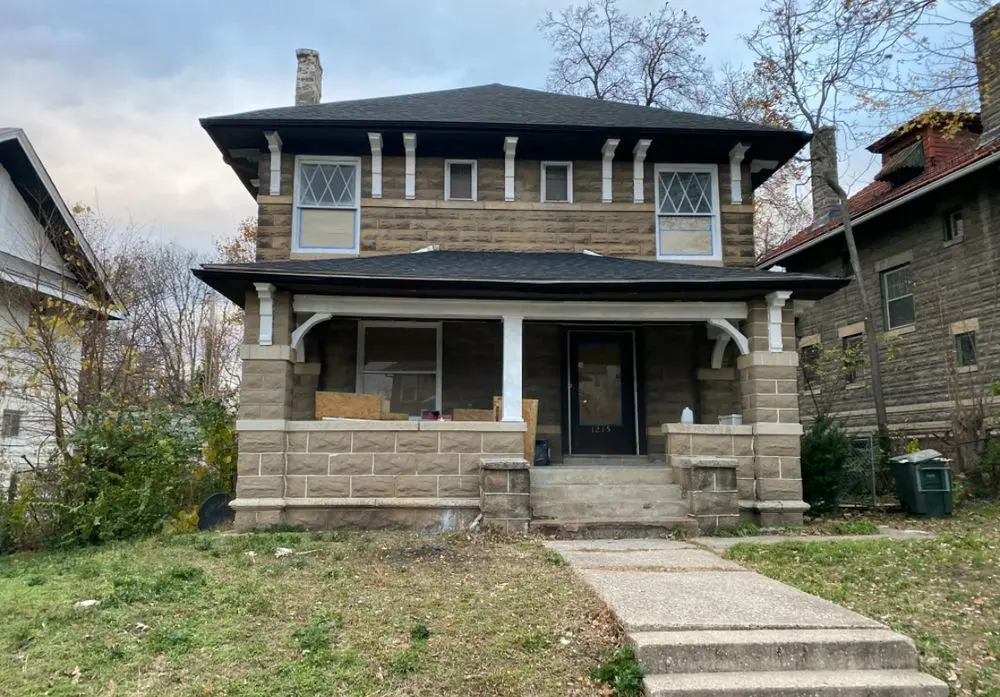
1215 Oakley Pl · St. Louis, MO
Flood risk 1/10 · Minimal
- FEMA flood zone
- X (unshaded)
- Chance of flooding over 30 yrs
- 0.0%
- Est. flood insurance / yr
- $473 – $860
Fire risk 1/10 · Minimal
- Est. fire insurance / yr
- $1,054 – $1,958
Heat risk 5/10 · Moderate
- Hot days now (above 107°F)
- 7 days/yr
- Hot days in 30 yrs
- 21 days/yr
Wind risk 2/10 · Minimal
- Chance of severe wind over 30 yrs
- 1.0%
Air-quality risk 4/10 · Minor
- Unhealthy air days now
- 4 days/yr
- Unhealthy air days in 30 yrs
- 5 days/yr
Risk factors via First Street. Map © Google.
Why this score? — see what drove the B- grade
The composite is a weighted blend of 9 inputs, each scored 0–100. Each bar is that input's sub-score; the figure is the points it added to the 100-point composite (weight × sub-score).
- Cash flow +30.0/30.0
- 1% rule +10.0/10.0
- DSCR +10.0/10.0
- ARV discount +7.5/15.0
- Rent growth +3.1/5.0
- Livability +2.5/5.0
- Condition / age +2.5/5.0
- Schools +1.2/10.0
- Appreciation +0.0/10.0
$90,000
🖨 Deal sheet 📄 Offer letter ✓ Due diligence
Listing remarks MLS
Stunning Historic Home with Modern Touches in St. Louis! Welcome to this charming 4-bedroom home, a beautiful blend of historic character and modern convenience. Built in 1909, this gem is proudly listed on the National Register of Historic Places, ensuring its timeless appeal. Key Features: 4 Spacious Bedrooms: Perfect for families or guests. 1 Full & 1 Half Bathroom: Recently updated with new fixtures and finishes. Large Kitchen: Featuring a stylish island, new cabinets, and modern ceramic tile. Oversized Dining Room: Ideal for family gatherings and entertaining. Expansive Living Room: A cozy space with two elegant electric fireplaces. Full Basement: Offers endless possibilities for storage or additional living space. Generous Backyard: Perfect for outdoor activities and relaxation. Recent Renovations: This home boasts approximately 90-95% completed renovations, including: New Electric Panel & Updated Wiring New Water and Drain Lines Finished Attic Space: Transformed into livable space. New Roof: Ensuring peace of mind for years to come. Epoxy Floors: Beautifully finished in the kitchen and bathrooms. Brand New Bathtub, Toilets, and Vanities New Windows: Original front windows preserved for historical integrity. Waterproofed Basement Walls: Enhanced durability and protection. Investment Opportunity: After Repair Value (ARV): $225,000 Estimated Renovation Costs: Approximately $15,000 to complete the remaining updates. Opportunities for Personal Touch: While this home is nearly move-in ready, a few minor updates will complete the picture: New air condenser unit needed Approximately 10 linear feet of gutters and a new downspout on one side About 20 linear feet of soffits to be repaired Some tuck-pointing for added structural integrity Door knobs are provided and just need installation A panel for the kitchen island and addressing a small gap on the third floor Don't miss your chance to own this exquisite home that beautifully marries historic charm with modern living. Schedule a showing today and envision your future in this St. Louis treasure!
Key facts
- New kitchen
- New baths
- Stone construction
Tags
Neighborhood map
What this means for you Summary
Snapshot
- This is a 4-bed/1.0-bath single-family listed at $90k.
Deal economics
- At list price, monthly cash flow is $1k ($14k/yr) — positive.
- The deal already cash-flows at list — no discount required.
- Meets the 1% rule at list price ($2k rent vs $90k).
- Recommended offer: $89k (1.5% below list) — sets the bar for market timing.
- Cap rate 22.0% vs local median 5.0% in St. Louis — top-decile yield for the area; either an underpriced asset or a hidden risk that comps aren't pricing in. Stress-test before assuming the spread holds.
Location & tenants
- Location reads: area grade B — affects rentability + tenant quality, not the cash-flow math above.
- St. Louis City (urban): math 10% / reading 18% proficiency, ranked #312 of 324 in MO (top 96%) — low school quality limits family demand, transient renter base, plan for 1-2y turnover; 80% free/reduced lunch — lower-income household profile, screen leases tightly.
- Market conditions: Rents rising (+2.4%/yr); 118 active listings in the ZIP; 21 comparable units currently listed for rent nearby; rentals at typical pace (median 18d on market — plan ~3-4 weeks tenant-placement turnaround); 294 units permitted in St. Louis city in 2024 (227 in 5+ unit buildings).
- At $2,198/mo this rent would consume 58% of the median local household income ($46k/yr) (locally 1457% of renters already pay >50% of income on rent) — very limited rent-growth headroom before tenants either downsize or default.
Forward outlook
- Local home prices are declining (-3.0%/yr); year-one equity from $622 of loan paydown is wiped out by about $3k of value loss. Plan a longer hold.
- St. Louis County population projected to shrink 6% by 2050 — rents likely to lag national; underwrite the cash flow, not the appreciation.
- At projected returns (-3.0% appreciation + 2.4% rent growth), your $25k cash investment doubles in ~3 years — after that, you're playing with house money.
Negotiation context
- It's been on market 29 days — a 2% lower offer ($89k) is reasonable based on typical stale-listing flexibility.
- 5 sale attempts since 15y ago; this cycle's ask has dropped $35k (28%) from the opening price — seller is motivated, your offer sets the floor, not the list.
Risks & watch-outs
- Watch-outs: built in 1906 — expect roof / HVAC / electrical / plumbing capex.
- Climate carrying-cost: extreme-heat days projected 7→21/yr by 2055 (HVAC capex compounding) — expect insurance premiums to compound above CPI over the hold.
Questions for the listing agent
- Built in 1906 — when were the roof, HVAC, electrical panel, plumbing, and water heater last replaced?
- Is there a deadline driving the sale (1031 exchange, divorce, estate, relocation)? That informs how much negotiation room exists.
- What's the average days-on-market for RENTAL listings here right now (not sales)? A rising rental-DOM trend means longer vacancies and softer asking-rent achievability than the comps imply.
- What's the recent tenant-quality profile in this submarket — average credit score on applications, eviction rate, late-payment / NSF rate, and stable-employment percentage? A property-management company in the area should have these aggregated.
- How much new for-sale + rental construction is in the pipeline within 1–3 miles? Heavy new supply typically softens prices + rents 12–24 months out; constrained supply supports both.
Investment metrics
- 1% rule
- 2.44% ✓
- Cap rate
- 21.98%
- Cash-on-cash
- 56.01%
- DSCR
- 3.49
- GRM
- 3.4
CMA / ARV
- ARV (median comp)
- $451,218
- List price
- $90,000
- Delta
- -63.68%
- Verdict
- UNDERPRICED
- Comps
- 20 within 2.0 mi
Show comp detail 12 sales within ~0.75 mi
| Address | Dist | Beds/Ba | Sqft | Sold | Price | $/sf | Match |
|---|---|---|---|---|---|---|---|
| 938 Catalpa St | 0.46mi | 4/2.0 | 1,820 (-5%) | 4mo | $199,900 | $110 | 62 |
| 6018 Horton Pl | 0.35mi | 5/1.5 (+1) | 2,105 (+10%) | 9mo | $210,000 | $100 | 53 |
| 5929 Cates Ave | 0.57mi | 5/1.5 (+1) | 1,980 (+3%) | 11mo | $100,000 | $51 | 52 |
| 1237 Eskridge Ln | 0.73mi | 4/2.5 | 1,905 (-1%) | 9mo | $299,000 | $157 | 51 |
| 5714 Maple Ave | 0.48mi | 3/2.5 (-1) | 2,036 (+6%) | 8mo | $104,500 | $51 | 49 |
| 1441 Temple Pl | 0.61mi | 5/2.0 (+1) | 1,980 (+3%) | 11mo | $7,000 | $4 | 48 |
| 5853 Clemens Ave | 0.65mi | 3/3.0 (-1) | 1,948 (+2%) | 10mo | $299,900 | $154 | 46 |
| 5941 Romaine Pl | 0.36mi | 4/2.0 | 2,160 (+12%) | 17mo | $39,900 | $18 | 44 |
| 8 Cabanne Townhome Dr | 0.55mi | 3/2.5 (-1) | 2,040 (+6%) | 18mo | $229,900 | $113 | 38 |
| 6140 Minerva Ave | 0.40mi | 3/2.5 (-1) | 1,678 (-13%) | 14mo | $174,900 | $104 | 38 |
| 5730 Clemens Ave | 0.74mi | 3/2.5 (-1) | 1,784 (-7%) | 18mo | $325,000 | $182 | 28 |
| 5911 Enright Ave | 0.73mi | 5/3.5 (+1) | 2,106 (+10%) | 14mo | $399,900 | $190 | 23 |
Match score weights: distance 35% · size 25% · config 20% · recency 20%. Top-matched comps best support the ARV.
Projected returns pro-forma
-3.0% appreciation · 2.39% rent growth · sell at horizon
- IRR
- 53.7%
- Equity multiple
- 3.34×
- Total profit
- $58,984
- Equity at exit
- $13,419
- IRR
- 58.6%
- Equity multiple
- 6.65×
- Total profit
- $142,370
- Equity at exit
- $7,782
Cash invested: $25,200 (down + closing). Projections, not guarantees.
Landlord ↔ Tenant lean methodology
- Overall (STATE)
- 81 Strongly Landlord-Friendly
- State Missouri
- 81 Strongly Landlord-Friendly · R+10
- County
- — inherits STATE
- City
- — inherits STATE
ZIP-level market 63112
- Rents YoY
- 2.4%
- Active inventory
- 118
- Price-to-rent
- 3.4×
Monthly cashflow live
- Estimated rent
- $2,198 high interval (Pro) →
- Mortgage (P&I)
- −$472
- Tax from tax record
- −$51 /mo · $611/yr
- Insurance
- −$38
- HOA
- −$0
- Vacancy / Maint / Mgmt
- −$462
- Net cashflow
- $1,176
Break-even live
UW: 25.0% down · 7.5% · 30yr · 1.5% tax · 5.0% vac · 8.0% maint · 8.0% mgmt
Financing live
Cash to close
- Down payment
- $22,500
- Closing costs
- $2,700
- Reserves months
- —
- Total cash needed
- —
Loan-product check · same deal, 3 products live
Conventional
25% down · 7.5% · 30yr
- Down + closing
- —
- Monthly P&I
- —
- Monthly cashflow
- —
- DSCR
- —
- Eligible?
- —
Personal DTI + credit; lowest rate.
DSCR
20% down · 8.5% · 30yr
- Down + closing
- —
- Monthly P&I
- —
- Monthly cashflow
- —
- DSCR
- —
- Eligible?
- —
No personal income docs; deal must DSCR.
Hard money
10% down · 12.0% · 12mo
- Down + closing
- —
- Monthly P&I
- —
- Monthly cashflow
- —
- DSCR
- —
- Eligible?
- —
Short-term bridge; refi at stabilization.
Rent comps 21 comps
| Address | Beds | Baths | Sqft | Rent | $/sqft | DOM | Units | Dist |
|---|---|---|---|---|---|---|---|---|
| 1019 N Skinker Pkwy St. Louis, MO | 1.0–3.0 | 1.0–3.0 | 1137 | $2,795 | $2.46 | 1d | 9 | 0.48mi |
| 5804 Cates Ave Unit 2 St. Louis, MO | 3.0 | 1.0 | 1500 | $1,500 | $1.00 | 4d | 1 | 0.67mi |
| 5760 Theodosia Ave Saint Louis, MO | 3.0 | 1.5 | 1702 | $1,420 | $0.83 | 23d | 1 | 0.67mi |
| 6274 Cates Ave Saint Louis, MO | 3.0 | 2.0 | 1400 | $2,295 | $1.64 | 43d | 1 | 0.89mi |
| 6105 Delmar Blvd Saint Louis, MO | 1.0–3.0 | 1.0–3.0 | 931 | $2,610 | $2.80 | 4d | 1 | 0.90mi |
| 5345 Wells Ave Saint Louis, MO | 3.0 | 1.0 | 2254 | $1,295 | $0.57 | 43d | 1 | 1.02mi |
| 6009 Kingsbury Ave Saint Louis, MO | 3.0 | 1.0 | 1368 | $2,000 | $1.46 | 4d | 1 | 1.05mi |
| 716 Westgate Ave Unit 3 University City, MO | 3.0 | 2.0 | 1500 | $2,995 | $2.00 | 43d | 1 | 1.05mi |
| 6017 Kingsbury Ave Unit 2f St. Louis, MO | 4.0 | 1.0 | 1500 | $3,250 | $2.17 | 17d | 1 | 1.05mi |
| 6017 Kingsbury Ave Unit 1F St. Louis, MO | 3.0 | 1.0 | 1600 | $2,700 | $1.69 | 17d | 1 | 1.05mi |
| 6409 Enright Ave University City, MO | 3.0 | 1.5 | 1320 | $2,420 | $1.83 | 1d | 2 | 1.06mi |
| 5783 McPherson Ave Unit 2FL St. Louis, MO | 3.0 | 2.0 | 1320 | $2,550 | $1.93 | 7d | 1 | 1.08mi |
| 5861 Nina Pl Apt 2W St. Louis, MO | 3.0 | 1.0 | 1400 | $1,750 | $1.25 | 43d | 1 | 1.11mi |
| 5861 Nina Pl Unit 3W St. Louis, MO | 3.0 | 1.0 | 1550 | $1,750 | $1.13 | 17d | 1 | 1.11mi |
| 5920 McPherson Ave Unit 1st Floor St. Louis, MO | 3.0 | 1.0 | 1300 | $2,550 | $1.96 | 43d | 1 | 1.13mi |
| 5333 Patton Ave St. Louis, MO | 3.0 | 1.5 | 1262 | $1,250 | $0.99 | 43d | 1 | 1.17mi |
| 5096 Minerva Ave Unit C St. Louis, MO | 3.0 | 1.0 | 1800 | $1,395 | $0.78 | 43d | 1 | 1.31mi |
| 6913 Etzel Ave Unit 1496954P University City, MO | 3.0 | 2.0 | 1399 | $5,767 | $4.12 | 7d | 1 | 1.35mi |
| 321 Belt Ave St. Louis, MO | 3.0 | 2.0 | 1549 | $2,300 | $1.48 | 4d | 1 | 1.39mi |
| 6936 Melrose Ave Saint Louis, MO | 4.0 | 2.0 | 1396 | $1,858 | $1.33 | 23d | 1 | 1.39mi |
| 5394 Pershing Ave Saint Louis, MO | 3.0 | 2.0 | 1500 | $2,595 | $1.73 | 43d | 1 | 1.45mi |
Listing history 23 events
-
2026-06-18days on market $90,000 Active 29 DOM
-
2026-06-17days on market $90,000 Active 28 DOM
-
2026-06-16days on market $90,000 Active 27 DOM
-
2026-06-15days on market $90,000 Active 26 DOM
-
2026-06-13days on market $90,000 Active 24 DOM
-
2026-06-09days on market $90,000 Active 20 DOM
-
2026-06-08days on market $90,000 Active 19 DOM
-
2026-06-07days on market $90,000 Active 18 DOM
-
2026-06-05days on market $90,000 Active 15 DOM
-
2026-06-03days on market $90,000 Active 14 DOM
-
2026-06-02days on market $90,000 Active 13 DOM
-
2026-06-01days on market $90,000 Active 12 DOM
-
2026-05-31days on market $90,000 Active 11 DOM
-
2026-03-23historical Active Under Contract
-
2026-03-11$125,000 Active
-
2025-11-05$163,900 Active 2093-char remark
Show marketing remark (2093 chars)
Stunning Historic Home with Modern Touches in St. Louis! Welcome to this charming 4-bedroom home, a beautiful blend of historic character and modern convenience. Built in 1909, this gem is proudly listed on the National Register of Historic Places, ensuring its timeless appeal. Key Features: 4 Spacious Bedrooms: Perfect for families or guests. 1 Full & 1 Half Bathroom: Recently updated with new fixtures and finishes. Large Kitchen: Featuring a stylish island, new cabinets, and modern ceramic tile. Oversized Dining Room: Ideal for family gatherings and entertaining. Expansive Living Room: A cozy space with two elegant electric fireplaces. Full Basement: Offers endless possibilities for storage or additional living space. Generous Backyard: Perfect for outdoor activities and relaxation. Recent Renovations: This home boasts approximately 90-95% completed renovations, including: New Electric Panel & Updated Wiring New Water and Drain Lines Finished Attic Space: Transformed into livable space. New Roof: Ensuring peace of mind for years to come. Epoxy Floors: Beautifully finished in the kitchen and bathrooms. Brand New Bathtub, Toilets, and Vanities New Windows: Original front windows preserved for historical integrity. Waterproofed Basement Walls: Enhanced durability and protection. Investment Opportunity: After Repair Value (ARV): $225,000 Estimated Renovation Costs: Approximately $15,000 to complete the remaining updates. Opportunities for Personal Touch: While this home is nearly move-in ready, a few minor updates will complete the picture: New air condenser unit needed Approximately 10 linear feet of gutters and a new downspout on one side About 20 linear feet of soffits to be repaired Some tuck-pointing for added structural integrity Door knobs are provided and just need installation A panel for the kitchen island and addressing a small gap on the third floor Don't miss your chance to own this exquisite home that beautifully marries historic charm with modern living. Schedule a showing today and envision your future in this St. Louis treasure!
-
2025-07-21status Active
-
2025-07-21price $165,000
-
2025-06-25price $174,900
-
2025-05-29$180,000 Active
-
2012-01-20soldstatus
-
2011-08-02$7,500
-
2002-02-21soldstatus
ⓘ Source: listings_history table (triggers on properties + properties_extension) + one-shot
backfill from property_details.listing_events for pre-trigger history.
Tax reassessment forecast MO · Resets to sale price
- Current annual tax
- $611 · $51/mo
- Projected year-2 tax
- $873 · $73/mo
- Expected delta
- +$262/yr (+$22/mo · 43.0%)
ⓘ Screening estimate from a state-policy table — verify with the county assessor before closing.
Climate risk First Street
- Flood 1/10 Low FEMA zone X (unshaded) · 0% chance over 30 yrs
- Wildfire 1/10 Low
- Heat 5/10 Major 7 d/yr ≥107°F today · 21 d/yr by 30 yrs out
- Wind 2/10 Low 100% chance of damaging wind over 30 yrs
- Air quality 4/10 Moderate 4 unhealthy d/yr today · 5 by 30 yrs out
Nearby sold comps map
Loading sold comps map…
Walkable amenities ~0.75 mi
Loading nearby amenities…
Taxation est. · year 1
- Rental income
- $26,378
- − Mortgage interest
- −$5,041
- − Property taxes
- −$611
- − Insurance
- −$450
- − Repairs & maintenance
- −$2,110
- − Management
- −$2,110
- − Depreciation
- −$2,618
- Taxable income
- $13,437
- Est. tax owed @ 24.0%
- −$3,225
- After-tax cash flow
- $10,890/yr
For passive investors: Depreciation is non-cash, so a rental often shows a tax loss while cash-flowing — sheltering income. Rental losses are passive: they offset passive income freely, and up to $25,000/yr can offset ordinary (W-2) income if you actively participate and your MAGI is under $100k (phasing out to $0 by $150k); unused losses carry forward. On sale, claimed depreciation is recaptured at up to 25%, and gains may owe capital-gains tax (a 1031 exchange can defer both). Figures are a year-1 estimate at your 24.0% rate — not tax advice; consult a CPA.
Schools (NCES district)
- District
- St. Louis City
- NCES district ID
- 2929280
- Math proficiency
- 10% ▼ -6.00%
- Reading proficiency
- 18% ▼ -3.00%
- Median HH income
- $35,685
- Composite
- 11.54/100
- National rank
- #9699
- State rank
- #312 of 324 in MO
Livability — St. Louis
No livability data for this city. (Only ~50 U.S. cities are tracked.)
Census & demographics
- Census place
- St. Louis, MO
- County
- Saint Louis City · 254,015 people
- City population
- 283,259
- Metro
- St. Louis, MO-IL
- Population (ZIP)
- 17,985
- Household income
- $45,542
- Rent vs Own
- Severe rent burden
- 1457.0
Population outlook (St. Louis County) Hauer SSP2
- Today (2025)
- 315,737 people
- By 2030
- 313,865 · -0.6%
- By 2040
- 305,439 · -3.3%
- By 2050
- 296,529 · -6.1%
- By 2075
- 271,028 · -14.2%
- By 2100
- 255,359 · -19.1%
Race, ethnicity, and origin ACS 2023
- Neighborhood character
- Majority Black (63%)
- Race & ethnicity
- Black 63% White 24% Asian 6% Two or more races 5% Hispanic / Latino 4%
- Common ancestry
- Lithuanian 1% Scotch-Irish 1% Romanian 1%
- Foreign-born
- 9% · China, South Korea, Canada
- Languages at home
- 88% English-only · Spanish 3% Chinese 2% Korean 2%
Political lean MEDSL · St. Louis
- 2024 margin
- Solid D (+64.7) · D 81.4% · R 16.7% · Other 2.0%
- 2008→2024 swing
- -3.5pp toward R · 2008: 68.2pp · 2024: 64.7pp
- All cycles
- 2024: D+64.7 2020: D+66.2 2016: D+63.7 2012: D+66.6 2008: D+68.2
Not yet ingested
- Civics
- —
Market trends
- HPI YoY
- ▼ -158.94%
- Current HPI
- 115.1863
- Rent YoY
- ▲ 2.39%
- Metro
- St. Louis, MO-IL
- State GDP YoY
- ▲ 1.84%
- F500 in state
- 20
Industry mix (Fortune 500 HQ in MO)
| Industry | F500 HQs | Revenue |
|---|---|---|
| Healthcare | 1 | $163B |
|
||
| Insurance | 1 | $21B |
|
||
| Industrial Technology | 1 | $17B |
|
||
| Retail | 1 | $16B |
|
||
| Industrial Distribution | 1 | $10B |
|
||
| Utilities | 1 | $9B |
|
||
Price history
+1566.7% since first listed10 events — show timeline
- 2026-03-23 Contingent — MARIS as Distributed by MLS Grid
- 2026-03-11 Listed $125,000 MARIS as Distributed by MLS Grid
- 2025-11-05 Listed $163,900 ForSaleByOwner.com
- 2025-07-21 Relisted — MARIS as Distributed by MLS Grid
- 2025-07-21 Price Changed $165,000 MARIS as Distributed by MLS Grid
- 2025-06-25 Price Changed $174,900 MARIS as Distributed by MLS Grid
- 2025-05-29 Listed $180,000 MARIS as Distributed by MLS Grid
- 2012-01-20 Sold (MLS) — MARIS as Distributed by MLS Grid
- 2011-08-02 Listed $7,500 MARIS as Distributed by MLS Grid
- 2002-02-21 Sold (Public Records) — Public Records
Property tax history
+2.7%/yrLatest (2024): $611 · +4.9% YoY. Source: county tax records.
Cash-flow waterfall
monthlySold comps — $/sqft
last 12 mo · ≤1 miLoading sold comps…