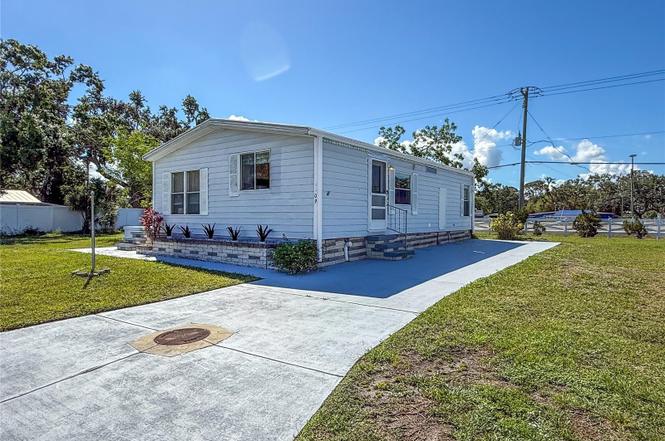
4609 10th Street Ct E · Ellenton, FL
Flood risk 8/10 · Major
- FEMA flood zone
- X (shaded)
- Chance of flooding over 30 yrs
- 0.97%
- Est. flood insurance / yr
- $507 – $1,088
Fire risk 2/10 · Minimal
- Est. fire insurance / yr
- $947 – $1,759
Heat risk 10/10 · Severe
- Hot days now (above 107°F)
- 6 days/yr
- Hot days in 30 yrs
- 25 days/yr
Wind risk 10/10 · Severe
- Chance of severe wind over 30 yrs
- 99.0%
Air-quality risk 3/10 · Minor
- Unhealthy air days now
- 3 days/yr
- Unhealthy air days in 30 yrs
- 3 days/yr
Risk factors via First Street. Map © Google.
Why this score? — see what drove the B+ grade
The composite is a weighted blend of 9 inputs, each scored 0–100. Each bar is that input's sub-score; the figure is the points it added to the 100-point composite (weight × sub-score).
- Cash flow +30.0/30.0
- ARV discount +15.0/15.0
- 1% rule +10.0/10.0
- DSCR +10.0/10.0
- Schools +4.4/10.0
- Livability +3.8/5.0
- Rent growth +2.5/5.0
- Condition / age +2.5/5.0
- Appreciation +0.0/10.0
$85,900
🖨 Deal sheet (PDF) 📄 Offer letter ✓ Due diligence
Listing remarks MLS
This nice 2 bedroom 2 bath home is on a large corner lot with lots of fruit trees. It has a vinyl screen room with a large jacuzzi on it. It is turnkey furnished and is in a no pet retirement community.
Key facts
- Shuffleboard courts
- Community pool
- Huge porch
Tags
Property features AI
Finance
- Financial info: Total monthly fees $50; Total annual fees $600; Lease restrictions apply
- HOA & community: Monthly association fee of $50; Association approval required; Tidevue Estates Civic Organization; Community clubhouse; Community fitness center; Community pool; Golf carts allowed; Senior community; Pets not allowed
Exterior
- Parking: Detached parking not specified
- Utilities: Public water; Public sewer; Electricity connected; Cable connected
- Home design: Manufactured home (double wide); Single-story; North-facing entry
- Construction: Metal frame construction; Metal siding; Membrane roof; Pillar/post/pier foundation; Built as completed condition
- Exterior features: Rain gutters; Asphalt road access; Publicly maintained road
Interior
- Kitchen: Microwave; Range; Refrigerator
- Bedrooms: 2 bedrooms
- Flooring: Carpet; Ceramic tile; Vinyl
- Bathrooms: 2 full bathrooms
- Heating & cooling: Central heating; Central air conditioning
- Interior features: Ceiling fans; Open floorplan; Thermostat
- Laundry & utility: Common area laundry; Washer hookup; Electric dryer hookup
Neighborhood map
What this means for you Summary
Snapshot
- This is a 2-bed/2.0-bath manufactured listed at $86k.
Deal economics
- At list price, monthly cash flow is $1k ($16k/yr) — positive.
- The deal already cash-flows at list — no discount required.
- Meets the 1% rule at list price ($3k rent vs $86k).
- Recommended offer: $76k (12.0% below list) — sets the bar for market timing.
- Cap rate 26.3% vs local median 4.5% in Ellenton — top-decile yield for the area; either an underpriced asset or a hidden risk that comps aren't pricing in. Stress-test before assuming the spread holds.
Location & tenants
- Location reads 76/100 on livability (#232 in FL, #3,666 nationally) — a middle-class / working-renter tenant base. Strengths: cost of living A+, housing A+, health & safety A+; Watch: amenities F, commute F.
- Manatee (suburban): math 54% / reading 50% proficiency, ranked #26 of 73 in FL (top 36%) — acceptable for families but not a draw, mixed tenant base, ~2y average lease.
- Zoned schools: Blackburn Elementary School (math 62% / reading 42%, grade C-, #990 of 2,144 statewide, top 48%, 551 students, 78% FRL); Palmetto High School (math 22% / reading 36%, grade F, #456 of 667 statewide, top 68%, 2,100 students, 61% FRL) — zoned schools average 70% FRL vs 51% district-wide (19 pts higher); higher-poverty schools than district average — tighter screening recommended.
- Market conditions: 185 active listings in the ZIP; 6 comparable units currently listed for rent nearby; rentals leasing fast (median 6d on market — plan ~1-2 weeks tenant-placement turnaround); 7,472 units permitted in Manatee County in 2024 (1,782 in 5+ unit buildings).
Forward outlook
- Local home prices are declining (-3.0%/yr); year-one equity from $594 of loan paydown is wiped out by about $3k of value loss. Plan a longer hold.
- Manatee County population projected at +43% by 2050 — long-run rental-demand tailwind backs the buy-and-hold thesis.
- At projected returns (-3.0% appreciation + 3.0% rent growth), your $24k cash investment doubles in ~2 years — after that, you're playing with house money.
Negotiation context
- It's been on market 364 days — a 12% lower offer ($76k) is reasonable based on typical stale-listing flexibility.
- 3 sale attempts since 22y ago; this cycle's ask has dropped $29k (25%) from the opening price — seller is motivated, your offer sets the floor, not the list.
- Current owner paid $56k; list at $86k implies a 53% gain — meaningful room to come down on a strong offer.
Risks & watch-outs
- Watch-outs: flood insurance adds $66/mo.
- Climate carrying-cost: severe flood risk; severe wind risk, 99% chance of damaging wind over 30y; extreme-heat days projected 6→25/yr by 2055 (HVAC capex compounding) — expect insurance premiums to compound above CPI over the hold.
Questions for the listing agent
- It's been on market 364 days. Have you received any prior offers? Is the seller open to a 12% concession, seller financing, or rate buy-down credit?
- What's the actual annual flood-insurance premium (NFIP or private), and is the property in a SFHA with mandatory coverage?
- What does the HOA fee cover, when was the last increase, and are there any pending special assessments or reserve-fund shortfalls?
- Why hasn't it sold? Are there any deal-killer items the seller is aware of (foundation, flood, title, zoning, code violations)?
- Is there a deadline driving the sale (1031 exchange, divorce, estate, relocation)? That informs how much negotiation room exists.
- Schools are D-rated, which usually means shorter tenancies and higher turnover. Who's the typical renter profile here, and what's been the actual vacancy rate?
- What's the average days-on-market for RENTAL listings here right now (not sales)? A rising rental-DOM trend means longer vacancies and softer asking-rent achievability than the comps imply.
- What's the recent tenant-quality profile in this submarket — average credit score on applications, eviction rate, late-payment / NSF rate, and stable-employment percentage? A property-management company in the area should have these aggregated.
- How much new for-sale + rental construction is in the pipeline within 1–3 miles? Heavy new supply typically softens prices + rents 12–24 months out; constrained supply supports both.
Investment metrics
- 1% rule
- 3.09% ✓
- Cap rate
- 26.32%
- Cash-on-cash
- 71.51%
- DSCR
- 4.18
- GRM
- 2.7
CMA / ARV
- ARV (on-the-fly)
- $119,232
- Comps found
- 7
Show comp detail 7 sales within ~0.75 mi
| Address | Dist | Beds/Ba | Sqft | Sold | Price | $/sf | Match |
|---|---|---|---|---|---|---|---|
| 1204 43rd Ave E | 0.23mi | 2/2.0 | 903 (+4%) | 4mo | $73,500 | $81 | 78 |
| 4603 10th Street Ct E | 0.04mi | 2/1.5 | 780 (-10%) | 3mo | $108,000 | $138 | 77 |
| 1005 45th Ave E | 0.13mi | 2/2.0 | 960 (+11%) | 4mo | $100,000 | $104 | 72 |
| 4212 13th St E | 0.29mi | 2/2.0 | 960 (+11%) | 2mo | $175,000 | $182 | 66 |
| 1416 41st Ave E | 0.48mi | 2/2.0 | 800 (-7%) | 3mo | $160,000 | $200 | 62 |
| 1532 47th Avenue Dr E | 0.39mi | 2/1.0 | 784 (-9%) | 1mo | $129,900 | $166 | 62 |
| 1224 41st Avenue Dr E | 0.40mi | 2/2.0 | 963 (+12%) | 4mo | $125,000 | $130 | 59 |
Match score weights: distance 35% · size 25% · config 20% · recency 20%. Top-matched comps best support the ARV.
Projected returns pro-forma
-3.0% appreciation · 3.0% rent growth · sell at horizon
- IRR
- 67.6%
- Equity multiple
- 4.05×
- Total profit
- $73,259
- Equity at exit
- $12,808
- IRR
- 71.8%
- Equity multiple
- 8.33×
- Total profit
- $176,392
- Equity at exit
- $7,427
Cash invested: $24,052 (down + closing). Projections, not guarantees.
Landlord ↔ Tenant lean methodology
- Overall (STATE)
- 87 Strongly Landlord-Friendly
- State Florida
- 87 Strongly Landlord-Friendly · R+3
- County
- — inherits STATE
- City
- — inherits STATE
ZIP-level market 34222
- Home prices YoY
- -26.9%
- Active inventory
- 185
- Price-to-rent
- 2.7×
Monthly cashflow live
- Estimated rent
- $2,654 high interval (Pro) →
- Mortgage (P&I)
- −$450
- Tax from tax record
- −$127 /mo · $1,525/yr
- Insurance
- −$36
- Flood insurance flood zone
- −$66 /mo · $798/yr
- HOA
- −$50
- Vacancy / Maint / Mgmt
- −$557
- Net cashflow
- $1,367
Break-even live
Sensitivity live
| Price | -10% $1,415 | -5% $1,391 | +0% $1,367 | +5% $1,343 | +10% $1,318 |
|---|---|---|---|---|---|
| Rent | -10% $1,157 | -5% $1,262 | +0% $1,367 | +5% $1,472 | +10% $1,576 |
| Rate | -1.0pp $1,410 | -0.5pp $1,389 | base $1,367 | +0.5pp $1,345 | +1.0pp $1,322 |
UW: 25.0% down · 7.5% · 30yr · 1.5% tax · 5.0% vac · 8.0% maint · 8.0% mgmt
Financing live
Cash to close
- Down payment
- $21,475
- Closing costs
- $2,577
- Reserves months
- —
- Total cash needed
- —
Loan-product check · same deal, 3 products live
Conventional
25% down · 7.5% · 30yr
- Down + closing
- —
- Monthly P&I
- —
- Monthly cashflow
- —
- DSCR
- —
- Eligible?
- —
Personal DTI + credit; lowest rate.
DSCR
20% down · 8.5% · 30yr
- Down + closing
- —
- Monthly P&I
- —
- Monthly cashflow
- —
- DSCR
- —
- Eligible?
- —
No personal income docs; deal must DSCR.
Hard money
10% down · 12.0% · 12mo
- Down + closing
- —
- Monthly P&I
- —
- Monthly cashflow
- —
- DSCR
- —
- Eligible?
- —
Short-term bridge; refi at stabilization.
Rent comps 6 comps
| Address | Beds | Baths | Sqft | Rent | $/sqft | DOM | Units | Dist |
|---|---|---|---|---|---|---|---|---|
| 5021 US Highway 301 N Ellenton, FL | 3.0 | 2.5 | 861 | $3,900 | $4.53 | 5d | 1 | 0.31mi |
| 4403 7th St E #4 Ellenton, FL | 2.0 | 2.0 | 1079 | $2,700 | $2.50 | 25d | 1 | 0.38mi |
| 4180 Yardly Dr Palmetto, FL | 1.0–3.0 | 1.0–2.0 | 1021 | $2,498 | $2.45 | 5d | 15 | 0.48mi |
| 1651 36th Ave E Ellenton, FL | 1.0–3.0 | 1.0–2.0 | 804 | $1,397 | $1.74 | 0d | 9 | 0.86mi |
| 5942 Factory Shops Blvd Ellenton, FL | 1.0–3.0 | 1.0–2.0 | 953 | $2,357 | $2.47 | 0d | 66 | 1.14mi |
| 2710 59th Dr E Ellenton, FL | 1.0–3.0 | 1.0–2.0 | 1149 | $2,234 | $1.94 | 5d | 37 | 1.35mi |
HOA detail
- Monthly dues
- $50 · $600/yr
Listing history 20 events
-
2026-06-08statusdays on market $85,900 Pending 364 DOM
-
2026-06-08days on market $85,900 Active 363 DOM
-
2026-06-03days on market $85,900 Active 359 DOM
-
2026-06-02days on market $85,900 Active 358 DOM
-
2026-06-01days on market $85,900 Active 357 DOM
-
2026-05-31days on market $85,900 Active 356 DOM
-
2026-05-02price $85,900
-
2026-04-09price $87,900
-
2026-03-12price $89,900
-
2026-02-20price $95,000
-
2026-01-16price $99,000
-
2025-12-10status Active
-
2025-11-16status Pending
-
2025-09-09price $99,500
-
2025-06-10price $109,500
-
2025-05-16$115,000 Active
-
2007-05-04soldstatus $56,000
-
2004-12-17soldstatus $53,000 202-char remark
Show marketing remark (202 chars)
This nice 2 bedroom 2 bath home is on a large corner lot with lots of fruit trees. It has a vinyl screen room with a large jacuzzi on it. It is turnkey furnished and is in a no pet retirement community.
-
2004-11-08$53,000 202-char remark
Show marketing remark (202 chars)
This nice 2 bedroom 2 bath home is on a large corner lot with lots of fruit trees. It has a vinyl screen room with a large jacuzzi on it. It is turnkey furnished and is in a no pet retirement community.
-
1983-02-01soldstatus $9,000
ⓘ Source: listings_history table (triggers on properties + properties_extension) + one-shot
backfill from property_details.listing_events for pre-trigger history.
Tax reassessment forecast FL · Resets to sale price
- Current annual tax
- $1,525 · $127/mo
- Projected year-2 tax
- $1,525 · $127/mo
- Expected delta
- $0/yr ($0/mo · 0.0%)
ⓘ Screening estimate from a state-policy table — verify with the county assessor before closing.
Climate risk First Street
- Flood 8/10 Severe FEMA zone X (shaded) · 97% chance over 30 yrs
- Wildfire 2/10 Low
- Heat 10/10 Extreme 6 d/yr ≥107°F today · 25 d/yr by 30 yrs out
- Wind 10/10 Extreme 99% chance of damaging wind over 30 yrs
- Air quality 3/10 Moderate 3 unhealthy d/yr today · 3 by 30 yrs out
Nearby sold comps map
Loading sold comps map…
Walkable amenities ~0.75 mi
Loading nearby amenities…
Taxation est. · year 1
- Rental income
- $31,847
- − Mortgage interest
- −$4,812
- − Property taxes
- −$1,525
- − Insurance
- −$1,227
- − Repairs & maintenance
- −$2,548
- − Management
- −$2,548
- − HOA
- −$600
- − Depreciation
- −$2,499
- Taxable income
- $16,089
- Est. tax owed @ 24.0%
- −$3,861
- After-tax cash flow
- $12,541/yr
For passive investors: Depreciation is non-cash, so a rental often shows a tax loss while cash-flowing — sheltering income. Rental losses are passive: they offset passive income freely, and up to $25,000/yr can offset ordinary (W-2) income if you actively participate and your MAGI is under $100k (phasing out to $0 by $150k); unused losses carry forward. On sale, claimed depreciation is recaptured at up to 25%, and gains may owe capital-gains tax (a 1031 exchange can defer both). Figures are a year-1 estimate at your 24.0% rate — not tax advice; consult a CPA.
Schools (NCES district)
- District
- Manatee
- NCES district ID
- 1201230
- Math proficiency
- 54% ▼ -6.00%
- Reading proficiency
- 50% ▼ -2.00%
- Median HH income
- $49,607
- Composite
- 44.43/100
- National rank
- #2806
- State rank
- #26 of 73 in FL
Livability — Ellenton
- Score
- 76/100
- State rank
- #232
- US rank
- #3666
Category grades
Schools grade is shown separately in the Schools card above.
Census & demographics
- Census place
- Ellenton, FL
- County
- Manatee County · 416,364 people
- City population
- 14,819
- Metro
- North Port-Sarasota-Bradenton, FL
- Population (ZIP)
- 14,819
- Household income
- $64,355
- Rent vs Own
- Severe rent burden
- 313.0
Population outlook (Manatee County) Hauer SSP2
- Today (2025)
- 447,342 people
- By 2030
- 488,911 · +9.3%
- By 2040
- 567,934 · +27.0%
- By 2050
- 637,995 · +42.6%
- By 2075
- 781,970 · +74.8%
- By 2100
- 848,272 · +89.6%
Race, ethnicity, and origin ACS 2023
- Neighborhood character
- Predominantly White (70%)
- Race & ethnicity
- White 70% Hispanic / Latino 17% Two or more races 13% Black 7% Native American 2% Asian 1%
- Hispanic origin (detail)
- Mexican 8% Puerto Rican 2%
- Common ancestry
- Romanian 3% Slovak 2% Lithuanian 2%
- Foreign-born
- 8% · Canada, Jamaica, Vietnam
- Languages at home
- 88% English-only · Spanish 10% Other Indo-European 1% Vietnamese 1%
Political lean MEDSL · Manatee
- 2024 margin
- Strong R (+23.5) · D 37.9% · R 61.4%
- 2008→2024 swing
- -16.5pp toward R · 2008: -7.0pp · 2024: -23.5pp
- All cycles
- 2024: R+23.5 2020: R+16.1 2016: R+17.1 2012: R+12.5 2008: R+7.0
Not yet ingested
- Civics
- —
Market trends
- HPI YoY
- ▼ -107.75%
- Current HPI
- 293.2597
- Rent YoY
- —
- Metro
- North Port-Sarasota-Bradenton, FL
- State GDP YoY
- ▲ 3.28%
- F500 in state
- 36
Industry mix (Fortune 500 HQ in FL)
| Industry | F500 HQs | Revenue |
|---|---|---|
| Industrial Technology | 2 | $29B |
|
||
| Insurance | 2 | $17B |
|
||
| Retail | 1 | $60B |
|
||
| Technology Distribution | 1 | $58B |
|
||
| Homebuilding | 1 | $35B |
|
||
| Technology Manufacturing | 1 | $35B |
|
||
Price history
+854.4% since first listed14 events — show timeline
- 2026-05-02 Price Changed $85,900 Stellar MLS as Distributed by MLS Grid
- 2026-04-09 Price Changed $87,900 Stellar MLS as Distributed by MLS Grid
- 2026-03-12 Price Changed $89,900 Stellar MLS as Distributed by MLS Grid
- 2026-02-20 Price Changed $95,000 Stellar MLS as Distributed by MLS Grid
- 2026-01-16 Price Changed $99,000 Stellar MLS as Distributed by MLS Grid
- 2025-12-10 Relisted — Stellar MLS as Distributed by MLS Grid
- 2025-11-16 Pending — Stellar MLS as Distributed by MLS Grid
- 2025-09-09 Price Changed $99,500 Stellar MLS as Distributed by MLS Grid
- 2025-06-10 Price Changed $109,500 Stellar MLS as Distributed by MLS Grid
- 2025-05-16 Listed $115,000 Stellar MLS as Distributed by MLS Grid
- 2007-05-04 Sold (Public Records) $56,000 Public Records
- 2004-12-17 Sold (MLS) $53,000 Stellar MLS as Distributed by MLS Grid
- 2004-11-08 Listed $53,000 Stellar MLS as Distributed by MLS Grid
- 1983-02-01 Sold (Public Records) $9,000 Public Records
Property tax history
+5.2%/yrLatest (2025): $1,525 · +2.2% YoY. Source: county tax records.
Cash-flow waterfall
monthlySold comps — $/sqft
last 12 mo · ≤1 miLoading sold comps…