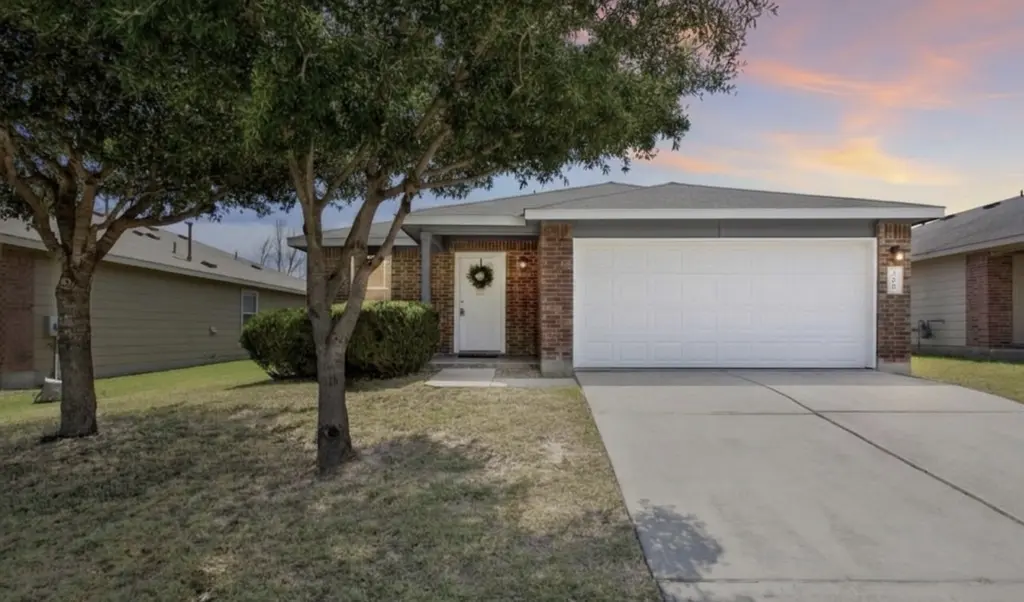
200 Firebush Way · Buda, TX
Flood risk 1/10 · Minimal
- FEMA flood zone
- X (unshaded)
- Chance of flooding over 30 yrs
- 0.0%
- Est. flood insurance / yr
- $507 – $1,088
Fire risk 5/10 · Moderate
- Est. fire insurance / yr
- $1,222 – $2,270
Heat risk 8/10 · Major
- Hot days now (above 108°F)
- 7 days/yr
- Hot days in 30 yrs
- 22 days/yr
Wind risk 8/10 · Major
- Chance of severe wind over 30 yrs
- 80.0%
Air-quality risk 2/10 · Minimal
- Unhealthy air days now
- 0 days/yr
- Unhealthy air days in 30 yrs
- 1 days/yr
Risk factors via First Street. Map © Google.
Why this score? — see what drove the D grade
The composite is a weighted blend of 9 inputs, each scored 0–100. Each bar is that input's sub-score; the figure is the points it added to the 100-point composite (weight × sub-score).
- ARV discount +15.0/15.0
- Cash flow +8.1/30.0
- 1% rule +4.2/10.0
- Schools +3.5/10.0
- Livability +3.5/5.0
- Condition / age +2.5/5.0
- DSCR +2.2/10.0
- Rent growth +2.1/5.0
- Appreciation +0.0/10.0
$212,997
🖨 Deal sheet (PDF) 📄 Offer letter ✓ Due diligence
Listing remarks
Beautiful Home, convenient location by I-35 and major shopping. 20 minutes to downtown Austin.
Key facts
- Major shopping
- Convenient location
- 6,385 sq ft lot
Tags
Property features AI
Finance
- HOA & community: Member of Green Meadows Homeowner Association; HOA fee $240 annually; Community playground; Community sport court(s)
Exterior
- Parking: Driveway parking; Front-facing garage; 2 covered garage spaces; Total 4 parking spaces
- Utilities: Electricity available; Public water; Public sewer
- Home design: Single-story home; Faces west; Resale property; Slab foundation
- Construction: Built per public records; Brick and HardiPlank-type siding; Composition roof
- Exterior features: Rear porch; Back yard fencing; Front yard; Interior lot; See remarks
Interior
- Kitchen: Dishwasher; Gas range; Microwave; Refrigerator
- Bedrooms: Three main-level bedrooms
- Flooring: Carpet; Laminate; Wood
- Bathrooms: Two full bathrooms
- Heating & cooling: Central heating (electric); Central air; Ceiling fans
- Interior features: Ceiling fans; Eat-in kitchen; Kitchen island; Laminate counters; Open floor plan; Pantry; Main-level primary
- Laundry & utility: Dedicated laundry room
Neighborhood map
What this means for you Summary
Snapshot
- This is a 3-bed/2.0-bath single-family listed at $213k.
Deal economics
- At list price, monthly cash flow is $-206 ($-2k/yr) — negative.
- To cash-flow at today's rent, offer at most $177k (17.1% below list).
- To meet the 1% rule (rent ≥ 1% of price), the offer needs to be $197k (7.6% below list).
- Recommended offer: $177k (17.1% below list) — sets the bar for cash-flow.
- Cap rate 5.1% vs local median 2.6% in Buda — top-decile yield for the area; either an underpriced asset or a hidden risk that comps aren't pricing in. Stress-test before assuming the spread holds.
Location & tenants
- Location reads 70/100 on livability (#339 in TX) — a middle-class / working-renter tenant base. Strengths: employment A+, housing A+, crime A-; Watch: amenities F, commute F, health & safety F.
- Hays CISD (rural): math 35% / reading 41% proficiency, ranked #390 of 826 in TX (top 47%) — families likely to look elsewhere, expect single-tenant / working-renter base with shorter leases.
- Zoned schools: Tom Green El (math 29% / reading 31%, grade F, #2,500 of 4,322 statewide, top 58%, 559 students, 63% FRL); R C Barton Middle (math 56% / reading 52%, grade B-, #270 of 1,662 statewide, top 16%, 816 students, 33% FRL); Jack C Hays H S (math 41% / reading 47%, grade F, #697 of 1,632 statewide, top 43%, 2,062 students, 36% FRL) — zoned schools at 44% FRL track the district average.
- Market conditions: Rents soft (-1.8%/yr); 1005 active listings in the ZIP; 40 comparable units currently listed for rent nearby; rentals at typical pace (median 18d on market — plan ~3-4 weeks tenant-placement turnaround); high-income renter base; 5,270 units permitted in Hays County in 2024 (1,464 in 5+ unit buildings).
Forward outlook
- Local home prices are declining (-3.0%/yr); year-one equity from $1k of loan paydown is wiped out by about $6k of value loss. Plan a longer hold.
- Hays County population projected at +93% by 2050 — long-run rental-demand tailwind backs the buy-and-hold thesis.
Negotiation context
- It's been on market 55 days — a 3% lower offer ($207k) is reasonable based on typical stale-listing flexibility.
- 5 sale attempts since 9y ago; this cycle's ask is 9% above the opening price — seller raised mid-cycle; expect resistance to lowballs.
Risks & watch-outs
- Watch-outs: property tax is 3.0% of price.
- Climate carrying-cost: severe wind risk, 80% chance of damaging wind over 30y; moderate wildfire risk; extreme-heat days projected 7→22/yr by 2055 (HVAC capex compounding) — expect insurance premiums to compound above CPI over the hold.
Questions for the listing agent
- What do current leases actually rent for vs. the listed asking? Can we see a recent rent roll and the last 12 months of T-12 income?
- It's been on market 55 days. Have you received any prior offers? Is the seller open to a 17% concession, seller financing, or rate buy-down credit?
- Property tax is high relative to price — has the assessment been appealed recently, and will the sale trigger a re-assessment?
- What does the HOA fee cover, when was the last increase, and are there any pending special assessments or reserve-fund shortfalls?
- Is there a deadline driving the sale (1031 exchange, divorce, estate, relocation)? That informs how much negotiation room exists.
- Schools are B-rated — typically a magnet for longer-tenancy family renters. What's the average tenant stay here, and is there a school-zone premium baked into asking?
- The area grade is low — what's the realistic commute time and amenity access for the typical tenant pool here? Any planned neighborhood developments (good or bad) we should know about?
- What's the average days-on-market for RENTAL listings here right now (not sales)? A rising rental-DOM trend means longer vacancies and softer asking-rent achievability than the comps imply.
- What's the recent tenant-quality profile in this submarket — average credit score on applications, eviction rate, late-payment / NSF rate, and stable-employment percentage? A property-management company in the area should have these aggregated.
- How much new for-sale + rental construction is in the pipeline within 1–3 miles? Heavy new supply typically softens prices + rents 12–24 months out; constrained supply supports both.
Investment metrics
- 1% rule
- 0.92% ✗
- Cap rate
- 5.13%
- Cash-on-cash
- -4.15%
- DSCR
- 0.82
- GRM
- 9.0
CMA / ARV
- ARV (median comp)
- $318,338
- List price
- $212,997
- Delta
- -33.09%
- Verdict
- UNDERPRICED
- Comps
- 20 within 1.0 mi
Show comp detail 12 sales within ~0.75 mi
| Address | Dist | Beds/Ba | Sqft | Sold | Price | $/sf | Match |
|---|---|---|---|---|---|---|---|
| 263 Feathergrass Dr | 0.05mi | 3/2.0 | 1,506 (0%) | 6mo | $279,000 | $185 | 93 |
| 272 Feathergrass Dr | 0.06mi | 3/2.0 | 1,479 (-2%) | 10mo | $279,500 | $189 | 86 |
| 1065 Canada Wild Dr | 0.19mi | 3/2.0 | 1,626 (+8%) | 1mo | $299,900 | $184 | 77 |
| 160 Vermilion Marble Trl | 0.53mi | 3/2.0 | 1,567 (+4%) | 8mo | $300,000 | $191 | 62 |
| 463 Bridgestone Way | 0.52mi | 3/2.0 | 1,630 (+8%) | 1mo | $305,000 | $187 | 61 |
| 152 Vermilion Marble Trl | 0.54mi | 3/2.0 | 1,434 (-5%) | 13mo | $274,999 | $192 | 56 |
| 539 Bridgestone Way | 0.47mi | 3/2.0 | 1,630 (+8%) | 13mo | $339,000 | $208 | 54 |
| 288 Emerald Green Trl | 0.58mi | 4/2.0 (+1) | 1,625 (+8%) | 8mo | $274,900 | $169 | 48 |
| 233 Emerald Green Trl | 0.52mi | 4/2.0 (+1) | 1,625 (+8%) | 12mo | $285,000 | $175 | 47 |
| 299 Andesite Trl | 0.62mi | 3/2.0 | 1,690 (+12%) | 10mo | $300,000 | $178 | 42 |
| 2292 Intrepid Dr | 0.69mi | 3/2.5 | 1,652 (+10%) | 13mo | $304,888 | $185 | 38 |
| 289 Emerald Green Trl | 0.58mi | 4/2.5 (+1) | 1,695 (+12%) | 12mo | $275,000 | $162 | 35 |
Match score weights: distance 35% · size 25% · config 20% · recency 20%. Top-matched comps best support the ARV.
Projected returns pro-forma
-3.0% appreciation · 0.0% rent growth · sell at horizon
- IRR
- -27.4%
- Equity multiple
- 0.11×
- Total profit
- $-53,211
- Equity at exit
- $31,759
- IRR
- -46.5%
- Equity multiple
- -0.42×
- Total profit
- $-84,691
- Equity at exit
- $18,416
Cash invested: $59,639 (down + closing). Projections, not guarantees.
Landlord ↔ Tenant lean methodology
- Overall (STATE)
- 87 Strongly Landlord-Friendly
- State Texas
- 87 Strongly Landlord-Friendly · R+5
- County
- — inherits STATE
- City
- — inherits STATE
ZIP-level market 78610
- Rents YoY
- -1.8%
- Active inventory
- 1005
- Price-to-rent
- 9.0×
Monthly cashflow live
- Estimated rent
- $1,967 high interval (Pro) →
- Mortgage (P&I)
- −$1,117
- Tax from tax record
- −$535 /mo · $6,415/yr
- Insurance
- −$89
- HOA
- −$20
- Vacancy / Maint / Mgmt
- −$413
- Net cashflow
- $-206
Break-even live
Sensitivity live
| Price | -10% $-86 | -5% $-146 | +0% $-206 | +5% $-267 | +10% $-327 |
|---|---|---|---|---|---|
| Rent | -10% $-362 | -5% $-284 | +0% $-206 | +5% $-129 | +10% $-51 |
| Rate | -1.0pp $-99 | -0.5pp $-152 | base $-206 | +0.5pp $-261 | +1.0pp $-318 |
UW: 25.0% down · 7.5% · 30yr · 1.5% tax · 5.0% vac · 8.0% maint · 8.0% mgmt
Financing live
Cash to close
- Down payment
- $53,249
- Closing costs
- $6,390
- Reserves months
- —
- Total cash needed
- —
Loan-product check · same deal, 3 products live
Conventional
25% down · 7.5% · 30yr
- Down + closing
- —
- Monthly P&I
- —
- Monthly cashflow
- —
- DSCR
- —
- Eligible?
- —
Personal DTI + credit; lowest rate.
DSCR
20% down · 8.5% · 30yr
- Down + closing
- —
- Monthly P&I
- —
- Monthly cashflow
- —
- DSCR
- —
- Eligible?
- —
No personal income docs; deal must DSCR.
Hard money
10% down · 12.0% · 12mo
- Down + closing
- —
- Monthly P&I
- —
- Monthly cashflow
- —
- DSCR
- —
- Eligible?
- —
Short-term bridge; refi at stabilization.
Rent comps 40 comps
| Address | Beds | Baths | Sqft | Rent | $/sqft | DOM | Units | Dist |
|---|---|---|---|---|---|---|---|---|
| 315 Feathergrass Dr Buda, TX | 3.0 | 2.0 | 1438 | $1,725 | $1.20 | 6d | 1 | 0.05mi |
| 2480 Green Meadows Ln Buda, TX | 3.0 | 2.5 | 2201 | $1,995 | $0.91 | 6d | 1 | 0.08mi |
| 2338 Green Meadows Ln Buda, TX | 3.0 | 2.0 | 1560 | $1,850 | $1.19 | 45d | 1 | 0.15mi |
| 184 Wolf Berry Path Buda, TX | 4.0 | 2.0 | 1743 | $1,875 | $1.08 | 45d | 1 | 0.18mi |
| 228 Pigeon Berry Pass Buda, TX | 3.0 | 2.0 | 1676 | $1,895 | $1.13 | 6d | 1 | 0.19mi |
| 251 Wolf Berry Path Buda, TX | 3.0 | 2.0 | 1704 | $1,945 | $1.14 | 16d | 1 | 0.24mi |
| 808 Staglin St Unit A Buda, TX | 4.0 | 3.0 | 1800 | $2,050 | $1.14 | 6d | 1 | 0.31mi |
| 732 Staglin St Unit B Buda, TX | 4.0 | 3.0 | 1800 | $1,925 | $1.07 | 45d | 1 | 0.31mi |
| 775 Staglin St Unit A Buda, TX | 3.0 | 2.0 | 1484 | $1,875 | $1.26 | 12d | 1 | 0.35mi |
| 278 Cross Barn Blvd Buda, TX | 3.0–4.0 | 2.0–3.0 | 1642 | $1,745 | $1.06 | 19d | 3 | 0.37mi |
| 130 Schrader Dr Unit B Buda, TX | 4.0 | 3.0 | 1800 | $1,875 | $1.04 | 45d | 1 | 0.40mi |
| 144 Schrader Dr Unit B Buda, TX | 3.0 | 2.0 | 1484 | $1,875 | $1.26 | 23d | 1 | 0.40mi |
| 313 Cross Barn Blvd Unit A Buda, TX | 4.0 | 2.5 | 1676 | $1,850 | $1.10 | 25d | 1 | 0.41mi |
| 414 Cross Barn Blvd Unit A Buda, TX | 3.0 | 2.0 | 1299 | $1,749 | $1.35 | 45d | 1 | 0.45mi |
| 109 Gunner Rd Unit A Buda, TX | 4.0 | 2.5 | 1676 | $1,950 | $1.16 | 12d | 1 | 0.45mi |
| 109 Gunner Rd Unit B Buda, TX | 4.0 | 2.5 | 1676 | $1,950 | $1.16 | 19d | 1 | 0.45mi |
| 1664 Hillside Ter Buda, TX | 1.0–3.0 | 1.0–2.0 | 1168 | $2,487 | $2.13 | 0d | 36 | 0.47mi |
| 264 Vermilion Marble Trl Buda, TX | 4.0 | 2.5 | 1950 | $2,150 | $1.10 | 14d | 1 | 0.47mi |
| 950 FM 2001 Buda, TX | 1.0–3.0 | 1.0–2.0 | 986 | $1,807 | $1.83 | 0d | 55 | 0.51mi |
| 1516 Farm to Market Road 2001 Buda, TX | 2.0 | 2.0 | 1173 | $1,250 | $1.07 | 45d | 1 | 0.59mi |
| 370 Vermilion Marble Trl Buda, TX | 4.0 | 3.0 | 2097 | $2,195 | $1.05 | 19d | 1 | 0.59mi |
| 307 Andesite Trl Buda, TX | 4.0 | 2.0 | 1739 | $2,050 | $1.18 | 45d | 1 | 0.63mi |
| 220 Stone Crest Blvd Buda, TX | 4.0 | 2.5 | 2248 | $2,400 | $1.07 | 25d | 1 | 0.70mi |
| 1518 FM 2001 Buda, TX | 1.0–2.0 | 1.0–2.0 | 1002 | $1,495 | $1.49 | 0d | 38 | 0.73mi |
| 180 Sandstone Trl Buda, TX | 3.0 | 2.0 | 1497 | $1,995 | $1.33 | 18d | 1 | 0.78mi |
| 5850 Dacy Ln Buda, TX | 3.0 | 2.0 | 1820 | $1,900 | $1.04 | 25d | 1 | 0.82mi |
| 476 Suffield Dr Buda, TX | 1.0–4.0 | 1.0–4.0 | 1751 | $2,651 | $1.51 | 0d | 36 | 0.87mi |
| 265 Shale Cir Buda, TX | 4.0 | 2.0 | 1737 | $2,075 | $1.19 | 45d | 1 | 0.88mi |
| 533 Jack Rabbit Ln Unit A Buda, TX | 3.0 | 2.0 | 1374 | $1,650 | $1.20 | 6d | 1 | 1.06mi |
| 130 Quarter Ave Buda, TX | 3.0 | 2.0 | 1304 | $1,750 | $1.34 | 16d | 1 | 1.06mi |
| 232 Natchez Dr Buda, TX | 4.0 | 2.0 | 2028 | $2,500 | $1.23 | 16d | 1 | 1.07mi |
| 1216 Shadow Creek Blvd Buda, TX | 3.0 | 2.5 | 1700 | $1,800 | $1.06 | 19d | 1 | 1.07mi |
| 601 Jack Rabbit Ln Buda, TX | 3.0 | 2.0 | 1350 | $1,675 | $1.24 | 25d | 1 | 1.08mi |
| 292 Strawberry Blonde Dr Buda, TX | 3.0 | 2.0 | 1636 | $2,085 | $1.27 | 0d | 1 | 1.09mi |
| 489 Cherrystone Loop Buda, TX | 4.0 | 3.0 | 2220 | $2,725 | $1.23 | 13d | 1 | 1.09mi |
| 479 Jack Rabbit Ln Unit A Buda, TX | 3.0 | 2.0 | 1372 | $1,699 | $1.24 | 23d | 1 | 1.10mi |
| 1172 Shadow Creek Blvd Buda, TX | 3.0 | 2.5 | 1700 | $1,995 | $1.17 | 19d | 1 | 1.11mi |
| 236 Black Frst Buda, TX | 3.0 | 2.5 | 1700 | $1,695 | $1.00 | 3d | 1 | 1.12mi |
| 421 Jack Rabbit Ln Unit B Hays, TX | 3.0 | 2.0 | 1372 | $1,650 | $1.20 | 4d | 1 | 1.16mi |
| 275 Cherrystone Loop Buda, TX | 3.0 | 2.0 | 1797 | $2,200 | $1.22 | 3d | 1 | 1.16mi |
HOA detail
- Monthly dues
- $20 · $240/yr
Listing history 27 events
-
2026-06-18days on market $212,997 Active 55 DOM
-
2026-06-17days on market $212,997 Active 54 DOM
-
2026-06-16days on market $212,997 Active 53 DOM
-
2026-06-15days on market $212,997 Active 52 DOM
-
2026-06-13days on market $212,997 Active 50 DOM
-
2026-06-10price $212,997 Active 46 DOM
-
2026-06-09days on market $213,000 Active 46 DOM
-
2026-06-08days on market $213,000 Active 45 DOM
-
2026-06-07days on market $213,000 Active 44 DOM
-
2026-06-05days on market $213,000 Active 41 DOM
-
2026-06-03days on market $213,000 Active 40 DOM
-
2026-06-02days on market $213,000 Active 39 DOM
-
2026-06-01days on market $213,000 Active 38 DOM
-
2026-05-31days on market $213,000 Active 37 DOM
-
2026-03-21price
-
2026-03-13status Active
-
2026-02-25price
-
2026-01-15Active
-
2022-10-24status Active
-
2022-08-12historical Active Under Contract
-
2022-06-28Active
-
2020-12-03soldstatus
-
2017-10-04soldstatus
-
2017-10-03soldstatus Sold
-
2017-08-15status Pending - Taking Backups
-
2017-07-27$195,000 Active
-
2017-07-25historical $195,000
ⓘ Source: listings_history table (triggers on properties + properties_extension) + one-shot
backfill from property_details.listing_events for pre-trigger history.
Tax reassessment forecast TX · Resets to sale price
- Current annual tax
- $6,415 · $535/mo
- Projected year-2 tax
- $6,415 · $535/mo
- Expected delta
- $0/yr ($0/mo · 0.0%)
ⓘ Screening estimate from a state-policy table — verify with the county assessor before closing.
Climate risk First Street
- Flood 1/10 Low FEMA zone X (unshaded) · 0% chance over 30 yrs
- Wildfire 5/10 Major
- Heat 8/10 Severe 7 d/yr ≥108°F today · 22 d/yr by 30 yrs out
- Wind 8/10 Severe 80% chance of damaging wind over 30 yrs
- Air quality 2/10 Low 0 unhealthy d/yr today · 1 by 30 yrs out
Nearby sold comps map
Loading sold comps map…
Walkable amenities ~0.75 mi
Loading nearby amenities…
Taxation est. · year 1
- Rental income
- $23,606
- − Mortgage interest
- −$11,931
- − Property taxes
- −$6,415
- − Insurance
- −$1,065
- − Repairs & maintenance
- −$1,888
- − Management
- −$1,888
- − HOA
- −$240
- − Depreciation
- −$6,196
- Taxable loss
- −$6,019
- Est. tax savings @ 24.0%
- +$1,444
- After-tax cash flow
- $-1,031/yr
For passive investors: Depreciation is non-cash, so a rental often shows a tax loss while cash-flowing — sheltering income. Rental losses are passive: they offset passive income freely, and up to $25,000/yr can offset ordinary (W-2) income if you actively participate and your MAGI is under $100k (phasing out to $0 by $150k); unused losses carry forward. On sale, claimed depreciation is recaptured at up to 25%, and gains may owe capital-gains tax (a 1031 exchange can defer both). Figures are a year-1 estimate at your 24.0% rate — not tax advice; consult a CPA.
Schools (NCES district)
- District
- Hays CISD
- NCES district ID
- 4800010
- Math proficiency
- 35% ▼ -15.00%
- Reading proficiency
- 41% ▼ -5.00%
- Median HH income
- $70,570
- Composite
- 34.78/100
- National rank
- #5118
- State rank
- #390 of 826 in TX
Livability — Buda
- Score
- 70/100
- State rank
- #339
- US rank
- #7407
Category grades
Schools grade is shown separately in the Schools card above.
Census & demographics
- Census place
- Buda, TX
- County
- Hays County · 280,138 people
- City population
- 48,319
- Metro
- Austin-Round Rock-Georgetown, TX
- Population (ZIP)
- 48,319
- Household income
- $119,698
- Rent vs Own
- Severe rent burden
- 611.0
Population outlook (Hays County) Hauer SSP2
- Today (2025)
- 286,948 people
- By 2030
- 336,923 · +17.4%
- By 2040
- 441,894 · +54.0%
- By 2050
- 553,462 · +92.9%
- By 2075
- 838,261 · +192.1%
- By 2100
- 1,063,658 · +270.7%
Race, ethnicity, and origin ACS 2023
- Neighborhood character
- Diverse neighborhood (Simpson 0.58)
- Race & ethnicity
- White 49% Hispanic / Latino 42% Two or more races 17% Black 4% Asian 2%
- Hispanic origin (detail)
- Mexican 35%
- Common ancestry
- Italian 2% Romanian 2% Lithuanian 2%
- Foreign-born
- 10% · Canada, Jamaica, South Korea
- Languages at home
- 76% English-only · Spanish 20% Arabic 2% Other Indo-European 1%
Political lean MEDSL · Hays
- 2024 margin
- Lean D (+5.7) · D 52.1% · R 46.5% · Other 1.4%
- 2008→2024 swing
- +7.7pp toward D · 2008: -2.0pp · 2024: 5.7pp
- All cycles
- 2024: D+5.7 2020: D+10.8 2016: R+0.9 2012: R+10.4 2008: R+2.0
Not yet ingested
- Civics
- —
Market trends
- HPI YoY
- ▼ -161.50%
- Current HPI
- 220.6824
- Rent YoY
- ▼ -1.80%
- Metro
- Austin-Round Rock-Georgetown, TX
- State GDP YoY
- ▲ 3.95%
- F500 in state
- 110
Industry mix (Fortune 500 HQ in TX)
| Industry | F500 HQs | Revenue |
|---|---|---|
| Energy | 16 | $1,198B |
|
||
| Technology | 5 | $198B |
|
||
| Engineering / Construction | 4 | $72B |
|
||
| Energy Services | 3 | $60B |
|
||
| Utilities | 3 | $41B |
|
||
| Healthcare | 2 | $330B |
|
||
Price history
+9.2% since first listed14 events — show timeline
- 2026-06-10 Price Changed $212,997 Unlock MLS
- 2026-03-21 Price Changed — Unlock MLS
- 2026-03-13 Relisted — Unlock MLS
- 2026-02-25 Price Changed — Unlock MLS
- 2026-01-15 Listed — Unlock MLS
- 2022-10-24 Relisted — Unlock MLS
- 2022-08-12 Contingent — Unlock MLS
- 2022-06-28 Listed — Unlock MLS
- 2020-12-03 Sold (Public Records) — Public Records
- 2017-10-04 Sold (Public Records) — Public Records
- 2017-10-03 Sold (MLS) — Unlock MLS
- 2017-08-15 Pending — Unlock MLS
- 2017-07-27 Listed $195,000 Unlock MLS
- 2017-07-25 Coming Soon $195,000 Unlock MLS
Property tax history
+4.8%/yrLatest (2025): $6,415 · +2.5% YoY. Source: county tax records.
Cash-flow waterfall
monthlySold comps — $/sqft
last 12 mo · ≤1 miLoading sold comps…