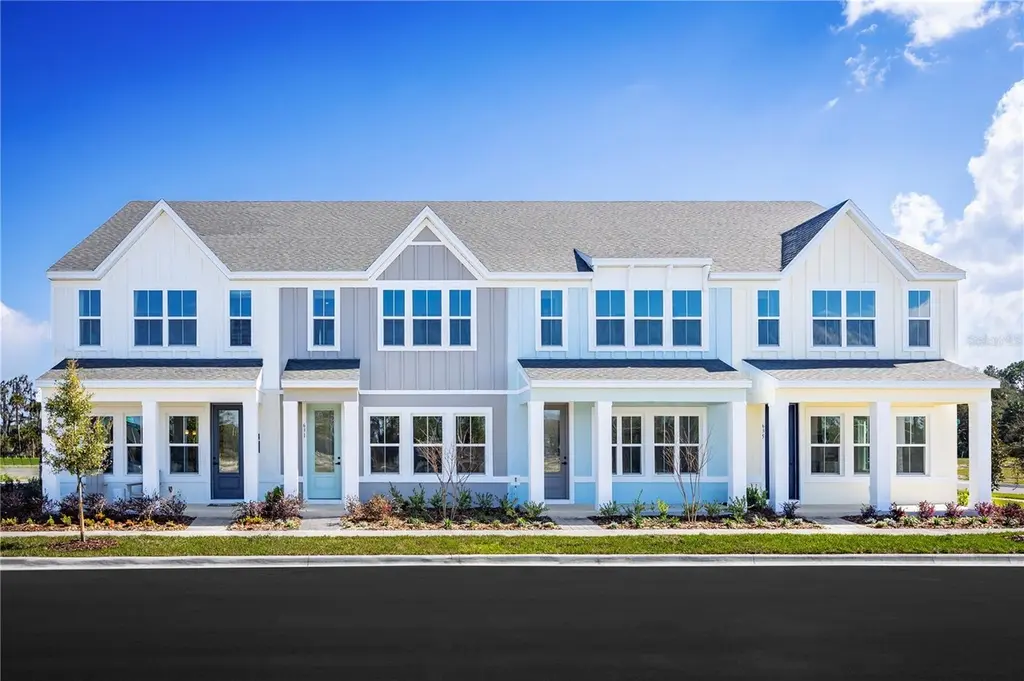
613 Castlecroft Ln · DeBary, FL
Flood risk No data
- FEMA flood zone
- —
- Chance of flooding over 30 yrs
- —
- Est. flood insurance / yr
- —
Fire risk No data
- Est. fire insurance / yr
- —
Heat risk No data
- Hot days now (above threshold)
- —
- Hot days in 30 yrs
- —
Wind risk No data
- Chance of severe wind over 30 yrs
- —
Air-quality risk No data
- Unhealthy air days now
- —
- Unhealthy air days in 30 yrs
- —
Risk factors via First Street. Map © Google.
Why this score? — see what drove the D+ grade
The composite is a weighted blend of 9 inputs, each scored 0–100. Each bar is that input's sub-score; the figure is the points it added to the 100-point composite (weight × sub-score).
- ARV discount +14.9/15.0
- Cash flow +12.3/30.0
- Schools +3.9/10.0
- Livability +3.7/5.0
- DSCR +3.6/10.0
- 1% rule +3.1/10.0
- Rent growth +3.0/5.0
- Condition / age +2.5/5.0
- Appreciation +0.0/10.0
$305,990
🖨 Deal sheet (PDF) 📄 Offer letter ✓ Due diligence
Listing remarks
Pre-Construction. To be built. Welcome to Rivington! Located in DeBary, a charming city, with a short commute to major areas including Sanford, Lake Mary, Daytona Beach, and Orlando. Enjoy completed on-site amenities including a clubhouse with indoor and outdoor space, pool, playground and dog park. Our two-story townhomes feature front porches, 2-car garages, and options for private, conservation homesites. The Allegro is our newest townhome and offers the space and luxury you've been dreaming of. Enjoy a 2-car garage home with a beautiful covered front porch. The welcoming foyer leads into a open-concept living area. Gather in your great room with friends and family before enjoying a home
Key facts
- Dog park
- Front porches
- Pool
Tags
Property features AI
Finance
- Other: Irrigation equipment included; Home warranty provided; Builder license: CBC1257565
- Financial info: Total monthly fees shown as $113; total annual fees $1,356; Lease restrictions apply
- HOA & community: HOA managed by Ryan Homes; $113 monthly; HOA covers grounds maintenance and recreational facilities; Community features include park, playground, pool and street lights; Pets allowed (number limit; restrictions apply); Association fee required
Exterior
- Parking: Attached 2-car garage (approx. 19x18) with garage door opener; Driveway
- Security: Smoke detectors
- Utilities: Public water; Public sewer; Fiber optics available; Public utilities with fire hydrant access; Low-flow water fixtures
- Home design: Residential townhouse; Two levels; Pre-construction (projected completion 2026-11-30); West-facing
- Construction: Block, stucco and frame construction; Shingle roof; Slab foundation; New construction by Ryan Homes (model: ALLEGRO)
- Exterior features: Patio; In-ground gunite pool with child safety fence; Trees and landscaped grounds; Sidewalks and paved lot; Paved road access; Fl. friendly/native landscaping; Drip irrigation and reclaimed-water irrigation
Interior
- Kitchen: Dishwasher; Garbage disposal; Microwave; Range; Eat-in kitchen; Stone counters; Solid wood cabinets
- Bedrooms: 3 bedrooms; Loft
- Flooring: Carpet; Ceramic tile
- Bathrooms: 2 full bathrooms; 1 half bathroom
- Heating & cooling: Central heating; Central air
- Interior features: Eat-in kitchen; Open floorplan; Solid wood cabinets; Stone counters; Thermostat; Walk-in closets; ENERGY STAR qualified windows; Dishwasher; Disposal; Microwave; Range
- Laundry & utility: Laundry inside on upper level
Neighborhood map
What this means for you Summary
Snapshot
- This is a 3-bed/2.5-bath townhouse listed at $306k.
Deal economics
- At list price, monthly cash flow is $-56 ($-676/yr) — negative.
- To cash-flow at today's rent, offer at most $296k (3.3% below list).
- To meet the 1% rule (rent ≥ 1% of price), the offer needs to be $248k (19.1% below list).
- Recommended offer: $248k (19.1% below list) — sets the bar for 1% rule.
- Cap rate 6.1% vs local median 3.7% in DeBary — top-decile yield for the area; either an underpriced asset or a hidden risk that comps aren't pricing in. Stress-test before assuming the spread holds.
Location & tenants
- Location reads 73/100 on livability (#312 in FL) — a middle-class / working-renter tenant base. Strengths: employment A+, housing A+, crime A-; Watch: amenities F, commute F, health & safety D-.
- Volusia (suburban): math 44% / reading 49% proficiency, ranked #47 of 73 in FL (top 64%) — families likely to look elsewhere, expect single-tenant / working-renter base with shorter leases.
- Zoned schools: Enterprise Elementary School (math 47% / reading 42%, grade F, #1,288 of 2,144 statewide, top 62%, 588 students, 66% FRL); River Springs Middle School (math 45% / reading 46%, grade D+, #305 of 571 statewide, top 54%, 1,249 students, 50% FRL); University High School (math 28% / reading 46%, grade F, #340 of 667 statewide, top 52%, 2,901 students, 49% FRL) — zoned schools at 55% FRL track the district average.
- Market conditions: Rents rising (+1.9%/yr); 276 active listings in the ZIP; 4 comparable units currently listed for rent nearby; rentals at typical pace (median 25d on market — plan ~3-4 weeks tenant-placement turnaround); solid renter incomes; 3,402 units permitted in Volusia County in 2024 (681 in 5+ unit buildings).
- This rent runs 34% of the median local income ($88k/yr) — at the standard rent-burdened threshold; future hikes will face affordability resistance.
Forward outlook
- Local home prices are declining (-3.0%/yr); year-one equity from $2k of loan paydown is wiped out by about $9k of value loss. Plan a longer hold.
- Volusia County population projected at +19% by 2050 — long-run rental-demand tailwind backs the buy-and-hold thesis.
Negotiation context
- It's been on market 39 days — a 3% lower offer ($297k) is reasonable based on typical stale-listing flexibility.
Questions for the listing agent
- What do current leases actually rent for vs. the listed asking? Can we see a recent rent roll and the last 12 months of T-12 income?
- It's been on market 39 days. Have you received any prior offers? Is the seller open to a 19% concession, seller financing, or rate buy-down credit?
- What does the HOA fee cover, when was the last increase, and are there any pending special assessments or reserve-fund shortfalls?
- Is there a deadline driving the sale (1031 exchange, divorce, estate, relocation)? That informs how much negotiation room exists.
- Schools are B-rated — typically a magnet for longer-tenancy family renters. What's the average tenant stay here, and is there a school-zone premium baked into asking?
- The area grade is low — what's the realistic commute time and amenity access for the typical tenant pool here? Any planned neighborhood developments (good or bad) we should know about?
- What's the average days-on-market for RENTAL listings here right now (not sales)? A rising rental-DOM trend means longer vacancies and softer asking-rent achievability than the comps imply.
- What's the recent tenant-quality profile in this submarket — average credit score on applications, eviction rate, late-payment / NSF rate, and stable-employment percentage? A property-management company in the area should have these aggregated.
- How much new for-sale + rental construction is in the pipeline within 1–3 miles? Heavy new supply typically softens prices + rents 12–24 months out; constrained supply supports both.
Investment metrics
- 1% rule
- 0.81% ✗
- Cap rate
- 6.07%
- Cash-on-cash
- -0.79%
- DSCR
- 0.96
- GRM
- 10.3
CMA / ARV
- ARV (median comp)
- $366,567
- List price
- $305,990
- Delta
- -16.53%
- Verdict
- UNDERPRICED
- Comps
- 17 within 2.0 mi
Projected returns pro-forma
-3.0% appreciation · 1.89% rent growth · sell at horizon
- IRR
- -18.8%
- Equity multiple
- 0.35×
- Total profit
- $-55,933
- Equity at exit
- $45,624
- IRR
- -13.6%
- Equity multiple
- 0.25×
- Total profit
- $-64,405
- Equity at exit
- $26,456
Cash invested: $85,677 (down + closing). Projections, not guarantees.
Landlord ↔ Tenant lean methodology
- Overall (STATE)
- 87 Strongly Landlord-Friendly
- State Florida
- 87 Strongly Landlord-Friendly · R+3
- County
- — inherits STATE
- City
- — inherits STATE
ZIP-level market 32713
- Rents YoY
- 1.9%
- Active inventory
- 276
- Price-to-rent
- 10.3×
Monthly cashflow live
- Estimated rent
- $2,475 medium interval (Pro) →
- Mortgage (P&I)
- −$1,605
- Tax from tax record
- −$167 /mo · $2,001/yr
- Insurance
- −$127
- HOA
- −$113
- Vacancy / Maint / Mgmt
- −$520
- Net cashflow
- $-56
Break-even live
Sensitivity live
| Price | -10% $117 | -5% $30 | +0% $-56 | +5% $-143 | +10% $-230 |
|---|---|---|---|---|---|
| Rent | -10% $-252 | -5% $-154 | +0% $-56 | +5% $41 | +10% $139 |
| Rate | -1.0pp $98 | -0.5pp $21 | base $-56 | +0.5pp $-136 | +1.0pp $-216 |
UW: 25.0% down · 7.5% · 30yr · 1.5% tax · 5.0% vac · 8.0% maint · 8.0% mgmt
Financing live
Cash to close
- Down payment
- $76,498
- Closing costs
- $9,180
- Reserves months
- —
- Total cash needed
- —
Loan-product check · same deal, 3 products live
Conventional
25% down · 7.5% · 30yr
- Down + closing
- —
- Monthly P&I
- —
- Monthly cashflow
- —
- DSCR
- —
- Eligible?
- —
Personal DTI + credit; lowest rate.
DSCR
20% down · 8.5% · 30yr
- Down + closing
- —
- Monthly P&I
- —
- Monthly cashflow
- —
- DSCR
- —
- Eligible?
- —
No personal income docs; deal must DSCR.
Hard money
10% down · 12.0% · 12mo
- Down + closing
- —
- Monthly P&I
- —
- Monthly cashflow
- —
- DSCR
- —
- Eligible?
- —
Short-term bridge; refi at stabilization.
Rent comps 4 comps
| Address | Beds | Baths | Sqft | Rent | $/sqft | DOM | Units | Dist |
|---|---|---|---|---|---|---|---|---|
| 658 Reader Ln Debary, FL | 3.0 | 2.5 | 1687 | $2,295 | $1.36 | 25d | 1 | 0.16mi |
| 700 Costa Ln Debary, FL | 4.0 | 2.5 | 2200 | $2,900 | $1.32 | 25d | 1 | 0.40mi |
| 730 Rivington Ave Debary, FL | 3.0 | 2.5 | 1998 | $2,600 | $1.30 | 25d | 1 | 0.50mi |
| 550 Orient Ave Debary, FL | 3.0 | 2.0 | 1639 | $2,395 | $1.46 | 25d | 1 | 1.02mi |
HOA detail
- Monthly dues
- $113 · $1,356/yr
- Likely covers
- pool
Listing history 17 events
-
2026-06-22days on market $305,990 Active 39 DOM
-
2026-06-18days on market $305,990 Active 36 DOM
-
2026-06-17days on market $305,990 Active 35 DOM
-
2026-06-16days on market $305,990 Active 34 DOM
-
2026-06-15days on market $305,990 Active 33 DOM
-
2026-06-14days on market $305,990 Active 31 DOM
-
2026-06-10days on market $305,990 Active 28 DOM
-
2026-06-09days on market $305,990 Active 27 DOM
-
2026-06-08days on market $305,990 Active 26 DOM
-
2026-06-07days on market $305,990 Active 25 DOM
-
2026-06-05days on market $305,990 Active 22 DOM
-
2026-06-03days on market $305,990 Active 21 DOM
-
2026-06-03days on market $305,990 Active 20 DOM
-
2026-06-01days on market $305,990 Active 19 DOM
-
2026-05-31days on market $305,990 Active 18 DOM
-
2026-05-31days on market $305,990 Active 17 DOM
-
2026-05-13$305,990 Active 1441-char remark
ⓘ Source: listings_history table (triggers on properties + properties_extension) + one-shot
backfill from property_details.listing_events for pre-trigger history.
Tax reassessment forecast FL · Resets to sale price
- Current annual tax
- $2,001 · $167/mo
- Projected year-2 tax
- $2,540 · $212/mo
- Expected delta
- +$539/yr (+$45/mo · 26.9%)
ⓘ Screening estimate from a state-policy table — verify with the county assessor before closing.
Nearby sold comps map
Loading sold comps map…
Walkable amenities ~0.75 mi
Loading nearby amenities…
Taxation est. · year 1
- Rental income
- $29,704
- − Mortgage interest
- −$17,140
- − Property taxes
- −$2,001
- − Insurance
- −$1,530
- − Repairs & maintenance
- −$2,376
- − Management
- −$2,376
- − HOA
- −$1,356
- − Depreciation
- −$8,902
- Taxable loss
- −$5,977
- Est. tax savings @ 24.0%
- +$1,434
- After-tax cash flow
- $758/yr
For passive investors: Depreciation is non-cash, so a rental often shows a tax loss while cash-flowing — sheltering income. Rental losses are passive: they offset passive income freely, and up to $25,000/yr can offset ordinary (W-2) income if you actively participate and your MAGI is under $100k (phasing out to $0 by $150k); unused losses carry forward. On sale, claimed depreciation is recaptured at up to 25%, and gains may owe capital-gains tax (a 1031 exchange can defer both). Figures are a year-1 estimate at your 24.0% rate — not tax advice; consult a CPA.
Schools (NCES district)
- District
- Volusia
- NCES district ID
- 1201920
- Math proficiency
- 44% ▼ -9.00%
- Reading proficiency
- 49% ▼ -3.00%
- Median HH income
- $42,946
- Composite
- 39.2/100
- National rank
- #4019
- State rank
- #47 of 73 in FL
Livability — DeBary
- Score
- 73/100
- State rank
- #312
- US rank
- #5314
Category grades
Schools grade is shown separately in the Schools card above.
Census & demographics
- Census place
- DeBary, FL
- County
- Volusia County · 556,871 people
- City population
- 22,884
- Metro
- Deltona-Daytona Beach-Ormond Beach, FL
- Population (ZIP)
- 22,884
- Household income
- $88,500
- Rent vs Own
- Severe rent burden
- 265.0
Population outlook (Volusia County) Hauer SSP2
- Today (2025)
- 572,749 people
- By 2030
- 598,695 · +4.5%
- By 2040
- 644,880 · +12.6%
- By 2050
- 681,451 · +19.0%
- By 2075
- 759,957 · +32.7%
- By 2100
- 778,902 · +36.0%
Race, ethnicity, and origin ACS 2023
- Neighborhood character
- Predominantly White (73%)
- Race & ethnicity
- White 73% Hispanic / Latino 17% Two or more races 6% Black 5% Asian 3%
- Hispanic origin (detail)
- Mexican 1% Puerto Rican 10% Cuban 1%
- Common ancestry
- Lithuanian 2% Romanian 2% Serbian 2%
- Foreign-born
- 8% · Canada, Vietnam, South Korea
- Languages at home
- 87% English-only · Spanish 10% Vietnamese 2% Other Indo-European 1%
Political lean MEDSL · Volusia
- 2024 margin
- Strong R (+21.8) · D 38.7% · R 60.5%
- 2008→2024 swing
- -27.4pp toward R · 2008: 5.7pp · 2024: -21.8pp
- All cycles
- 2024: R+21.8 2020: R+14.1 2016: R+13.1 2012: R+1.2 2008: D+5.7
Not yet ingested
- Civics
- —
Market trends
- HPI YoY
- ▼ -247.35%
- Current HPI
- 294.803
- Rent YoY
- ▲ 1.89%
- Metro
- Deltona-Daytona Beach-Ormond Beach, FL
- State GDP YoY
- ▲ 3.28%
- F500 in state
- 36
Industry mix (Fortune 500 HQ in FL)
| Industry | F500 HQs | Revenue |
|---|---|---|
| Industrial Technology | 2 | $29B |
|
||
| Insurance | 2 | $17B |
|
||
| Retail | 1 | $60B |
|
||
| Technology Distribution | 1 | $58B |
|
||
| Homebuilding | 1 | $35B |
|
||
| Technology Manufacturing | 1 | $35B |
|
||
Price history
1 event — show timeline
- 2026-05-13 Listed $305,990 Stellar MLS as Distributed by MLS Grid
Property tax history
+6.7%/yrLatest (2025): $2,001 · +6.7% YoY. Source: county tax records.
Cash-flow waterfall
monthlySold comps — $/sqft
last 12 mo · ≤1 miLoading sold comps…