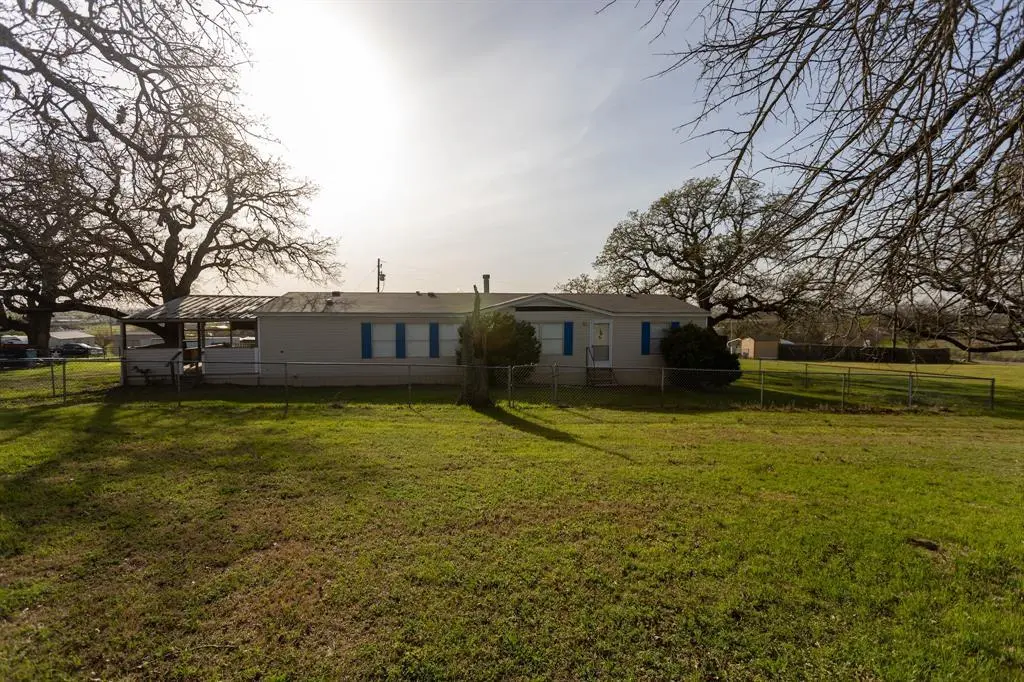
2801 County Road 911 · Burleson, TX
Flood risk 1/10 · Minimal
- FEMA flood zone
- X (unshaded)
- Chance of flooding over 30 yrs
- 0.0%
- Est. flood insurance / yr
- $507 – $1,088
Fire risk 6/10 · Moderate
- Est. fire insurance / yr
- $1,222 – $2,270
Heat risk 6/10 · Moderate
- Hot days now (above 109°F)
- 6 days/yr
- Hot days in 30 yrs
- 20 days/yr
Wind risk 6/10 · Moderate
- Chance of severe wind over 30 yrs
- 27.0%
Air-quality risk 2/10 · Minimal
- Unhealthy air days now
- 1 days/yr
- Unhealthy air days in 30 yrs
- 2 days/yr
Risk factors via First Street. Map © Google.
Why this score? — see what drove the C- grade
The composite is a weighted blend of 9 inputs, each scored 0–100. Each bar is that input's sub-score; the figure is the points it added to the 100-point composite (weight × sub-score).
- Cash flow +19.4/30.0
- ARV discount +11.5/15.0
- DSCR +6.1/10.0
- 1% rule +4.4/10.0
- Livability +4.0/5.0
- Schools +3.2/10.0
- Rent growth +2.5/5.0
- Condition / age +2.5/5.0
- Appreciation +0.0/10.0
$222,000
🖨 Deal sheet (PDF) 📄 Offer letter ✓ Due diligence
Listing remarks MLS
Seller is motivated!! This home is on a beautiful, corner lot with many trees! 3 bedroom, 2 bath and an open floor plan. Nice wood flooring in kitchen and utility room. Kitchen has tons of cabinet space and a beautiful built in Hutch. Spacious living room and kitchen. Sip coffee on the Large covered deck and view the nice country setting. Highly sought after Godley school district. Sold as-is. Seller does not have a survey. Buyer to purchase new one.
Key facts
- Wood flooring
- Open floor plan
- Built in hutch
Tags
Neighborhood map
What this means for you Summary
Snapshot
- This is a 3-bed/2.0-bath manufactured listed at $222k.
Deal economics
- At list price, monthly cash flow is $249 ($3k/yr) — positive.
- The deal already cash-flows at list — no discount required.
- To meet the 1% rule (rent ≥ 1% of price), the offer needs to be $208k (6.3% below list).
- Recommended offer: $202k (9.0% below list) — sets the bar for market timing.
- Cap rate 7.6% vs local median 3.5% in Burleson — top-decile yield for the area; either an underpriced asset or a hidden risk that comps aren't pricing in. Stress-test before assuming the spread holds.
Location & tenants
- Location reads 79/100 on livability (#53 in TX, #2,133 nationally) — a middle-class / working-renter tenant base. Strengths: employment A+, cost of living A+, housing A+; Watch: amenities F, commute F.
- Godley ISD (rural): math 34% / reading 38% proficiency, ranked #466 of 826 in TX (top 56%) — families likely to look elsewhere, expect single-tenant / working-renter base with shorter leases.
- Zoned schools: Legacy El (math 39% / reading 37%, grade F, #1,709 of 4,322 statewide, top 40%, 408 students, 32% FRL); Godley H S (math 27% / reading 51%, grade F, #859 of 1,632 statewide, top 53%, 777 students, 42% FRL).
- Market conditions: 421 active listings in the ZIP; 2,152 units permitted in Johnson County in 2024 (76 in 5+ unit buildings).
Forward outlook
- Local home prices are declining (-3.0%/yr); year-one equity from $2k of loan paydown is wiped out by about $7k of value loss. Plan a longer hold.
- Johnson County population projected at +24% by 2050 — long-run rental-demand tailwind backs the buy-and-hold thesis.
Negotiation context
- It's been on market 97 days — a 9% lower offer ($202k) is reasonable based on typical stale-listing flexibility.
- 2 sale attempts with the ask held roughly flat each time — persistent listings suggest the price (not the market) is what's stuck; bring a comps-based counter.
Risks & watch-outs
- Climate carrying-cost: major wind risk, 27% chance of damaging wind over 30y; major wildfire risk; extreme-heat days projected 6→20/yr by 2055 (HVAC capex compounding) — expect insurance premiums to compound above CPI over the hold.
Questions for the listing agent
- It's been on market 97 days. Have you received any prior offers? Is the seller open to a 9% concession, seller financing, or rate buy-down credit?
- Why hasn't it sold? Are there any deal-killer items the seller is aware of (foundation, flood, title, zoning, code violations)?
- Is there a deadline driving the sale (1031 exchange, divorce, estate, relocation)? That informs how much negotiation room exists.
- What's the average days-on-market for RENTAL listings here right now (not sales)? A rising rental-DOM trend means longer vacancies and softer asking-rent achievability than the comps imply.
- What's the recent tenant-quality profile in this submarket — average credit score on applications, eviction rate, late-payment / NSF rate, and stable-employment percentage? A property-management company in the area should have these aggregated.
- How much new for-sale + rental construction is in the pipeline within 1–3 miles? Heavy new supply typically softens prices + rents 12–24 months out; constrained supply supports both.
Investment metrics
- 1% rule
- 0.94% ✗
- Cap rate
- 7.64%
- Cash-on-cash
- 4.81%
- DSCR
- 1.21
- GRM
- 8.9
CMA / ARV
- ARV (median comp)
- $243,715
- List price
- $222,000
- Delta
- -8.91%
- Verdict
- FAIR
- Comps
- 20 within 1.0 mi
Show comp detail 4 sales within ~0.75 mi
| Address | Dist | Beds/Ba | Sqft | Sold | Price | $/sf | Match |
|---|---|---|---|---|---|---|---|
| 6017 Black Springs Ln | 0.57mi | 3/2.0 | 1,680 (0%) | 1mo | $235,000 | $140 | 73 |
| 6112 Wild Berry Trl | 0.40mi | 4/2.0 (+1) | 1,756 (+4%) | 6mo | $315,000 | $179 | 64 |
| 2908 Berry Patch Ln | 0.26mi | 4/2.0 (+1) | 1,456 (-13%) | 15mo | $245,000 | $168 | 48 |
| 5921 Black Springs Ln | 0.63mi | 4/2.0 (+1) | 1,904 (+13%) | 7mo | $260,000 | $137 | 38 |
Match score weights: distance 35% · size 25% · config 20% · recency 20%. Top-matched comps best support the ARV.
Projected returns pro-forma
-3.0% appreciation · 3.0% rent growth · sell at horizon
- IRR
- -8.8%
- Equity multiple
- 0.68×
- Total profit
- $-20,173
- Equity at exit
- $33,101
- IRR
- 0.6%
- Equity multiple
- 1.04×
- Total profit
- $2,627
- Equity at exit
- $19,195
Cash invested: $62,160 (down + closing). Projections, not guarantees.
Landlord ↔ Tenant lean methodology
- Overall (STATE)
- 87 Strongly Landlord-Friendly
- State Texas
- 87 Strongly Landlord-Friendly · R+5
- County
- — inherits STATE
- City
- — inherits STATE
ZIP-level market 76058
- Home prices YoY
- -24.5%
- Active inventory
- 421
- Price-to-rent
- 8.9×
Monthly cashflow live
- Estimated rent
- $2,080 medium interval (Pro) →
- Mortgage (P&I)
- −$1,164
- Tax from tax record
- −$138 /mo · $1,654/yr
- Insurance
- −$92
- HOA
- −$0
- Vacancy / Maint / Mgmt
- −$437
- Net cashflow
- $249
Break-even live
Sensitivity live
| Price | -10% $375 | -5% $312 | +0% $249 | +5% $186 | +10% $123 |
|---|---|---|---|---|---|
| Rent | -10% $85 | -5% $167 | +0% $249 | +5% $331 | +10% $413 |
| Rate | -1.0pp $361 | -0.5pp $305 | base $249 | +0.5pp $191 | +1.0pp $133 |
UW: 25.0% down · 7.5% · 30yr · 1.5% tax · 5.0% vac · 8.0% maint · 8.0% mgmt
Financing live
Cash to close
- Down payment
- $55,500
- Closing costs
- $6,660
- Reserves months
- —
- Total cash needed
- —
Loan-product check · same deal, 3 products live
Conventional
25% down · 7.5% · 30yr
- Down + closing
- —
- Monthly P&I
- —
- Monthly cashflow
- —
- DSCR
- —
- Eligible?
- —
Personal DTI + credit; lowest rate.
DSCR
20% down · 8.5% · 30yr
- Down + closing
- —
- Monthly P&I
- —
- Monthly cashflow
- —
- DSCR
- —
- Eligible?
- —
No personal income docs; deal must DSCR.
Hard money
10% down · 12.0% · 12mo
- Down + closing
- —
- Monthly P&I
- —
- Monthly cashflow
- —
- DSCR
- —
- Eligible?
- —
Short-term bridge; refi at stabilization.
Listing history 23 events
-
2026-06-21days on market $222,000 Active 97 DOM
-
2026-06-18days on market $222,000 Active 94 DOM
-
2026-06-17days on market $222,000 Active 93 DOM
-
2026-06-16days on market $222,000 Active 92 DOM
-
2026-06-15days on market $222,000 Active 91 DOM
-
2026-06-13days on market $222,000 Active 89 DOM
-
2026-06-13days on market $222,000 Active 88 DOM
-
2026-06-09days on market $222,000 Active 85 DOM
-
2026-06-08days on market $222,000 Active 84 DOM
-
2026-06-07remarks 551-char remark
-
2026-06-07days on market $222,000 Active 83 DOM
-
2026-06-04days on market $222,000 Active 80 DOM
-
2026-06-03days on market $222,000 Active 79 DOM
-
2026-06-02days on market $222,000 Active 78 DOM
-
2026-06-01days on market $222,000 Active 77 DOM
-
2026-05-31days on market $222,000 Active 76 DOM
-
2026-04-15price $222,000 455-char remark
Show marketing remark (455 chars)
Seller is motivated!! This home is on a beautiful, corner lot with many trees! 3 bedroom, 2 bath and an open floor plan. Nice wood flooring in kitchen and utility room. Kitchen has tons of cabinet space and a beautiful built in Hutch. Spacious living room and kitchen. Sip coffee on the Large covered deck and view the nice country setting. Highly sought after Godley school district. Sold as-is. Seller does not have a survey. Buyer to purchase new one.
-
2026-04-09price $224,900 455-char remark
Show marketing remark (455 chars)
Seller is motivated!! This home is on a beautiful, corner lot with many trees! 3 bedroom, 2 bath and an open floor plan. Nice wood flooring in kitchen and utility room. Kitchen has tons of cabinet space and a beautiful built in Hutch. Spacious living room and kitchen. Sip coffee on the Large covered deck and view the nice country setting. Highly sought after Godley school district. Sold as-is. Seller does not have a survey. Buyer to purchase new one.
-
2026-04-09status Active 455-char remark
Show marketing remark (455 chars)
Seller is motivated!! This home is on a beautiful, corner lot with many trees! 3 bedroom, 2 bath and an open floor plan. Nice wood flooring in kitchen and utility room. Kitchen has tons of cabinet space and a beautiful built in Hutch. Spacious living room and kitchen. Sip coffee on the Large covered deck and view the nice country setting. Highly sought after Godley school district. Sold as-is. Seller does not have a survey. Buyer to purchase new one.
-
2026-04-05historical Active Option Contract 455-char remark
Show marketing remark (455 chars)
Seller is motivated!! This home is on a beautiful, corner lot with many trees! 3 bedroom, 2 bath and an open floor plan. Nice wood flooring in kitchen and utility room. Kitchen has tons of cabinet space and a beautiful built in Hutch. Spacious living room and kitchen. Sip coffee on the Large covered deck and view the nice country setting. Highly sought after Godley school district. Sold as-is. Seller does not have a survey. Buyer to purchase new one.
-
2026-03-13$229,000 Active 455-char remark
Show marketing remark (455 chars)
Seller is motivated!! This home is on a beautiful, corner lot with many trees! 3 bedroom, 2 bath and an open floor plan. Nice wood flooring in kitchen and utility room. Kitchen has tons of cabinet space and a beautiful built in Hutch. Spacious living room and kitchen. Sip coffee on the Large covered deck and view the nice country setting. Highly sought after Godley school district. Sold as-is. Seller does not have a survey. Buyer to purchase new one.
-
2025-10-31soldstatus
-
1997-06-27soldstatus
ⓘ Source: listings_history table (triggers on properties + properties_extension) + one-shot
backfill from property_details.listing_events for pre-trigger history.
Tax reassessment forecast TX · Resets to sale price
- Current annual tax
- $1,654 · $138/mo
- Projected year-2 tax
- $4,063 · $339/mo
- Expected delta
- +$2,408/yr (+$201/mo · 145.6%)
ⓘ Screening estimate from a state-policy table — verify with the county assessor before closing.
Climate risk First Street
- Flood 1/10 Low FEMA zone X (unshaded) · 0% chance over 30 yrs
- Wildfire 6/10 Major
- Heat 6/10 Major 6 d/yr ≥109°F today · 20 d/yr by 30 yrs out
- Wind 6/10 Major 27% chance of damaging wind over 30 yrs
- Air quality 2/10 Low 1 unhealthy d/yr today · 2 by 30 yrs out
Nearby sold comps map
Loading sold comps map…
Walkable amenities ~0.75 mi
Loading nearby amenities…
Taxation est. · year 1
- Rental income
- $24,964
- − Mortgage interest
- −$12,435
- − Property taxes
- −$1,654
- − Insurance
- −$1,110
- − Repairs & maintenance
- −$1,997
- − Management
- −$1,997
- − Depreciation
- −$6,458
- Taxable loss
- −$688
- Est. tax savings @ 24.0%
- +$165
- After-tax cash flow
- $3,152/yr
For passive investors: Depreciation is non-cash, so a rental often shows a tax loss while cash-flowing — sheltering income. Rental losses are passive: they offset passive income freely, and up to $25,000/yr can offset ordinary (W-2) income if you actively participate and your MAGI is under $100k (phasing out to $0 by $150k); unused losses carry forward. On sale, claimed depreciation is recaptured at up to 25%, and gains may owe capital-gains tax (a 1031 exchange can defer both). Figures are a year-1 estimate at your 24.0% rate — not tax advice; consult a CPA.
Schools (NCES district)
- District
- Godley ISD
- NCES district ID
- 4820960
- Math proficiency
- 34% ▼ -4.00%
- Reading proficiency
- 38% ▲ 2.00%
- Median HH income
- $59,332
- Composite
- 32.06/100
- National rank
- #5820
- State rank
- #466 of 826 in TX
Livability — Burleson
- Score
- 79/100
- State rank
- #53
- US rank
- #2133
Category grades
Schools grade is shown separately in the Schools card above.
Census & demographics
- City population
- 81,549
- Population (ZIP)
- 21,531
Population outlook (Johnson County) Hauer SSP2
- Today (2025)
- 179,678 people
- By 2030
- 189,208 · +5.3%
- By 2040
- 207,261 · +15.4%
- By 2050
- 223,064 · +24.1%
- By 2075
- 259,979 · +44.7%
- By 2100
- 275,395 · +53.3%
Race, ethnicity, and origin ACS 2023
- Neighborhood character
- Predominantly White (67%)
- Race & ethnicity
- White 67% Hispanic / Latino 28% Two or more races 11% Black 2%
- Hispanic origin (detail)
- Mexican 26%
- Common ancestry
- Italian 2% Slovak 2% Portuguese 1%
- Foreign-born
- 7% · Canada
- Languages at home
- 80% English-only · Spanish 18% German/W. Germanic 1%
Political lean MEDSL · Johnson
- 2024 margin
- Solid R (+51.4) · D 23.9% · R 75.3%
- 2008→2024 swing
- -3.9pp toward R · 2008: -47.5pp · 2024: -51.4pp
- All cycles
- 2024: R+51.4 2020: R+53.0 2016: R+58.3 2012: R+55.6 2008: R+47.5
Not yet ingested
- Civics
- —
Market trends
- HPI YoY
- ▼ -86.22%
- Current HPI
- 265.6513
- Rent YoY
- —
- Metro
- —
- State GDP YoY
- ▲ 3.95%
- F500 in state
- 110
Industry mix (Fortune 500 HQ in TX)
| Industry | F500 HQs | Revenue |
|---|---|---|
| Energy | 16 | $1,198B |
|
||
| Technology | 5 | $198B |
|
||
| Engineering / Construction | 4 | $72B |
|
||
| Energy Services | 3 | $60B |
|
||
| Utilities | 3 | $41B |
|
||
| Healthcare | 2 | $330B |
|
||
Price history
-3.1% since first listed7 events — show timeline
- 2026-04-15 Price Changed $222,000 NTREIS
- 2026-04-09 Price Changed $224,900 NTREIS
- 2026-04-09 Relisted — NTREIS
- 2026-04-05 Contingent — NTREIS
- 2026-03-13 Listed $229,000 NTREIS
- 2025-10-31 Sold (Public Records) — Public Records
- 1997-06-27 Sold (Public Records) — Public Records
Property tax history
+3.7%/yrLatest (2025): $1,654 · +10.4% YoY. Source: county tax records.
Cash-flow waterfall
monthlySold comps — $/sqft
last 12 mo · ≤1 miLoading sold comps…