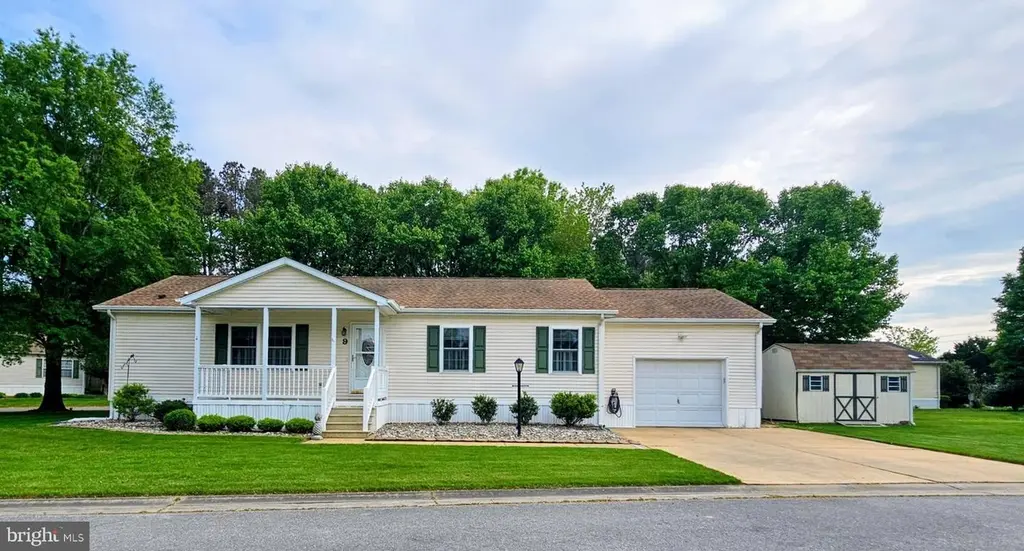
9 Victoria Ct · Easton, MD
Flood risk No data
- FEMA flood zone
- —
- Chance of flooding over 30 yrs
- —
- Est. flood insurance / yr
- —
Fire risk No data
- Est. fire insurance / yr
- —
Heat risk No data
- Hot days now (above threshold)
- —
- Hot days in 30 yrs
- —
Wind risk No data
- Chance of severe wind over 30 yrs
- —
Air-quality risk No data
- Unhealthy air days now
- —
- Unhealthy air days in 30 yrs
- —
Risk factors via First Street. Map © Google.
Why this score? — see what drove the D grade
The composite is a weighted blend of 9 inputs, each scored 0–100. Each bar is that input's sub-score; the figure is the points it added to the 100-point composite (weight × sub-score).
- Cash flow +18.1/30.0
- DSCR +5.7/10.0
- 1% rule +4.9/10.0
- Condition / age +3.8/5.0
- Livability +3.6/5.0
- ARV discount +2.9/15.0
- Rent growth +2.5/5.0
- Schools +2.3/10.0
- Appreciation +0.0/10.0
$199,900
🖨 Deal sheet 📄 Offer letter ✓ Due diligence
Listing remarks
This inviting ranch-style residence features two spacious bedrooms and two full bathrooms, including a walk-in shower for added convenience. The open floor plan seamlessly connects the kitchen and dining areas, enhanced by natural light from skylights and window treatments. Enjoy modern living with stainless steel appliances, including a gas range and gas, tankless water heater. Outside, the corner lot offers easy access to sidewalks and community amenities, including a refreshing pool. The attached garage provides additional storage as does the 10x14 shed, while the driveway accommodates extra parking. Hyde Park is a vibrant community with nearby parks, walking trails, and local shops, fos
Key facts
- Garage
- Community pool
- Built 1999
Property features AI
Finance
- Other: Ownership is ground rent; Property condition rated very good; Income/expense list includes annual ground rent
- Financial info: Monthly ground rent payment
- HOA & community: Senior community (age requirement: 53+); Pets allowed with breed and number restrictions; Ground rent exists (paid monthly)
Exterior
- Parking: Attached garage with front entry and additional storage; One garage space (one attached); Driveway with two parking spaces; Total of three garage and parking spaces
- Utilities: Public water; Public sewer; Propane for hot water; Municipal trash service
- Home design: Manufactured home (double wide); Single-story (entry-level bedroom); Estimated year built
- Construction: Vinyl siding; Above-grade structure
- Exterior features: Sidewalks; Outbuilding(s); Corner lot; Community pool
Interior
- Kitchen: Gas range / oven; Range hood; Dishwasher; Refrigerator; Stainless steel appliances; Exhaust fan
- Bedrooms: Two main-level bedrooms
- Flooring: Carpet
- Bathrooms: Two full bathrooms with a walk-in shower in the master
- Heating & cooling: Heat pump with electric backup; Electric heating and propane-owned fuel options; Central air conditioning; Ceiling fans
- Interior features: Open floor plan; Combination kitchen and dining area; Skylights; Window treatments; Attic; Walk-in shower; Entry-level bedroom
- Laundry & utility: Electric dryer; Laundry room
Neighborhood map
What this means for you Summary
Snapshot
- This is a 2-bed/2.0-bath single-family listed at $200k. Condition is rated good.
Deal economics
- At list price, monthly cash flow is $175 ($2k/yr) — positive.
- The deal already cash-flows at list — no discount required.
- To meet the 1% rule (rent ≥ 1% of price), the offer needs to be $197k (1.5% below list).
- Recommended offer: $197k (1.5% below list) — sets the bar for 1% rule.
- Cap rate 7.3% vs local median 3.8% in Easton — top-decile yield for the area; either an underpriced asset or a hidden risk that comps aren't pricing in. Stress-test before assuming the spread holds.
Location & tenants
- Location reads 71/100 on livability (#154 in MD) — a middle-class / working-renter tenant base. Strengths: health & safety A+, housing A-, employment B+; Watch: amenities C-, schools D, crime D.
- Talbot County Public Schools (town): math 15% / reading 35% proficiency, ranked #12 of 24 in MD (top 50%) — low school quality limits family demand, transient renter base, plan for 1-2y turnover.
- Market conditions: 207 active listings in the ZIP; solid renter incomes; 158 units permitted in Talbot County in 2024 (0 in 5+ unit buildings).
Forward outlook
- Local home prices are declining (-3.0%/yr); year-one equity from $1k of loan paydown is wiped out by about $6k of value loss. Plan a longer hold.
- Talbot County population projected at -10% by 2050 — secular population decline; favor cash flow + early exit over multi-decade hold.
Negotiation context
- Only 14 days on market — expect competitive offers; lowballing is unlikely to land.
Questions for the listing agent
- Is there a deadline driving the sale (1031 exchange, divorce, estate, relocation)? That informs how much negotiation room exists.
- Schools are D-rated, which usually means shorter tenancies and higher turnover. Who's the typical renter profile here, and what's been the actual vacancy rate?
- Crime grade is D in this area — have there been break-ins, vandalism, or insurance claims at this property in the last 3 years? What carrier currently insures it and at what premium?
- The area grade is low — what's the realistic commute time and amenity access for the typical tenant pool here? Any planned neighborhood developments (good or bad) we should know about?
- What's the average days-on-market for RENTAL listings here right now (not sales)? A rising rental-DOM trend means longer vacancies and softer asking-rent achievability than the comps imply.
- What's the recent tenant-quality profile in this submarket — average credit score on applications, eviction rate, late-payment / NSF rate, and stable-employment percentage? A property-management company in the area should have these aggregated.
- How much new for-sale + rental construction is in the pipeline within 1–3 miles? Heavy new supply typically softens prices + rents 12–24 months out; constrained supply supports both.
Investment metrics
- 1% rule
- 0.99% ✗
- Cap rate
- 7.34%
- Cash-on-cash
- 3.74%
- DSCR
- 1.17
- GRM
- 8.5
CMA / ARV
- ARV (median comp)
- $181,436
- List price
- $199,900
- Delta
- 10.18%
- Verdict
- OVERPRICED
- Comps
- 20 within 1.0 mi
Show comp detail 6 sales within ~0.75 mi
| Address | Dist | Beds/Ba | Sqft | Sold | Price | $/sf | Match |
|---|---|---|---|---|---|---|---|
| 20 Downing St | 0.25mi | 2/2.0 | 1,492 (+1%) | 1mo | $149,000 | $100 | 86 |
| 26 Kensington Dr | 0.10mi | 3/2.0 (+1) | 1,456 (-2%) | 13mo | $212,500 | $146 | 77 |
| 6 Downing St | 0.19mi | 2/2.0 | 1,400 (-5%) | 10mo | $130,000 | $93 | 74 |
| 69 Park Ln | 0.29mi | 2/2.0 | 1,288 (-13%) | 14mo | $146,000 | $113 | 53 |
| 29329 Clearview Rd | 0.31mi | 3/1.5 (+1) | 1,296 (-12%) | 20mo | $320,000 | $247 | 42 |
| 9388 Centreville Rd | 0.52mi | 2/1.0 | 1,282 (-13%) | 22mo | $180,000 | $140 | 32 |
Match score weights: distance 35% · size 25% · config 20% · recency 20%. Top-matched comps best support the ARV.
Projected returns pro-forma
-3.0% appreciation · 3.0% rent growth · sell at horizon
- IRR
- -10.4%
- Equity multiple
- 0.62×
- Total profit
- $-21,238
- Equity at exit
- $29,806
- IRR
- -1.1%
- Equity multiple
- 0.93×
- Total profit
- $-4,048
- Equity at exit
- $17,284
Cash invested: $55,972 (down + closing). Projections, not guarantees.
Landlord ↔ Tenant lean methodology
- Overall (STATE)
- 27 Tenant-Leaning
- State Maryland
- 27 Tenant-Leaning · D+14
- County
- — inherits STATE
- City
- — inherits STATE
ZIP-level market 21601
- Home prices YoY
- -31.0%
- Active inventory
- 207
- Price-to-rent
- 8.5×
Monthly cashflow live
- Estimated rent
- $1,970 medium interval (Pro) →
- Mortgage (P&I)
- −$1,048
- Tax est. 1.5%
- −$250 /mo · $2,998/yr
- Insurance
- −$83
- HOA
- −$0
- Vacancy / Maint / Mgmt
- −$414
- Net cashflow
- $175
Break-even live
UW: 25.0% down · 7.5% · 30yr · 1.5% tax · 5.0% vac · 8.0% maint · 8.0% mgmt
Financing live
Cash to close
- Down payment
- $49,975
- Closing costs
- $5,997
- Reserves months
- —
- Total cash needed
- —
Loan-product check · same deal, 3 products live
Conventional
25% down · 7.5% · 30yr
- Down + closing
- —
- Monthly P&I
- —
- Monthly cashflow
- —
- DSCR
- —
- Eligible?
- —
Personal DTI + credit; lowest rate.
DSCR
20% down · 8.5% · 30yr
- Down + closing
- —
- Monthly P&I
- —
- Monthly cashflow
- —
- DSCR
- —
- Eligible?
- —
No personal income docs; deal must DSCR.
Hard money
10% down · 12.0% · 12mo
- Down + closing
- —
- Monthly P&I
- —
- Monthly cashflow
- —
- DSCR
- —
- Eligible?
- —
Short-term bridge; refi at stabilization.
Listing history 2 events
-
2026-05-06$199,900 Active 921-char remark
-
2026-04-26historical $199,900 921-char remark
ⓘ Source: listings_history table (triggers on properties + properties_extension) + one-shot
backfill from property_details.listing_events for pre-trigger history.
Nearby sold comps map
Loading sold comps map…
Walkable amenities ~0.75 mi
Loading nearby amenities…
Taxation est. · year 1
- Rental income
- $23,637
- − Mortgage interest
- −$11,198
- − Property taxes
- −$2,998
- − Insurance
- −$1,000
- − Repairs & maintenance
- −$1,891
- − Management
- −$1,891
- − Depreciation
- −$5,815
- Taxable loss
- −$1,155
- Est. tax savings @ 24.0%
- +$277
- After-tax cash flow
- $2,373/yr
For passive investors: Depreciation is non-cash, so a rental often shows a tax loss while cash-flowing — sheltering income. Rental losses are passive: they offset passive income freely, and up to $25,000/yr can offset ordinary (W-2) income if you actively participate and your MAGI is under $100k (phasing out to $0 by $150k); unused losses carry forward. On sale, claimed depreciation is recaptured at up to 25%, and gains may owe capital-gains tax (a 1031 exchange can defer both). Figures are a year-1 estimate at your 24.0% rate — not tax advice; consult a CPA.
Condition & rehab AI · 1 photo
This well-maintained ranch-style home in a vibrant community offers a good investment opportunity with minimal needed repairs and updates.
Value-add opportunities
- Resale Paint exterior trim — Fresh paint enhances curb appeal and home value
- Both Replace window treatments — Updated window treatments improve aesthetics and energy efficiency
- Both Install smart home devices — Modern technology enhances convenience and marketability
Renovation cost estimate screening
Value-add ROI direction
- Resale Paint exterior trim — Fresh paint enhances curb appeal and home value ↑
- Both Replace window treatments — Updated window treatments improve aesthetics and energy efficiency ↑
- Both Install smart home devices — Modern technology enhances convenience and marketability ↑
ⓘ Cost ranges are severity-bucket heuristics (US national rule-of-thumb). Get contractor quotes + a written scope before underwriting a rehab budget.
Schools (NCES district)
- District
- Talbot County Public Schools
- NCES district ID
- 2400630
- Math proficiency
- 15% ▼ -19.00%
- Reading proficiency
- 35% ▼ -10.00%
- Median HH income
- $61,786
- Composite
- 23.11/100
- National rank
- #7961
- State rank
- #12 of 24 in MD
Livability — Easton
- Score
- 71/100
- State rank
- #154
- US rank
- #6882
Category grades
Schools grade is shown separately in the Schools card above.
Census & demographics
- Census place
- Easton, MD
- County
- Talbot County · 24,671 people
- City population
- 24,671
- Metro
- Easton, MD
- Population (ZIP)
- 24,671
- Household income
- $83,680
- Rent vs Own
- Severe rent burden
- 771.0
Population outlook (Talbot County) Hauer SSP2
- Today (2025)
- 36,811 people
- By 2030
- 36,305 · -1.4%
- By 2040
- 34,818 · -5.4%
- By 2050
- 32,982 · -10.4%
- By 2075
- 29,631 · -19.5%
- By 2100
- 25,767 · -30.0%
Race, ethnicity, and origin ACS 2023
- Neighborhood character
- Predominantly White (71%)
- Race & ethnicity
- White 71% Black 14% Hispanic / Latino 10% Two or more races 6% Asian 1%
- Hispanic origin (detail)
- Mexican 2%
- Common ancestry
- Lithuanian 4% Romanian 3% Slovak 2%
- Foreign-born
- 9% · Canada, Guatemala
- Languages at home
- 89% English-only · Spanish 8% Other Indo-European 2%
Political lean MEDSL · Talbot
- 2024 margin
- Toss-up / Even · D 49.0% · R 49.1% · Other 1.9%
- 2008→2024 swing
- +9.6pp toward D · 2008: -9.6pp · 2024: -0.0pp
- All cycles
- 2024: R+0.0 2020: D+0.5 2016: R+11.9 2012: R+13.2 2008: R+9.6
Not yet ingested
- Civics
- —
Market trends
- HPI YoY
- ▼ -103.01%
- Current HPI
- 229.2902
- Rent YoY
- —
- Metro
- Easton, MD
- State GDP YoY
- ▲ 2.97%
- F500 in state
- 12
Industry mix (Fortune 500 HQ in MD)
| Industry | F500 HQs | Revenue |
|---|---|---|
| Aerospace / Defense | 1 | $71B |
|
||
| Utilities | 1 | $25B |
|
||
| Hotels | 1 | $24B |
|
||
| Consumer Goods | 1 | $7B |
|
||
| Real Estate | 1 | $6B |
|
||
| Chemicals | 1 | $2B |
|
||
Price history
+0.0% since first listed3 events — show timeline
- 2026-05-21 Pending — BRIGHT MLS
- 2026-05-06 Listed $199,900 BRIGHT MLS
- 2026-04-26 Coming Soon $199,900 BRIGHT MLS
Cash-flow waterfall
monthlySold comps — $/sqft
last 12 mo · ≤1 miLoading sold comps…