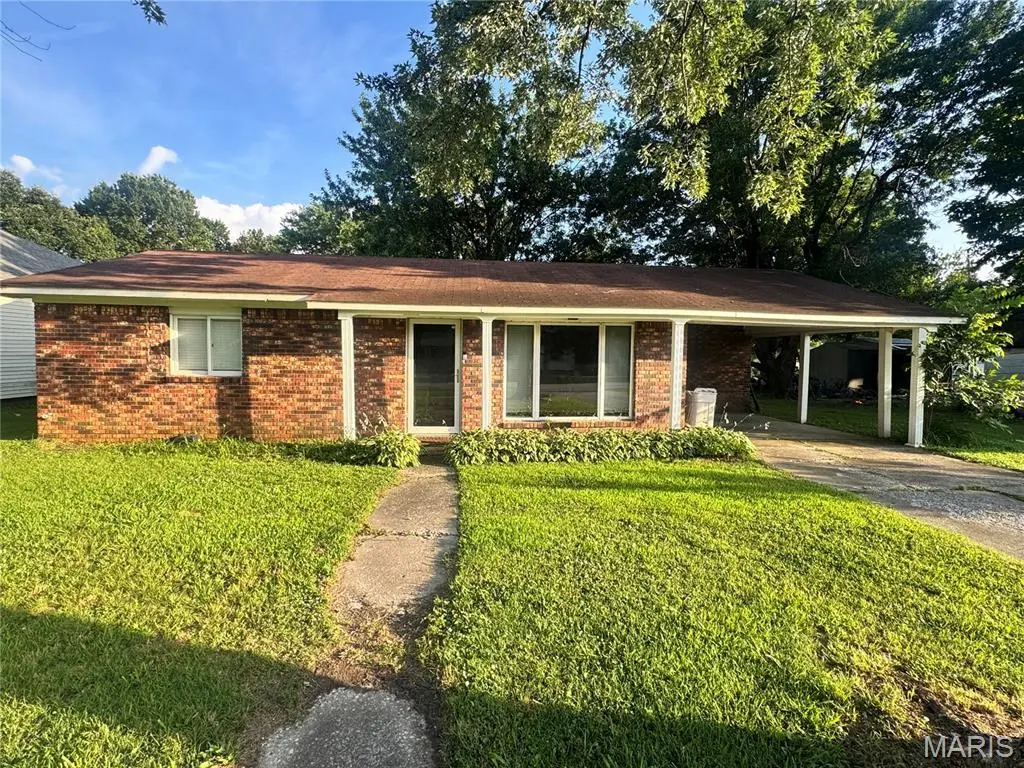
114 E Phillips Ave · Lilbourn, MO
Flood risk 1/10 · Minimal
- FEMA flood zone
- X
- Chance of flooding over 30 yrs
- 0.0%
- Est. flood insurance / yr
- $507 – $1,088
Fire risk 1/10 · Minimal
- Est. fire insurance / yr
- $1,054 – $1,958
Heat risk 6/10 · Moderate
- Hot days now (above 108°F)
- 7 days/yr
- Hot days in 30 yrs
- 21 days/yr
Wind risk 4/10 · Minor
- Chance of severe wind over 30 yrs
- 7.0%
Air-quality risk 1/10 · Minimal
- Unhealthy air days now
- 0 days/yr
- Unhealthy air days in 30 yrs
- 0 days/yr
Risk factors via First Street. Map © Google.
Why this score? — see what drove the B grade
The composite is a weighted blend of 9 inputs, each scored 0–100. Each bar is that input's sub-score; the figure is the points it added to the 100-point composite (weight × sub-score).
- Cash flow +30.0/30.0
- 1% rule +10.0/10.0
- DSCR +10.0/10.0
- ARV discount +7.5/15.0
- Appreciation +4.6/10.0
- Livability +3.1/5.0
- Rent growth +2.5/5.0
- Condition / age +2.5/5.0
- Schools +2.1/10.0
$49,900
🖨 Deal sheet 📄 Offer letter ✓ Due diligence
Listing remarks
Affordable opportunity in the heart of Lilbourn. This approximately 1,153-square-foot home offers comfortable living space, a functional floor plan, and excellent potential for homeowners or investors alike. The property features a brick exterior, central heating and cooling, multiple bedrooms, and a spacious living area designed for everyday living. A covered carport provides convenient parking and additional protection from the elements. Situated on a residential lot in an established neighborhood, this property offers easy access to local amenities while maintaining the charm of small-town living. Whether you are looking for a primary residence, rental property, or investment opportunity
Key facts
- Residential lot
- Brick exterior
- Covered carport
Tags
Property features AI
Finance
- Other: Living area reported as 1,153 (per assessor)
Exterior
- Parking: Carport with 1 space
- Utilities: Public water; Public sewer; Single phase electric; Cable connected, electricity connected, water connected, sewer connected
- Home design: Single family residence; One story; Residential property
- Construction: Brick veneer and frame construction; Architectural shingle roof; Slab foundation; Built year per assessor
- Exterior features: Front yard and back yard; Paved lot
Interior
- Kitchen: Microwave, Free-Standing Electric Range, Refrigerator, Dishwasher not listed
- Bedrooms: 2 bedrooms (both on the main level)
- Bathrooms: 1 full bathroom (main level)
- Heating & cooling: Electric heating; Central air conditioning
- Interior features: Electric heating; Central air; Dryer, Washer, Microwave, Free-Standing Electric Range, Refrigerator, Electric water heater
- Laundry & utility: Washer and Dryer included
Neighborhood map
What this means for you Summary
Snapshot
- This is a 2-bed/1.0-bath other listed at $50k.
Deal economics
- At list price, monthly cash flow is $376 ($5k/yr) — positive.
- The deal already cash-flows at list — no discount required.
- Meets the 1% rule at list price ($913 rent vs $50k).
Location & tenants
- Location reads 62/100 on livability (#402 in MO) — a middle-class / working-renter tenant base. Strengths: cost of living A+, housing A+, crime B+; Watch: health & safety C-, amenities F, commute F.
- New Madrid County R-I (rural): math 20% / reading 31% proficiency, ranked #291 of 324 in MO (top 90%) — low school quality limits family demand, transient renter base, plan for 1-2y turnover; 63% free/reduced lunch — lower-income household profile, screen leases tightly.
- Zoned schools: Lilbourn Elementary (math 8% / reading 17%, grade F, #1,007 of 1,115 statewide, top 91%, 236 students, 100% FRL); Central High School (math 2% / reading 32%, grade F, #483 of 521 statewide, top 93%, 400 students, 100% FRL) — zoned schools average 100% FRL vs 63% district-wide (37 pts higher); higher-poverty schools than district average — tighter screening recommended.
- Market conditions: 3 active listings in the ZIP; 11 units permitted in New Madrid County in 2024 (0 in 5+ unit buildings).
Forward outlook
- Local home prices are declining (-0.7%/yr); year-one equity from $345 of loan paydown is wiped out by about $352 of value loss. Plan a longer hold.
- New Madrid County population projected at -25% by 2050 — secular population decline; favor cash flow + early exit over multi-decade hold.
- At projected returns (-0.7% appreciation + 3.0% rent growth), your $14k cash investment doubles in ~3 years — after that, you're playing with house money.
Negotiation context
- Only 4 days on market — expect competitive offers; lowballing is unlikely to land.
Risks & watch-outs
- Climate carrying-cost: extreme-heat days projected 7→21/yr by 2055 (HVAC capex compounding) — expect insurance premiums to compound above CPI over the hold.
Questions for the listing agent
- Built in 1977 — when were the roof, HVAC, electrical panel, plumbing, and water heater last replaced?
- Is there a deadline driving the sale (1031 exchange, divorce, estate, relocation)? That informs how much negotiation room exists.
- Schools are F-rated, which usually means shorter tenancies and higher turnover. Who's the typical renter profile here, and what's been the actual vacancy rate?
- What's the average days-on-market for RENTAL listings here right now (not sales)? A rising rental-DOM trend means longer vacancies and softer asking-rent achievability than the comps imply.
- What's the recent tenant-quality profile in this submarket — average credit score on applications, eviction rate, late-payment / NSF rate, and stable-employment percentage? A property-management company in the area should have these aggregated.
- How much new for-sale + rental construction is in the pipeline within 1–3 miles? Heavy new supply typically softens prices + rents 12–24 months out; constrained supply supports both.
Investment metrics
- 1% rule
- 1.83% ✓
- Cap rate
- 15.34%
- Cash-on-cash
- 32.32%
- DSCR
- 2.44
- GRM
- 4.6
CMA / ARV
No comps found within radius.
Projected returns pro-forma
-0.71% appreciation · 3.0% rent growth · sell at horizon
- IRR
- 31.7%
- Equity multiple
- 2.50×
- Total profit
- $20,890
- Equity at exit
- $12,753
- IRR
- 36.1%
- Equity multiple
- 4.86×
- Total profit
- $53,869
- Equity at exit
- $14,004
Cash invested: $13,972 (down + closing). Projections, not guarantees.
Landlord ↔ Tenant lean methodology
- Overall (STATE)
- 81 Strongly Landlord-Friendly
- State Missouri
- 81 Strongly Landlord-Friendly · R+10
- County
- — inherits STATE
- City
- — inherits STATE
ZIP-level market 63862
- Home prices YoY
- -0.3%
- Active inventory
- 3
- Price-to-rent
- 4.6×
Monthly cashflow live
- Estimated rent
- $913 medium interval (Pro) →
- Mortgage (P&I)
- −$262
- Tax from tax record
- −$62 /mo · $747/yr
- Insurance
- −$21
- HOA
- −$0
- Vacancy / Maint / Mgmt
- −$192
- Net cashflow
- $376
Break-even live
UW: 25.0% down · 7.5% · 30yr · 1.5% tax · 5.0% vac · 8.0% maint · 8.0% mgmt
Financing live
Cash to close
- Down payment
- $12,475
- Closing costs
- $1,497
- Reserves months
- —
- Total cash needed
- —
Loan-product check · same deal, 3 products live
Conventional
25% down · 7.5% · 30yr
- Down + closing
- —
- Monthly P&I
- —
- Monthly cashflow
- —
- DSCR
- —
- Eligible?
- —
Personal DTI + credit; lowest rate.
DSCR
20% down · 8.5% · 30yr
- Down + closing
- —
- Monthly P&I
- —
- Monthly cashflow
- —
- DSCR
- —
- Eligible?
- —
No personal income docs; deal must DSCR.
Hard money
10% down · 12.0% · 12mo
- Down + closing
- —
- Monthly P&I
- —
- Monthly cashflow
- —
- DSCR
- —
- Eligible?
- —
Short-term bridge; refi at stabilization.
Listing history 4 events
-
2026-06-15statusdays on market $49,900 Pending 4 DOM
-
2026-06-13days on market $49,900 Active 3 DOM
-
2026-06-12remarks 699-char remark
-
2026-06-12$49,900 Active 2 DOM
ⓘ Source: listings_history table (triggers on properties + properties_extension) + one-shot
backfill from property_details.listing_events for pre-trigger history.
Tax reassessment forecast MO · Resets to sale price
- Current annual tax
- $747 · $62/mo
- Projected year-2 tax
- $747 · $62/mo
- Expected delta
- $0/yr ($0/mo · 0.0%)
ⓘ Screening estimate from a state-policy table — verify with the county assessor before closing.
Climate risk First Street
- Flood 1/10 Low FEMA zone X · 0% chance over 30 yrs
- Wildfire 1/10 Low
- Heat 6/10 Major 7 d/yr ≥108°F today · 21 d/yr by 30 yrs out
- Wind 4/10 Moderate 7% chance of damaging wind over 30 yrs
- Air quality 1/10 Low 0 unhealthy d/yr today · 0 by 30 yrs out
Nearby sold comps map
Loading sold comps map…
Walkable amenities ~0.75 mi
Loading nearby amenities…
Taxation est. · year 1
- Rental income
- $10,952
- − Mortgage interest
- −$2,795
- − Property taxes
- −$747
- − Insurance
- −$250
- − Repairs & maintenance
- −$876
- − Management
- −$876
- − Depreciation
- −$1,452
- Taxable income
- $3,957
- Est. tax owed @ 24.0%
- −$950
- After-tax cash flow
- $3,566/yr
For passive investors: Depreciation is non-cash, so a rental often shows a tax loss while cash-flowing — sheltering income. Rental losses are passive: they offset passive income freely, and up to $25,000/yr can offset ordinary (W-2) income if you actively participate and your MAGI is under $100k (phasing out to $0 by $150k); unused losses carry forward. On sale, claimed depreciation is recaptured at up to 25%, and gains may owe capital-gains tax (a 1031 exchange can defer both). Figures are a year-1 estimate at your 24.0% rate — not tax advice; consult a CPA.
Schools (NCES district)
- District
- New Madrid County R-I
- NCES district ID
- 2900004
- Math proficiency
- 20% ▼ -10.00%
- Reading proficiency
- 31% ▼ -7.00%
- Median HH income
- $31,286
- Composite
- 20.64/100
- National rank
- #8543
- State rank
- #291 of 324 in MO
Livability — Lilbourn
- Score
- 62/100
- State rank
- #402
- US rank
- #17189
Category grades
Schools grade is shown separately in the Schools card above.
Census & demographics
- Census place
- Lilbourn, MO
- Population (ZIP)
- 1,315
Population outlook (New Madrid County) Hauer SSP2
- Today (2025)
- 16,712 people
- By 2030
- 15,845 · -5.2%
- By 2040
- 14,152 · -15.3%
- By 2050
- 12,604 · -24.6%
- By 2075
- 9,478 · -43.3%
- By 2100
- 7,157 · -57.2%
Race, ethnicity, and origin ACS 2023
- Neighborhood character
- Predominantly White (70%)
- Race & ethnicity
- White 70% Black 20% Two or more races 10%
- Common ancestry
- Lithuanian 3% Slovak 2% Serbian 1%
Political lean MEDSL · New Madrid
- 2024 margin
- Solid R (+53.5) · D 22.9% · R 76.4%
- 2008→2024 swing
- -38.4pp toward R · 2008: -15.1pp · 2024: -53.5pp
- All cycles
- 2024: R+53.5 2020: R+51.0 2016: R+45.4 2012: R+20.3 2008: R+15.1
Not yet ingested
- Civics
- —
Market trends
- HPI YoY
- ▼ -0.71%
- Current HPI
- 211.0976
- Rent YoY
- —
- Metro
- —
- State GDP YoY
- ▲ 1.84%
- F500 in state
- 20
Industry mix (Fortune 500 HQ in MO)
| Industry | F500 HQs | Revenue |
|---|---|---|
| Healthcare | 1 | $163B |
|
||
| Insurance | 1 | $21B |
|
||
| Industrial Technology | 1 | $17B |
|
||
| Retail | 1 | $16B |
|
||
| Industrial Distribution | 1 | $10B |
|
||
| Utilities | 1 | $9B |
|
||
Price history
1 event — show timeline
- 2026-06-10 Listed $49,900 MARIS as Distributed by MLS Grid
Property tax history
+7.3%/yrLatest (2025): $747 · +21.2% YoY. Source: county tax records.
Cash-flow waterfall
monthlySold comps — $/sqft
last 12 mo · ≤1 miLoading sold comps…