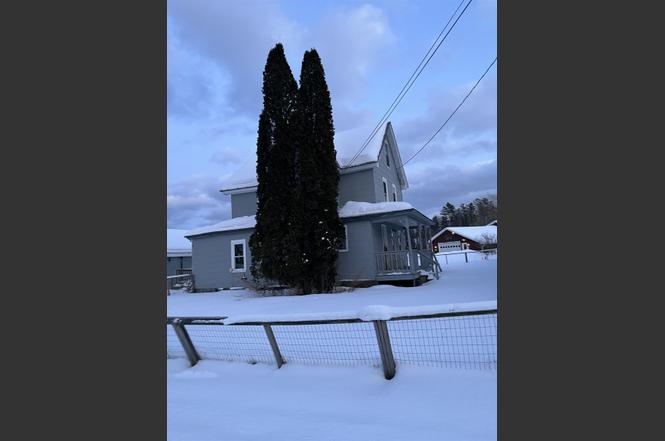
9 Prospect St · East Barre, VT
Flood risk 1/10 · Minimal
- FEMA flood zone
- X (unshaded)
- Chance of flooding over 30 yrs
- 0.0%
- Est. flood insurance / yr
- $473 – $860
Fire risk 1/10 · Minimal
- Est. fire insurance / yr
- $480 – $892
Heat risk 2/10 · Minimal
- Hot days now (above 88°F)
- 7 days/yr
- Hot days in 30 yrs
- 17 days/yr
Wind risk 2/10 · Minimal
- Chance of severe wind over 30 yrs
- 3.0%
Air-quality risk 2/10 · Minimal
- Unhealthy air days now
- 1 days/yr
- Unhealthy air days in 30 yrs
- 1 days/yr
Risk factors via First Street. Map © Google.
Why this score? — see what drove the C+ grade
The composite is a weighted blend of 9 inputs, each scored 0–100. Each bar is that input's sub-score; the figure is the points it added to the 100-point composite (weight × sub-score).
- Cash flow +22.6/30.0
- ARV discount +7.5/15.0
- DSCR +7.3/10.0
- 1% rule +6.8/10.0
- Appreciation +5.2/10.0
- Schools +5.0/10.0
- Livability +3.1/5.0
- Rent growth +2.5/5.0
- Condition / age +2.5/5.0
$101,915
🖨 Deal sheet 📄 Offer letter ✓ Due diligence
Listing remarks
Great location conveniently located near Barre/Montpelier area. Quiet dead end street with little traffic. minutes to parks. Large fenced in yard perfect for your dogs. Upstairs features and extra spacious bonus room and extra closet space 2 bedrooms and a large full bathroom with 2 linen closets. The house features a 1 car detached garage and covered front porch. This property is being sold as-is, property is lender-owned and is making no representations or warranties"
Key facts
- Covered front porch
- Extra closet space
- Large fenced in yard
Tags
Property features AI
Finance
- Financial info: Foreclosed / Bank-Owned / REO
Exterior
- Parking: 1-car garage
- Utilities: Public water; Public sewer; 100 Amp electrical service; Cable available; Internet availability unknown
- Home design: Farmhouse style; Existing structure; Grey exterior color; Faces public road
- Construction: Wood frame construction; Metal roof; Built in 1920
- Exterior features: Level, neighborhood lot; Dirt driveway; Road frontage (public)
Interior
- Kitchen: Kitchen (13 x 12)
- Bedrooms: Master bedroom (2nd level); Additional bedroom (2nd level)
- Flooring: Carpet; Wood
- Bathrooms: 1 full bathroom; 1 half bathroom
- Interior features: 5 total rooms; Unfinished basement with interior access
Neighborhood map
What this means for you Summary
Snapshot
- This is a 2-bed/1.5-bath single-family listed at $102k.
Deal economics
- At list price, monthly cash flow is $174 ($2k/yr) — positive.
- The deal already cash-flows at list — no discount required.
- Meets the 1% rule at list price ($1k rent vs $102k).
- Recommended offer: $96k (6.0% below list) — sets the bar for market timing.
Location & tenants
- Location reads 61/100 on livability (#79 in VT) — a middle-class / working-renter tenant base. Strengths: cost of living A+; Watch: health & safety D, amenities F, commute F.
- Market conditions: 7 active listings in the ZIP; 185 units permitted in Washington County in 2024 (30 in 5+ unit buildings).
Forward outlook
- In year one you build about $1k of equity ($704 loan paydown + $437 appreciation (0.4% local appreciation)).
- Washington County population projected at -19% by 2050 — secular population decline; favor cash flow + early exit over multi-decade hold.
- At projected returns (0.4% appreciation + 3.0% rent growth), your $29k cash investment doubles in ~7 years — after that, you're playing with house money.
Negotiation context
- It's been on market 68 days — a 6% lower offer ($96k) is reasonable based on typical stale-listing flexibility.
Risks & watch-outs
- Watch-outs: built in 1920 — expect roof / HVAC / electrical / plumbing capex.
Questions for the listing agent
- It's been on market 68 days. Have you received any prior offers? Is the seller open to a 6% concession, seller financing, or rate buy-down credit?
- Built in 1920 — when were the roof, HVAC, electrical panel, plumbing, and water heater last replaced?
- Why hasn't it sold? Are there any deal-killer items the seller is aware of (foundation, flood, title, zoning, code violations)?
- Is there a deadline driving the sale (1031 exchange, divorce, estate, relocation)? That informs how much negotiation room exists.
- What's the average days-on-market for RENTAL listings here right now (not sales)? A rising rental-DOM trend means longer vacancies and softer asking-rent achievability than the comps imply.
- What's the recent tenant-quality profile in this submarket — average credit score on applications, eviction rate, late-payment / NSF rate, and stable-employment percentage? A property-management company in the area should have these aggregated.
- How much new for-sale + rental construction is in the pipeline within 1–3 miles? Heavy new supply typically softens prices + rents 12–24 months out; constrained supply supports both.
Investment metrics
- 1% rule
- 1.18% ✓
- Cap rate
- 8.34%
- Cash-on-cash
- 7.31%
- DSCR
- 1.33
- GRM
- 7.1
CMA / ARV
- ARV (on-the-fly)
- $334,020
- Comps found
- 2
Show comp detail 2 sales within ~0.75 mi
| Address | Dist | Beds/Ba | Sqft | Sold | Price | $/sf | Match |
|---|---|---|---|---|---|---|---|
| 21 Summer St | 0.36mi | 3/1.0 (+1) | 1,017 (-13%) | 16mo | $172,500 | $170 | 41 |
| 46 Hillside Rd | 0.33mi | 3/1.0 (+1) | 1,008 (-14%) | 21mo | $287,000 | $285 | 37 |
Match score weights: distance 35% · size 25% · config 20% · recency 20%. Top-matched comps best support the ARV.
Projected returns pro-forma
0.43% appreciation · 3.0% rent growth · sell at horizon
- IRR
- 7.3%
- Equity multiple
- 1.36×
- Total profit
- $10,224
- Equity at exit
- $31,799
- IRR
- 12.0%
- Equity multiple
- 2.37×
- Total profit
- $39,162
- Equity at exit
- $40,032
Cash invested: $28,536 (down + closing). Projections, not guarantees.
Landlord ↔ Tenant lean methodology
- Overall (STATE)
- 41 Moderately Tenant-Leaning
- State Vermont
- 41 Moderately Tenant-Leaning · D+15
- County
- — inherits STATE
- City
- — inherits STATE
ZIP-level market 05649
- Home prices YoY
- 0.4%
- Active inventory
- 7
- Price-to-rent
- 7.1×
Monthly cashflow live
- Estimated rent
- $1,198 medium interval (Pro) →
- Mortgage (P&I)
- −$534
- Tax from tax record
- −$196 /mo · $2,351/yr
- Insurance
- −$42
- HOA
- −$0
- Vacancy / Maint / Mgmt
- −$252
- Net cashflow
- $174
Break-even live
UW: 25.0% down · 7.5% · 30yr · 1.5% tax · 5.0% vac · 8.0% maint · 8.0% mgmt
Financing live
Cash to close
- Down payment
- $25,479
- Closing costs
- $3,057
- Reserves months
- —
- Total cash needed
- —
Loan-product check · same deal, 3 products live
Conventional
25% down · 7.5% · 30yr
- Down + closing
- —
- Monthly P&I
- —
- Monthly cashflow
- —
- DSCR
- —
- Eligible?
- —
Personal DTI + credit; lowest rate.
DSCR
20% down · 8.5% · 30yr
- Down + closing
- —
- Monthly P&I
- —
- Monthly cashflow
- —
- DSCR
- —
- Eligible?
- —
No personal income docs; deal must DSCR.
Hard money
10% down · 12.0% · 12mo
- Down + closing
- —
- Monthly P&I
- —
- Monthly cashflow
- —
- DSCR
- —
- Eligible?
- —
Short-term bridge; refi at stabilization.
Listing history 5 events
-
2026-04-29status Pending
-
2026-04-18price $101,915
-
2026-03-20price $119,900
-
2026-02-18$129,900 Active
-
2020-11-06soldstatus $145,000
ⓘ Source: listings_history table (triggers on properties + properties_extension) + one-shot
backfill from property_details.listing_events for pre-trigger history.
Tax reassessment forecast VT · Partial reset (capped growth)
- Current annual tax
- $2,351 · $196/mo
- Projected year-2 tax
- $2,351 · $196/mo
- Expected delta
- $0/yr ($0/mo · 0.0%)
ⓘ Screening estimate from a state-policy table — verify with the county assessor before closing.
Climate risk First Street
- Flood 1/10 Low FEMA zone X (unshaded) · 0% chance over 30 yrs
- Wildfire 1/10 Low
- Heat 2/10 Low 7 d/yr ≥88°F today · 17 d/yr by 30 yrs out
- Wind 2/10 Low 3% chance of damaging wind over 30 yrs
- Air quality 2/10 Low 1 unhealthy d/yr today · 1 by 30 yrs out
Nearby sold comps map
Loading sold comps map…
Walkable amenities ~0.75 mi
Loading nearby amenities…
Taxation est. · year 1
- Rental income
- $14,380
- − Mortgage interest
- −$5,709
- − Property taxes
- −$2,351
- − Insurance
- −$510
- − Repairs & maintenance
- −$1,150
- − Management
- −$1,150
- − Depreciation
- −$2,965
- Taxable income
- $545
- Est. tax owed @ 24.0%
- −$131
- After-tax cash flow
- $1,955/yr
For passive investors: Depreciation is non-cash, so a rental often shows a tax loss while cash-flowing — sheltering income. Rental losses are passive: they offset passive income freely, and up to $25,000/yr can offset ordinary (W-2) income if you actively participate and your MAGI is under $100k (phasing out to $0 by $150k); unused losses carry forward. On sale, claimed depreciation is recaptured at up to 25%, and gains may owe capital-gains tax (a 1031 exchange can defer both). Figures are a year-1 estimate at your 24.0% rate — not tax advice; consult a CPA.
Schools (NCES district)
No district data.
Livability — East Barre
- Score
- 61/100
- State rank
- #79
- US rank
- #17851
Category grades
Schools grade is shown separately in the Schools card above.
Census & demographics
- Census place
- East Barre, VT
- Population (ZIP)
- 422
Population outlook (Washington County) Hauer SSP2
- Today (2025)
- 56,608 people
- By 2030
- 54,731 · -3.3%
- By 2040
- 50,227 · -11.3%
- By 2050
- 45,893 · -18.9%
- By 2075
- 36,818 · -35.0%
- By 2100
- 28,143 · -50.3%
Race, ethnicity, and origin ACS 2023
- Neighborhood character
- Predominantly White (92%)
- Race & ethnicity
- White 92% Two or more races 7%
- Common ancestry
- Lithuanian 9% Slovak 5% Serbian 1%
- Foreign-born
- 0% · Canada
- Languages at home
- 99% English-only · French/Haitian/Cajun 1%
Political lean MEDSL · Washington
- 2024 margin
- Solid D (+43.4) · D 70.0% · R 26.6% · Other 3.4%
- 2008→2024 swing
- +2.4pp toward D · 2008: 41.0pp · 2024: 43.4pp
- All cycles
- 2024: D+43.4 2020: D+46.1 2016: D+37.0 2012: D+42.2 2008: D+41.0
Not yet ingested
- Civics
- —
Market trends
- HPI YoY
- ▲ 0.43%
- Current HPI
- 113.4365
- Rent YoY
- —
- Metro
- —
- State GDP YoY
- —
- F500 in state
- 0
Price history
-29.7% since first listed5 events — show timeline
- 2026-04-29 Pending — PrimeMLS
- 2026-04-18 Price Changed $101,915 PrimeMLS
- 2026-03-20 Price Changed $119,900 PrimeMLS
- 2026-02-18 Listed $129,900 PrimeMLS
- 2020-11-06 Sold (Public Records) $145,000 Public Records
Property tax history
+20.6%/yrLatest (2024): $2,351 · +31.8% YoY. Source: county tax records.
Cash-flow waterfall
monthlySold comps — $/sqft
last 12 mo · ≤1 miLoading sold comps…