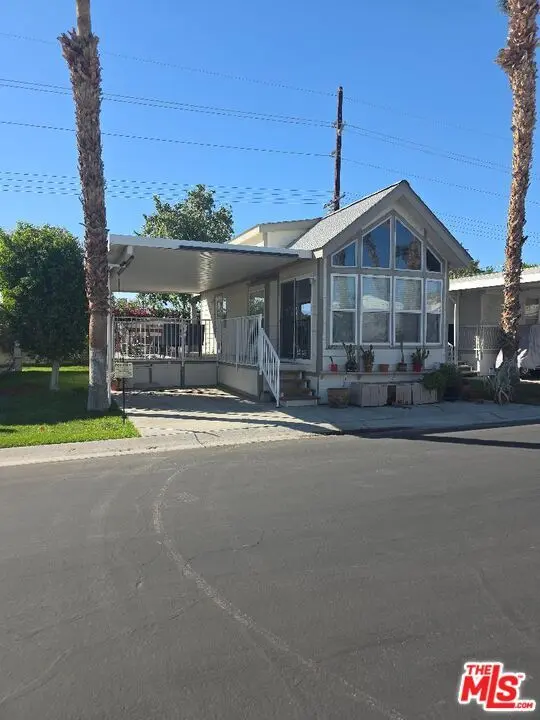
84136 Avenue 44 #372 · Indio, CA
Flood risk 1/10 · Minimal
- FEMA flood zone
- X (unshaded)
- Chance of flooding over 30 yrs
- 0.0%
- Est. flood insurance / yr
- $507 – $1,088
Fire risk 6/10 · Moderate
- Est. fire insurance / yr
- $659 – $1,223
Heat risk 10/10 · Severe
- Hot days now (above 115°F)
- 6 days/yr
- Hot days in 30 yrs
- 15 days/yr
Wind risk 1/10 · Minimal
- Chance of severe wind over 30 yrs
- —
Air-quality risk 3/10 · Minor
- Unhealthy air days now
- 3 days/yr
- Unhealthy air days in 30 yrs
- 5 days/yr
Risk factors via First Street. Map © Google.
Why this score? — see what drove the D+ grade
The composite is a weighted blend of 9 inputs, each scored 0–100. Each bar is that input's sub-score; the figure is the points it added to the 100-point composite (weight × sub-score).
- ARV discount +15.0/15.0
- Cash flow +8.6/30.0
- 1% rule +8.3/10.0
- Rent growth +5.0/5.0
- Schools +3.8/10.0
- Livability +2.7/5.0
- Condition / age +2.5/5.0
- DSCR +2.4/10.0
- Appreciation +0.0/10.0
$99,000
🖨 Deal sheet (PDF) 📄 Offer letter ✓ Due diligence
Listing remarks MLS
This Park Model, with an oversized loft has been recently upgraded with paint throughout, Quartz counter tops in kitchen and bathroom and flooring throughout. The new kitchen appliances include: 5 burner range top, combo microware/convection and hot air fryer. It has a New living room glass slider, hot water heater and HVAC. The outside deck has new steps up to the weatherproof deck flooring. This is a turnkey at it's finest. This all located in a 55 community that has a 3 par golf course, chipping green, putting green, 9 hole mini golf, pickleball and tennis courts, bocce ball, an indoor shuffleboard courts, 2 clubhouses with pools and Jacuzzies and an additional 4 satellites with pool, jacuzzi and mail boxes. This is all within a 24 hour gate guarded community , of 801 lots, that consist of a combination of Park Models and RV lots, where you own the land. The resort has a limit of 270 day occupancy. It is. a perfect place to spend your holidays in the sunshine.
Key facts
- Oversized loft
- Chipping green
- 3 par golf course
Tags
Neighborhood map
What this means for you Summary
Snapshot
- This is a 1-bed/1.0-bath manufactured listed at $99k.
Deal economics
- At list price, monthly cash flow is $-85 ($-1k/yr) — negative.
- To cash-flow at today's rent, offer at most $84k (15.2% below list).
- Meets the 1% rule at list price ($1k rent vs $99k).
- Recommended offer: $84k (15.2% below list) — sets the bar for cash-flow.
- Cap rate 5.3% vs local median 4.3% in Indio — meaningfully above typical; check what's discounted (condition, days-on-market, listing class) to confirm the premium yield is real.
Location & tenants
- Location reads 53/100 on livability (#927 in CA) — a working-class tenant base; expect higher turnover. Strengths: housing B+; Watch: employment D, crime F, amenities F.
- Desert Sands Unified (suburban): math 31% / reading 56% proficiency, ranked #199 of 517 in CA (top 38%) — families likely to look elsewhere, expect single-tenant / working-renter base with shorter leases.
- Zoned schools: Desert Ridge Academy (math 24% / reading 75%, grade C, #98 of 498 statewide, top 21%, 1,030 students, 81% FRL); Shadow Hills High (math 30% / reading 53%, grade F, #498 of 1,170 statewide, top 43%, 1,751 students, 77% FRL) — zoned schools average 79% FRL vs 56% district-wide (23 pts higher); higher-poverty schools than district average — tighter screening recommended.
- Market conditions: Rents rising fast (+11.6%/yr); 448 active listings in the ZIP; solid renter incomes; 9,195 units permitted in Riverside County in 2024 (1,512 in 5+ unit buildings).
- This rent is only 16% of the median local income ($97k/yr) — well below the 30% rent-burden line; pricing power to push rent on renewal without tenant pushback.
Forward outlook
- Local home prices are declining (-3.0%/yr); year-one equity from $684 of loan paydown is wiped out by about $3k of value loss. Plan a longer hold.
- Riverside County population projected at +22% by 2050 — long-run rental-demand tailwind backs the buy-and-hold thesis.
Negotiation context
- It's been on market 242 days — a 12% lower offer ($87k) is reasonable based on typical stale-listing flexibility.
- Current owner paid $24k; list at $99k implies a 321% gain — meaningful room to come down on a strong offer.
Risks & watch-outs
- Watch-outs: HOA is 40% of rent.
- Climate carrying-cost: major wildfire risk; extreme-heat days projected 6→15/yr by 2055 (HVAC capex compounding) — expect insurance premiums to compound above CPI over the hold.
Questions for the listing agent
- What do current leases actually rent for vs. the listed asking? Can we see a recent rent roll and the last 12 months of T-12 income?
- It's been on market 242 days. Have you received any prior offers? Is the seller open to a 15% concession, seller financing, or rate buy-down credit?
- What does the HOA fee cover, when was the last increase, and are there any pending special assessments or reserve-fund shortfalls?
- Why hasn't it sold? Are there any deal-killer items the seller is aware of (foundation, flood, title, zoning, code violations)?
- Is there a deadline driving the sale (1031 exchange, divorce, estate, relocation)? That informs how much negotiation room exists.
- Schools are F-rated, which usually means shorter tenancies and higher turnover. Who's the typical renter profile here, and what's been the actual vacancy rate?
- Crime grade is F in this area — have there been break-ins, vandalism, or insurance claims at this property in the last 3 years? What carrier currently insures it and at what premium?
- The area grade is low — what's the realistic commute time and amenity access for the typical tenant pool here? Any planned neighborhood developments (good or bad) we should know about?
- What's the average days-on-market for RENTAL listings here right now (not sales)? A rising rental-DOM trend means longer vacancies and softer asking-rent achievability than the comps imply.
- What's the recent tenant-quality profile in this submarket — average credit score on applications, eviction rate, late-payment / NSF rate, and stable-employment percentage? A property-management company in the area should have these aggregated.
- How much new for-sale + rental construction is in the pipeline within 1–3 miles? Heavy new supply typically softens prices + rents 12–24 months out; constrained supply supports both.
Investment metrics
- 1% rule
- 1.33% ✓
- Cap rate
- 5.26%
- Cash-on-cash
- -3.68%
- DSCR
- 0.84
- GRM
- 6.3
CMA / ARV
- ARV (median comp)
- $131,216
- List price
- $99,000
- Delta
- -24.55%
- Verdict
- UNDERPRICED
- Comps
- 20 within 1.0 mi
Show comp detail 12 sales within ~0.75 mi
| Address | Dist | Beds/Ba | Sqft | Sold | Price | $/sf | Match |
|---|---|---|---|---|---|---|---|
| 84136 Ave 44, #262 #262 | 0.09mi | 1/1.0 | 400 (0%) | 0mo | $192,500 | $481 | 96 |
| 84136 84136 Avenue 44, #325 #325 | 0.06mi | 1/1.0 | 400 (0%) | 2mo | $79,000 | $198 | 96 |
| 84136 Ave 44, #385 #385 | 0.06mi | 1/1.0 | 400 (0%) | 3mo | $178,000 | $445 | 95 |
| 84136 Avenue 44 #477 | 0.11mi | 1/1.0 | 400 (0%) | 1mo | $95,000 | $238 | 94 |
| 84136 Ave 44, #567 #567 | 0.11mi | 1/1.0 | 400 (0%) | 2mo | $90,000 | $225 | 94 |
| 84136 Avenue 44, #449 #449 | 0.11mi | 1/1.0 | 400 (0%) | 3mo | $230,000 | $575 | 93 |
| 84136 Ave 44, #29 #29 | 0.18mi | 1/1.0 | 400 (0%) | 2mo | $90,000 | $225 | 90 |
| 754 Ave 44 #754 | 0.16mi | 1/1.0 | 400 (0%) | 3mo | $101,500 | $254 | 90 |
| 84136 Ave 44, #744 #744 | 0.23mi | 1/1.0 | 400 (0%) | 2mo | $176,000 | $440 | 88 |
| 84136 Ave 44, 675 #675 | 0.23mi | 1/1.0 | 400 (0%) | 3mo | $205,000 | $513 | 87 |
| 84136 Ave 44, 658 #658 | 0.24mi | 1/1.0 | 400 (0%) | 3mo | $102,500 | $256 | 86 |
| 84136 Ave 44 #122 | 0.27mi | 1/1.0 | 400 (0%) | 2mo | $125,000 | $313 | 86 |
Match score weights: distance 35% · size 25% · config 20% · recency 20%. Top-matched comps best support the ARV.
Projected returns pro-forma
-3.0% appreciation · 8.0% rent growth · sell at horizon
- IRR
- -13.2%
- Equity multiple
- 0.49×
- Total profit
- $-14,197
- Equity at exit
- $14,761
- IRR
- 4.9%
- Equity multiple
- 1.49×
- Total profit
- $13,565
- Equity at exit
- $8,560
Cash invested: $27,720 (down + closing). Projections, not guarantees.
Landlord ↔ Tenant lean methodology
- Overall (STATE)
- 18 Strongly Tenant-Friendly
- State California
- 18 Strongly Tenant-Friendly · D+13
- County
- — inherits STATE
- City
- — inherits STATE
ZIP-level market 92203
- Home prices YoY
- -25.0%
- Rents YoY
- 11.6%
- Active inventory
- 448
- Price-to-rent
- 6.3×
Monthly cashflow live
- Estimated rent
- $1,319 medium interval (Pro) →
- Mortgage (P&I)
- −$519
- Tax from tax record
- −$36 /mo · $435/yr
- Insurance
- −$41
- HOA
- −$530
- Lot rent leased land?
- −$0
- Vacancy / Maint / Mgmt
- −$277
- Net cashflow
- $-85
Break-even live
Sensitivity live
| Price | -10% $-29 | -5% $-57 | +0% $-85 | +5% $-113 | +10% $-141 |
|---|---|---|---|---|---|
| Rent | -10% $-189 | -5% $-137 | +0% $-85 | +5% $-33 | +10% $19 |
| Rate | -1.0pp $-35 | -0.5pp $-60 | base $-85 | +0.5pp $-111 | +1.0pp $-137 |
UW: 25.0% down · 7.5% · 30yr · 1.5% tax · 5.0% vac · 8.0% maint · 8.0% mgmt
Financing live
Cash to close
- Down payment
- $24,750
- Closing costs
- $2,970
- Reserves months
- —
- Total cash needed
- —
Loan-product check · same deal, 3 products live
Conventional
25% down · 7.5% · 30yr
- Down + closing
- —
- Monthly P&I
- —
- Monthly cashflow
- —
- DSCR
- —
- Eligible?
- —
Personal DTI + credit; lowest rate.
DSCR
20% down · 8.5% · 30yr
- Down + closing
- —
- Monthly P&I
- —
- Monthly cashflow
- —
- DSCR
- —
- Eligible?
- —
No personal income docs; deal must DSCR.
Hard money
10% down · 12.0% · 12mo
- Down + closing
- —
- Monthly P&I
- —
- Monthly cashflow
- —
- DSCR
- —
- Eligible?
- —
Short-term bridge; refi at stabilization.
HOA detail
- Monthly dues
- $530 · $6,360/yr
- Likely covers
- waterpoolsecurity
Listing history 18 events
-
2026-06-22days on market $99,000 Active 242 DOM
-
2026-06-21days on market $99,000 Active 241 DOM
-
2026-06-18days on market $99,000 Active 238 DOM
-
2026-06-17days on market $99,000 Active 237 DOM
-
2026-06-16days on market $99,000 Active 236 DOM
-
2026-06-15days on market $99,000 Active 235 DOM
-
2026-06-13days on market $99,000 Active 233 DOM
-
2026-06-09days on market $99,000 Active 229 DOM
-
2026-06-08days on market $99,000 Active 228 DOM
-
2026-06-07days on market $99,000 Active 227 DOM
-
2026-06-04days on market $99,000 Active 224 DOM
-
2026-06-03days on market $99,000 Active 223 DOM
-
2026-06-02days on market $99,000 Active 222 DOM
-
2026-06-01days on market $99,000 Active 221 DOM
-
2026-05-31days on market $99,000 Active 220 DOM
-
2025-10-23$99,000 Active 978-char remark
Show marketing remark (978 chars)
This Park Model, with an oversized loft has been recently upgraded with paint throughout, Quartz counter tops in kitchen and bathroom and flooring throughout. The new kitchen appliances include: 5 burner range top, combo microware/convection and hot air fryer. It has a New living room glass slider, hot water heater and HVAC. The outside deck has new steps up to the weatherproof deck flooring. This is a turnkey at it's finest. This all located in a 55 community that has a 3 par golf course, chipping green, putting green, 9 hole mini golf, pickleball and tennis courts, bocce ball, an indoor shuffleboard courts, 2 clubhouses with pools and Jacuzzies and an additional 4 satellites with pool, jacuzzi and mail boxes. This is all within a 24 hour gate guarded community , of 801 lots, that consist of a combination of Park Models and RV lots, where you own the land. The resort has a limit of 270 day occupancy. It is. a perfect place to spend your holidays in the sunshine.
-
1991-04-30soldstatus $23,500
-
1919-06-27soldstatus $17,500
ⓘ Source: listings_history table (triggers on properties + properties_extension) + one-shot
backfill from property_details.listing_events for pre-trigger history.
Tax reassessment forecast CA · Resets to sale price
- Current annual tax
- $435 · $36/mo
- Projected year-2 tax
- $752 · $63/mo
- Expected delta
- +$317/yr (+$26/mo · 73.0%)
ⓘ Screening estimate from a state-policy table — verify with the county assessor before closing.
Climate risk First Street
- Flood 1/10 Low FEMA zone X (unshaded) · 0% chance over 30 yrs
- Wildfire 6/10 Major
- Heat 10/10 Extreme 6 d/yr ≥115°F today · 15 d/yr by 30 yrs out
- Wind 1/10 Low
- Air quality 3/10 Moderate 3 unhealthy d/yr today · 5 by 30 yrs out
Nearby sold comps map
Loading sold comps map…
Walkable amenities ~0.75 mi
Loading nearby amenities…
Taxation est. · year 1
- Rental income
- $15,822
- − Mortgage interest
- −$5,546
- − Property taxes
- −$435
- − Insurance
- −$495
- − Repairs & maintenance
- −$1,266
- − Management
- −$1,266
- − HOA
- −$6,360
- − Depreciation
- −$2,880
- Taxable loss
- −$2,425
- Est. tax savings @ 24.0%
- +$582
- After-tax cash flow
- $-438/yr
For passive investors: Depreciation is non-cash, so a rental often shows a tax loss while cash-flowing — sheltering income. Rental losses are passive: they offset passive income freely, and up to $25,000/yr can offset ordinary (W-2) income if you actively participate and your MAGI is under $100k (phasing out to $0 by $150k); unused losses carry forward. On sale, claimed depreciation is recaptured at up to 25%, and gains may owe capital-gains tax (a 1031 exchange can defer both). Figures are a year-1 estimate at your 24.0% rate — not tax advice; consult a CPA.
Schools (NCES district)
- District
- Desert Sands Unified
- NCES district ID
- 0611110
- Math proficiency
- 31% ▼ -4.00%
- Reading proficiency
- 56% ▲ 7.00%
- Median HH income
- $54,957
- Composite
- 37.77/100
- National rank
- #4346
- State rank
- #199 of 517 in CA
Livability — Indio
- Score
- 53/100
- State rank
- #927
- US rank
- #24244
Category grades
Schools grade is shown separately in the Schools card above.
Census & demographics
- Census place
- Indio, CA
- County
- Riverside County · 2,287,001 people
- City population
- 100,560
- Metro
- Riverside-San Bernardino-Ontario, CA
- Population (ZIP)
- 34,735
- Household income
- $97,311
- Rent vs Own
- Severe rent burden
- 565.0
Population outlook (Riverside County) Hauer SSP2
- Today (2025)
- 2,664,475 people
- By 2030
- 2,802,692 · +5.2%
- By 2040
- 3,050,904 · +14.5%
- By 2050
- 3,256,783 · +22.2%
- By 2075
- 3,655,058 · +37.2%
- By 2100
- 3,766,594 · +41.4%
Race, ethnicity, and origin ACS 2023
- Neighborhood character
- Diverse neighborhood (Simpson 0.57)
- Race & ethnicity
- Hispanic / Latino 51% White 41% Two or more races 29% Asian 3% Black 2%
- Hispanic origin (detail)
- Mexican 48%
- Common ancestry
- Italian 3% Lithuanian 2% Romanian 2%
- Foreign-born
- 14% · Canada
- Languages at home
- 64% English-only · Spanish 33% Tagalog/Filipino 1% Other Indo-European 1%
Political lean MEDSL · Riverside
- 2024 margin
- Toss-up / Even · D 48.0% · R 49.3% · Other 2.6%
- 2008→2024 swing
- -3.6pp toward R · 2008: 2.3pp · 2024: -1.3pp
- All cycles
- 2024: R+1.3 2020: D+8.0 2016: D+4.3 2012: R+0.4 2008: D+2.3
Not yet ingested
- Civics
- —
Market trends
- HPI YoY
- ▼ -98.51%
- Current HPI
- 295.6456
- Rent YoY
- ▲ 11.64%
- Metro
- Riverside-San Bernardino-Ontario, CA
- State GDP YoY
- ▲ 3.21%
- F500 in state
- 116
Industry mix (Fortune 500 HQ in CA)
| Industry | F500 HQs | Revenue |
|---|---|---|
| Technology | 27 | $1,492B |
|
||
| Financial Services | 3 | $174B |
|
||
| Retail | 3 | $44B |
|
||
| Insurance | 3 | $26B |
|
||
| Media / Entertainment | 2 | $115B |
|
||
| Pharmaceuticals / Biotech | 2 | $62B |
|
||
Price history
+465.7% since first listed3 events — show timeline
- 2025-10-23 Listed $99,000 TheMLS
- 1991-04-30 Sold (Public Records) $23,500 Public Records
- 1919-06-27 Sold (Public Records) $17,500 Public Records
Property tax history
+1.4%/yrLatest (2014): $435 · +0.3% YoY. Source: county tax records.
Cash-flow waterfall
monthlySold comps — $/sqft
last 12 mo · ≤1 miLoading sold comps…