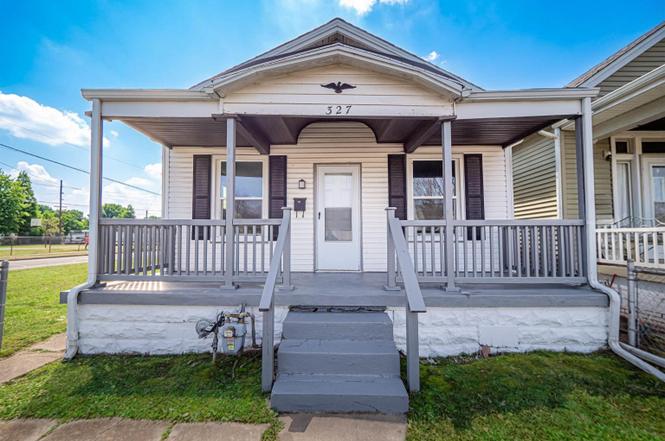
327 Ridgeway Ave · Evansville, IN
Flood risk 1/10 · Minimal
- FEMA flood zone
- X
- Chance of flooding over 30 yrs
- 0.0%
- Est. flood insurance / yr
- $473 – $860
Fire risk 1/10 · Minimal
- Est. fire insurance / yr
- $717 – $1,331
Heat risk 5/10 · Moderate
- Hot days now (above 107°F)
- 7 days/yr
- Hot days in 30 yrs
- 19 days/yr
Wind risk 2/10 · Minimal
- Chance of severe wind over 30 yrs
- 4.0%
Air-quality risk 4/10 · Minor
- Unhealthy air days now
- 3 days/yr
- Unhealthy air days in 30 yrs
- 5 days/yr
Risk factors via First Street. Map © Google.
Why this score? — see what drove the C grade
The composite is a weighted blend of 9 inputs, each scored 0–100. Each bar is that input's sub-score; the figure is the points it added to the 100-point composite (weight × sub-score).
- Cash flow +26.4/30.0
- DSCR +9.0/10.0
- 1% rule +6.4/10.0
- Rent growth +5.0/5.0
- Schools +3.3/10.0
- Livability +3.2/5.0
- Condition / age +2.5/5.0
- ARV discount +0.0/15.0
- Appreciation +0.0/10.0
$90,000
🖨 Deal sheet 📄 Offer letter ✓ Due diligence
Listing remarks
Welcome to your move-in ready opportunity! This is a fully renovated 2-bedroom, 1-bath home with more amenities than you would expect. This property is a must-see for first-time buyers seeking a maintenance-free start or investors looking for an immediate income-producer. Step inside to a fresh, contemporary interior featuring new, durable luxury vinyl plank flooring and plush carpeting. Every detail has been thoughtfully updated, offering a true "unpack and enjoy" experience. It has a fenced-in front yard making it great for someone with pets. With a covered porch out front and a nice deck out back, it has plenty of outdoor space to enjoy. Its prime location offers easy access to
Key facts
- Covered porch
- Fully renovated
- Nice deck
Tags
Neighborhood map
What this means for you Summary
Snapshot
- This is a 2-bed/1.0-bath single-family listed at $90k.
Deal economics
- At list price, monthly cash flow is $236 ($3k/yr) — positive.
- The deal already cash-flows at list — no discount required.
- Meets the 1% rule at list price ($1k rent vs $90k).
- Recommended offer: $79k (12.0% below list) — sets the bar for market timing.
- Cap rate 9.4% vs local median 4.6% in Evansville — top-decile yield for the area; either an underpriced asset or a hidden risk that comps aren't pricing in. Stress-test before assuming the spread holds.
Location & tenants
- Location reads 63/100 on livability (#416 in IN) — a middle-class / working-renter tenant base. Strengths: cost of living A+, housing A+, health & safety A+; Watch: crime F, commute F, employment D-.
- Evansville Vanderburgh School Corporation (urban): math 36% / reading 43% proficiency, ranked #153 of 301 in IN (top 51%) — families likely to look elsewhere, expect single-tenant / working-renter base with shorter leases.
- Zoned schools: Tekoppel Elementary School (math 42% / reading 33%, grade F, #543 of 994 statewide, top 55%, 445 students, 73% FRL); Helfrich Park Stem Academy (math 36% / reading 47%, grade F, #108 of 330 statewide, top 34%, 517 students, 52% FRL); Francis Joseph Reitz High School (math 45% / reading 68%, grade C, #70 of 369 statewide, top 19%, 1,280 students, 44% FRL).
- Market conditions: Rents rising fast (+9.9%/yr); 118 active listings in the ZIP; 25 comparable units currently listed for rent nearby; rentals at typical pace (median 21d on market — plan ~3-4 weeks tenant-placement turnaround); lower-income renter base — watch delinquency; 508 units permitted in Vanderburgh County in 2024 (32 in 5+ unit buildings).
- This rent runs 30% of the median local income ($41k/yr) — at the standard rent-burdened threshold; future hikes will face affordability resistance.
Forward outlook
- Local home prices are declining (-3.0%/yr); year-one equity from $622 of loan paydown is wiped out by about $3k of value loss. Plan a longer hold.
- At projected returns (-3.0% appreciation + 8.0% rent growth), your $25k cash investment doubles in ~7 years — after that, you're playing with house money.
Negotiation context
- It's been on market 145 days — a 12% lower offer ($79k) is reasonable based on typical stale-listing flexibility.
- 2 sale attempts since 2y ago; this cycle's ask has dropped $5k (5%) from the opening price — seller is motivated, your offer sets the floor, not the list.
Risks & watch-outs
- Watch-outs: built in 1924 — expect roof / HVAC / electrical / plumbing capex.
- Climate carrying-cost: extreme-heat days projected 7→19/yr by 2055 (HVAC capex compounding) — expect insurance premiums to compound above CPI over the hold.
Questions for the listing agent
- It's been on market 145 days. Have you received any prior offers? Is the seller open to a 12% concession, seller financing, or rate buy-down credit?
- Built in 1924 — when were the roof, HVAC, electrical panel, plumbing, and water heater last replaced?
- Why hasn't it sold? Are there any deal-killer items the seller is aware of (foundation, flood, title, zoning, code violations)?
- Is there a deadline driving the sale (1031 exchange, divorce, estate, relocation)? That informs how much negotiation room exists.
- Schools are D-rated, which usually means shorter tenancies and higher turnover. Who's the typical renter profile here, and what's been the actual vacancy rate?
- Crime grade is F in this area — have there been break-ins, vandalism, or insurance claims at this property in the last 3 years? What carrier currently insures it and at what premium?
- What's the average days-on-market for RENTAL listings here right now (not sales)? A rising rental-DOM trend means longer vacancies and softer asking-rent achievability than the comps imply.
- What's the recent tenant-quality profile in this submarket — average credit score on applications, eviction rate, late-payment / NSF rate, and stable-employment percentage? A property-management company in the area should have these aggregated.
- How much new for-sale + rental construction is in the pipeline within 1–3 miles? Heavy new supply typically softens prices + rents 12–24 months out; constrained supply supports both.
Investment metrics
- 1% rule
- 1.14% ✓
- Cap rate
- 9.43%
- Cash-on-cash
- 11.22%
- DSCR
- 1.50
- GRM
- 7.3
CMA / ARV
- ARV (on-the-fly)
- $64,428
- Comps found
- 12
Show comp detail 12 sales within ~0.75 mi
| Address | Dist | Beds/Ba | Sqft | Sold | Price | $/sf | Match |
|---|---|---|---|---|---|---|---|
| 327 Ridgeway Ave | 0.00mi | 2/1.0 | 767 (0%) | 3mo | $82,500 | $108 | 98 |
| 1663 S Elliott St | 0.14mi | 2/1.0 | 783 (+2%) | 6mo | $90,000 | $115 | 84 |
| 1771 Judson St | 0.08mi | 2/1.0 | 800 (+4%) | 7mo | $50,000 | $63 | 83 |
| 1525 SE Riverside Dr | 0.37mi | 2/1.0 | 800 (+4%) | 7mo | $31,500 | $39 | 69 |
| 637 Jackson Ave | 0.46mi | 2/1.5 | 800 (+4%) | 1mo | $119,900 | $150 | 69 |
| 609 Taylor Ave | 0.37mi | 2/1.0 | 840 (+10%) | 5mo | $25,000 | $30 | 62 |
| 321 Adams Ave | 0.63mi | 3/1.0 (+1) | 800 (+4%) | 3mo | $18,000 | $23 | 56 |
| 820 Ridgeway Ave | 0.45mi | 2/1.0 | 660 (-14%) | 10mo | $90,000 | $136 | 48 |
| 2011 S New York Ave | 0.75mi | 1/1.0 (-1) | 829 (+8%) | 2mo | $35,000 | $42 | 44 |
| 1425 SE Riverside Dr | 0.45mi | 2/1.0 | 672 (-12%) | 19mo | $62,000 | $92 | 42 |
| 1300 S Bedford Ave | 0.71mi | 2/1.0 | 861 (+12%) | 5mo | $72,475 | $84 | 42 |
| 727 Jackson Ave | 0.54mi | 3/2.0 (+1) | 870 (+13%) | 20mo | $42,500 | $49 | 26 |
Match score weights: distance 35% · size 25% · config 20% · recency 20%. Top-matched comps best support the ARV.
Projected returns pro-forma
-3.0% appreciation · 8.0% rent growth · sell at horizon
- IRR
- 5.6%
- Equity multiple
- 1.23×
- Total profit
- $5,807
- Equity at exit
- $13,419
- IRR
- 19.0%
- Equity multiple
- 2.94×
- Total profit
- $48,900
- Equity at exit
- $7,782
Cash invested: $25,200 (down + closing). Projections, not guarantees.
Landlord ↔ Tenant lean methodology
- Overall (STATE)
- 90 Strongly Landlord-Friendly
- State Indiana
- 90 Strongly Landlord-Friendly · R+11
- County
- — inherits STATE
- City
- — inherits STATE
ZIP-level market 47713
- Home prices YoY
- -34.1%
- Rents YoY
- 9.9%
- Active inventory
- 118
- Price-to-rent
- 7.3×
Monthly cashflow live
- Estimated rent
- $1,022 high interval (Pro) →
- Mortgage (P&I)
- −$472
- Tax from tax record
- −$62 /mo · $749/yr
- Insurance
- −$38
- HOA
- −$0
- Vacancy / Maint / Mgmt
- −$215
- Net cashflow
- $236
Break-even live
UW: 25.0% down · 7.5% · 30yr · 1.5% tax · 5.0% vac · 8.0% maint · 8.0% mgmt
Financing live
Cash to close
- Down payment
- $22,500
- Closing costs
- $2,700
- Reserves months
- —
- Total cash needed
- —
Loan-product check · same deal, 3 products live
Conventional
25% down · 7.5% · 30yr
- Down + closing
- —
- Monthly P&I
- —
- Monthly cashflow
- —
- DSCR
- —
- Eligible?
- —
Personal DTI + credit; lowest rate.
DSCR
20% down · 8.5% · 30yr
- Down + closing
- —
- Monthly P&I
- —
- Monthly cashflow
- —
- DSCR
- —
- Eligible?
- —
No personal income docs; deal must DSCR.
Hard money
10% down · 12.0% · 12mo
- Down + closing
- —
- Monthly P&I
- —
- Monthly cashflow
- —
- DSCR
- —
- Eligible?
- —
Short-term bridge; refi at stabilization.
Rent comps 25 comps
| Address | Beds | Baths | Sqft | Rent | $/sqft | DOM | Units | Dist |
|---|---|---|---|---|---|---|---|---|
| 715 E Riverside Dr Evansville, IN | 2.0 | 1.0 | 806 | $895 | $1.11 | 20d | 1 | 0.33mi |
| 1421 SE 2nd St Unit A Evansville, IN | 1.0 | 1.0 | 800 | $695 | $0.87 | 13d | 1 | 0.35mi |
| 1231 Culver Dr Unit C Evansville, IN | 1.0 | 1.0 | 575 | $625 | $1.09 | 20d | 1 | 0.46mi |
| 605 Madison Ave Evansville, IN | 2.0 | 1.0 | 1069 | $1,375 | $1.29 | 20d | 1 | 0.54mi |
| 17 Washington Ave Evansville, IN | 2.0 | 1.0 | 882 | $1,455 | $1.65 | 20d | 1 | 0.73mi |
| 924 SE 6th St Unit A Evansville, IN | 1.0 | 1.0 | 800 | $875 | $1.09 | 20d | 1 | 0.77mi |
| 8 E Blackford Ave Evansville, IN | 1.0 | 1.0 | 750 | $825 | $1.10 | 20d | 1 | 0.82mi |
| 827 Judson St Evansville, IN | 3.0 | 1.0 | 1008 | $1,295 | $1.28 | 13d | 1 | 0.83mi |
| 1021 Jefferson Ave Evansville, IN | 1.0 | 1.0 | 798 | $795 | $1.00 | 13d | 1 | 0.91mi |
| 615 SE 3rd St Unit D Evansville, IN | 1.0 | 1.0 | 1122 | $895 | $0.80 | 20d | 1 | 0.96mi |
| 734 Bayard Park Dr Evansville, IN | 3.0 | 2.0 | 1000 | $1,425 | $1.43 | 20d | 1 | 1.02mi |
| 1500 S Harlan Ave Evansville, IN | 2.0 | 1.0 | 712 | $900 | $1.26 | 13d | 1 | 1.03mi |
| 322 SE 1st St Evansville, IN | 1.0–2.0 | 1.0 | 1100 | $1,700 | $1.55 | 20d | 6 | 1.14mi |
| 202 SE 1st St Evansville, IN | 1.0–2.0 | 1.0 | 926 | $2,449 | $2.64 | 20d | 4 | 1.25mi |
| 1133 Bayard Park Dr Unit B Evansville, IN | 2.0 | 1.0 | 990 | $800 | $0.81 | 20d | 1 | 1.27mi |
| 101 SE 2nd St Evansville, IN | 1.0 | 1.0 | 530 | $750 | $1.42 | 13d | 1 | 1.32mi |
| 1505 Jackson Ave Evansville, IN | 2.0 | 1.0 | 780 | $995 | $1.28 | 20d | 1 | 1.32mi |
| 100 SE 1st St Evansville, IN | 1.0–2.0 | 1.0–2.0 | 715 | $1,725 | $2.41 | 13d | 17 | 1.33mi |
| 507 S Evans Ave Evansville, IN | 2.0 | 1.0 | 750 | $795 | $1.06 | 20d | 1 | 1.34mi |
| 329 Main St Evansville, IN | 1.0–2.0 | 1.0–2.0 | 717 | $1,505 | $2.10 | 13d | 1 | 1.39mi |
| 300 Main St Unit 1 D3 Evansville, IN | 1.0 | 1.0 | 800 | $2,000 | $2.50 | 20d | 1 | 1.42mi |
| 2340 Sunburst Blvd Unit 2270-318 Evansville, IN | 2.0 | 1.0 | 815 | $900 | $1.10 | 20d | 1 | 1.47mi |
| 2340 Sunburst Blvd Unit 2210-104 Evansville, IN | 1.0 | 1.0 | 631 | $785 | $1.24 | 20d | 1 | 1.47mi |
| 2340 Sunburst Blvd Unit 2200-202 Evansville, IN | 3.0 | 1.0 | 973 | $1,050 | $1.08 | 20d | 1 | 1.47mi |
| 24 NW 6th St Apt 103 Evansville, IN | 1.0 | 1.0 | 706 | $1,300 | $1.84 | 20d | 1 | 1.50mi |
Listing history 6 events
-
2026-02-25status Pending
-
2026-01-08price $90,000
-
2025-10-02$95,000 Active
-
2024-11-22price $109,000
-
2024-11-01$114,900 Active
-
2022-07-18price $850
ⓘ Source: listings_history table (triggers on properties + properties_extension) + one-shot
backfill from property_details.listing_events for pre-trigger history.
Tax reassessment forecast IN · Partial reset (capped growth)
- Current annual tax
- $749 · $62/mo
- Projected year-2 tax
- $757 · $63/mo
- Expected delta
- +$8/yr (+$1/mo · 1.1%)
ⓘ Screening estimate from a state-policy table — verify with the county assessor before closing.
Climate risk First Street
- Flood 1/10 Low FEMA zone X · 0% chance over 30 yrs
- Wildfire 1/10 Low
- Heat 5/10 Major 7 d/yr ≥107°F today · 19 d/yr by 30 yrs out
- Wind 2/10 Low 4% chance of damaging wind over 30 yrs
- Air quality 4/10 Moderate 3 unhealthy d/yr today · 5 by 30 yrs out
Nearby sold comps map
Loading sold comps map…
Walkable amenities ~0.75 mi
Loading nearby amenities…
Taxation est. · year 1
- Rental income
- $12,265
- − Mortgage interest
- −$5,041
- − Property taxes
- −$749
- − Insurance
- −$450
- − Repairs & maintenance
- −$981
- − Management
- −$981
- − Depreciation
- −$2,618
- Taxable income
- $1,444
- Est. tax owed @ 24.0%
- −$347
- After-tax cash flow
- $2,480/yr
For passive investors: Depreciation is non-cash, so a rental often shows a tax loss while cash-flowing — sheltering income. Rental losses are passive: they offset passive income freely, and up to $25,000/yr can offset ordinary (W-2) income if you actively participate and your MAGI is under $100k (phasing out to $0 by $150k); unused losses carry forward. On sale, claimed depreciation is recaptured at up to 25%, and gains may owe capital-gains tax (a 1031 exchange can defer both). Figures are a year-1 estimate at your 24.0% rate — not tax advice; consult a CPA.
Schools (NCES district)
- District
- Evansville Vanderburgh School Corporation
- NCES district ID
- 1803450
- Math proficiency
- 36% ▼ -7.00%
- Reading proficiency
- 43% ▼ -3.00%
- Median HH income
- $43,270
- Composite
- 33.41/100
- National rank
- #5471
- State rank
- #153 of 301 in IN
Livability — Evansville
- Score
- 63/100
- State rank
- #416
- US rank
- #15047
Category grades
Schools grade is shown separately in the Schools card above.
Census & demographics
- Census place
- Evansville, IN
- County
- Vanderburgh County · 146,793 people
- City population
- 146,793
- Metro
- Evansville, IN-KY
- Population (ZIP)
- 9,988
- Household income
- $40,873
- Rent vs Own
- Severe rent burden
- 735.0
Population outlook (Vanderburgh County) Hauer SSP2
- Today (2025)
- 187,038 people
- By 2030
- 188,907 · +1.0%
- By 2040
- 190,272 · +1.7%
- By 2050
- 188,871 · +1.0%
- By 2075
- 180,751 · -3.4%
- By 2100
- 163,015 · -12.8%
Race, ethnicity, and origin ACS 2023
- Neighborhood character
- Diverse neighborhood (Simpson 0.60)
- Race & ethnicity
- White 50% Black 39% Two or more races 7% Hispanic / Latino 3% Pacific Islander 1% Asian 1%
- Common ancestry
- Romanian 2% Lithuanian 1% Italian 1%
- Foreign-born
- 5% · Canada
- Languages at home
- 96% English-only · Spanish 2% Tagalog/Filipino 1% French/Haitian/Cajun 1%
Political lean MEDSL · Vanderburgh
- 2024 margin
- R (+12.7) · D 43.0% · R 55.6% · Other 1.4%
- 2008→2024 swing
- -15.1pp toward R · 2008: 2.5pp · 2024: -12.7pp
- All cycles
- 2024: R+12.7 2020: R+9.6 2016: R+16.9 2012: R+10.8 2008: D+2.5
Not yet ingested
- Civics
- —
Market trends
- HPI YoY
- ▼ -119.22%
- Current HPI
- 229.9312
- Rent YoY
- ▲ 9.87%
- Metro
- Evansville, IN-KY
- State GDP YoY
- ▲ 2.90%
- F500 in state
- 18
Industry mix (Fortune 500 HQ in IN)
| Industry | F500 HQs | Revenue |
|---|---|---|
| Industrial Machinery | 2 | $37B |
|
||
| Healthcare | 1 | $177B |
|
||
| Pharmaceuticals | 1 | $45B |
|
||
| Metals / Steel | 1 | $18B |
|
||
| Agriculture | 1 | $17B |
|
||
| Packaging | 1 | $12B |
|
||
Price history
-21.7% since first listed6 events — show timeline
- 2026-02-25 Pending — IRMLS
- 2026-01-08 Price Changed $90,000 IRMLS
- 2025-10-02 Listed $95,000 IRMLS
- 2024-11-22 Price Changed $109,000 IRMLS
- 2024-11-01 Listed $114,900 IRMLS
- 2022-07-18 Price Changed $850 RENT.
Property tax history
+3.7%/yrLatest (2024): $749 · +2.6% YoY. Source: county tax records.
Cash-flow waterfall
monthlySold comps — $/sqft
last 12 mo · ≤1 miLoading sold comps…