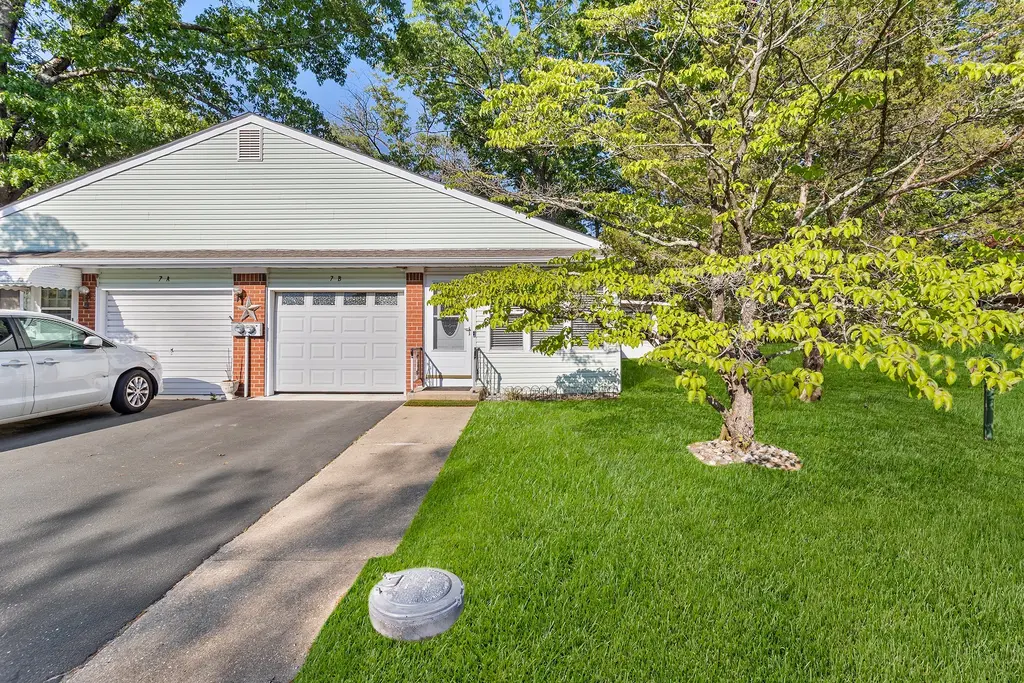
7-B Crocus · Crestwood Village, NJ
Flood risk 1/10 · Minimal
- FEMA flood zone
- X (unshaded)
- Chance of flooding over 30 yrs
- 0.0%
- Est. flood insurance / yr
- $507 – $1,088
Fire risk 6/10 · Moderate
- Est. fire insurance / yr
- $526 – $976
Heat risk 6/10 · Moderate
- Hot days now (above 103°F)
- 7 days/yr
- Hot days in 30 yrs
- 14 days/yr
Wind risk 6/10 · Moderate
- Chance of severe wind over 30 yrs
- 67.0%
Air-quality risk 3/10 · Minor
- Unhealthy air days now
- 2 days/yr
- Unhealthy air days in 30 yrs
- 4 days/yr
Risk factors via First Street. Map © Google.
Why this score? — see what drove the B- grade
The composite is a weighted blend of 9 inputs, each scored 0–100. Each bar is that input's sub-score; the figure is the points it added to the 100-point composite (weight × sub-score).
- Cash flow +27.3/30.0
- 1% rule +10.0/10.0
- DSCR +9.5/10.0
- ARV discount +7.5/15.0
- Condition / age +3.8/5.0
- Livability +3.2/5.0
- Schools +2.9/10.0
- Rent growth +2.5/5.0
- Appreciation +0.0/10.0
$130,000
🖨 Deal sheet (PDF) 📄 Offer letter ✓ Due diligence
Listing remarks
Move-in ready and beautifully maintained, this bright home offers easy living in the highly sought-after Crestwood 2, 55+ community with a private setting and bonus three-season room. Enter through a welcoming sunroom into a spacious, sun-filled interior featuring laminate and wood flooring, an updated eat-in kitchen, and a large living room that flows effortlessly into a standout 12x12 heated three-season room. Surrounded by windows and backing to a private setting, this space is ideal for relaxing or entertaining year-round. The home offers two generously sized bedrooms and a full bathroom, along with ample storage throughout. Additional highlights include a dedicated laundry room with a
Key facts
- Garage
- Listed 19 days
Property features AI
Finance
- Other: Ownership type: Cooperative
- HOA & community: Monthly coop fee of $362; Fee includes common area maintenance, lawn maintenance, management, recreation facility, snow removal, taxes, and trash; Community amenities include community center, common grounds, clubhouse, recreational center, shuffleboard, and other amenities
Exterior
- Parking: Attached front-entry garage (1 car)
- Utilities: Public water; Public sewer; Electric service
- Home design: Detached property; Single-level unit; No stairs (accessible); Located in a 55+ senior community
- Construction: Vinyl siding and brick construction; Shingle roof; Crawl space foundation; Above-grade structures
- Exterior features: Level lot
Interior
- Kitchen: Electric oven/range; Range hood; Refrigerator
- Bedrooms: 2 bedrooms on the main level
- Flooring: Hardwood; Laminated
- Bathrooms: 1 full bathroom on the main level
- Heating & cooling: Electric baseboard heating; Wall unit cooling; Electric hot water
- Interior features: Tub/shower; Ceiling fans; Eat-in kitchen; Wood floors; Attic; Other
- Laundry & utility: Laundry in unit
Neighborhood map
What this means for you Summary
Snapshot
- This is a 2-bed/1.0-bath single-family listed at $130k. Condition is rated good.
Deal economics
- At list price, monthly cash flow is $376 ($5k/yr) — positive.
- The deal already cash-flows at list — no discount required.
- Meets the 1% rule at list price ($2k rent vs $130k).
- Recommended offer: $128k (1.5% below list) — sets the bar for market timing.
- Cap rate 9.8% vs local median 5.5% in Crestwood Village — top-decile yield for the area; either an underpriced asset or a hidden risk that comps aren't pricing in. Stress-test before assuming the spread holds.
Location & tenants
- Location reads 63/100 on livability (#422 in NJ) — a middle-class / working-renter tenant base. Strengths: cost of living A, housing A, health & safety B+; Watch: schools F, amenities F, commute F.
- Manchester Township School District (suburban): math 25% / reading 44% proficiency, ranked #320 of 472 in NJ (top 68%) — families likely to look elsewhere, expect single-tenant / working-renter base with shorter leases.
- Market conditions: 658 active listings in the ZIP; 5 comparable units currently listed for rent nearby; rentals at typical pace (median 18d on market — plan ~3-4 weeks tenant-placement turnaround); 4,434 units permitted in Ocean County in 2024 (868 in 5+ unit buildings).
Forward outlook
- Local home prices are declining (-3.0%/yr); year-one equity from $899 of loan paydown is wiped out by about $4k of value loss. Plan a longer hold.
- Ocean County population projected to shrink 8% by 2050 — rents likely to lag national; underwrite the cash flow, not the appreciation.
- At projected returns (-3.0% appreciation + 3.0% rent growth), your $36k cash investment doubles in ~9 years — after that, you're playing with house money.
Negotiation context
- It's been on market 19 days — a 2% lower offer ($128k) is reasonable based on typical stale-listing flexibility.
Risks & watch-outs
- Climate carrying-cost: major wind risk, 67% chance of damaging wind over 30y; major wildfire risk; extreme-heat days projected 7→14/yr by 2055 (HVAC capex compounding) — expect insurance premiums to compound above CPI over the hold.
Questions for the listing agent
- What does the HOA fee cover, when was the last increase, and are there any pending special assessments or reserve-fund shortfalls?
- Is there a deadline driving the sale (1031 exchange, divorce, estate, relocation)? That informs how much negotiation room exists.
- Schools are F-rated, which usually means shorter tenancies and higher turnover. Who's the typical renter profile here, and what's been the actual vacancy rate?
- What's the average days-on-market for RENTAL listings here right now (not sales)? A rising rental-DOM trend means longer vacancies and softer asking-rent achievability than the comps imply.
- What's the recent tenant-quality profile in this submarket — average credit score on applications, eviction rate, late-payment / NSF rate, and stable-employment percentage? A property-management company in the area should have these aggregated.
- How much new for-sale + rental construction is in the pipeline within 1–3 miles? Heavy new supply typically softens prices + rents 12–24 months out; constrained supply supports both.
Investment metrics
- 1% rule
- 1.59% ✓
- Cap rate
- 9.76%
- Cash-on-cash
- 12.38%
- DSCR
- 1.55
- GRM
- 5.2
CMA / ARV
- ARV (on-the-fly)
- $283,040
- Comps found
- 12
Show comp detail 12 sales within ~0.75 mi
| Address | Dist | Beds/Ba | Sqft | Sold | Price | $/sf | Match |
|---|---|---|---|---|---|---|---|
| 1B Myrtle Pl | 0.08mi | 2/1.5 | 1,220 (0%) | 5mo | $140,000 | $115 | 90 |
| 5 A Verbina Ct | 0.13mi | 2/1.0 | 1,216 (-0%) | 7mo | $89,000 | $73 | 88 |
| 27 Crocus Ln Unit B | 0.22mi | 2/1.5 | 1,220 (0%) | 7mo | $140,000 | $115 | 82 |
| 1 Morning Glory Ln | 0.38mi | 2/2.0 | 1,312 (+8%) | 1mo | $305,000 | $232 | 65 |
| 701 Orchid St | 0.43mi | 2/2.0 | 1,140 (-7%) | 1mo | $300,000 | $263 | 64 |
| 166 Morning Glory Ln N | 0.28mi | 2/2.0 | 1,346 (+10%) | 5mo | $275,000 | $204 | 62 |
| 553 Petunia Ln N | 0.41mi | 2/2.0 | 1,140 (-7%) | 6mo | $311,500 | $273 | 61 |
| 71 Morning Glory Ln | 0.27mi | 2/2.0 | 1,380 (+13%) | 1mo | $284,450 | $206 | 61 |
| 519 Petunia Ln N | 0.44mi | 2/2.0 | 1,140 (-7%) | 5mo | $275,000 | $241 | 60 |
| 551 Petunia Ln N | 0.40mi | 2/2.0 | 1,312 (+8%) | 9mo | $300,000 | $229 | 58 |
| 550 Petunia Ln N | 0.36mi | 2/2.0 | 1,346 (+10%) | 6mo | $360,000 | $267 | 57 |
| 636 Petunia Ln S | 0.49mi | 2/2.0 | 1,312 (+8%) | 5mo | $335,000 | $255 | 57 |
Match score weights: distance 35% · size 25% · config 20% · recency 20%. Top-matched comps best support the ARV.
Projected returns pro-forma
-3.0% appreciation · 3.0% rent growth · sell at horizon
- IRR
- 2.2%
- Equity multiple
- 1.09×
- Total profit
- $3,107
- Equity at exit
- $19,383
- IRR
- 12.0%
- Equity multiple
- 1.95×
- Total profit
- $34,535
- Equity at exit
- $11,240
Cash invested: $36,400 (down + closing). Projections, not guarantees.
Landlord ↔ Tenant lean methodology
- Overall (STATE)
- 21 Tenant-Leaning
- State New Jersey
- 21 Tenant-Leaning · D+6
- County
- — inherits STATE
- City
- — inherits STATE
ZIP-level market 08759
- Active inventory
- 658
- Price-to-rent
- 5.2×
Monthly cashflow live
- Estimated rent
- $2,071 medium interval (Pro) →
- Mortgage (P&I)
- −$682
- Tax est. 1.5%
- −$162 /mo · $1,950/yr
- Insurance
- −$54
- HOA
- −$362
- Vacancy / Maint / Mgmt
- −$435
- Net cashflow
- $376
Break-even live
Sensitivity live
| Price | -10% $465 | -5% $420 | +0% $376 | +5% $331 | +10% $286 |
|---|---|---|---|---|---|
| Rent | -10% $212 | -5% $294 | +0% $376 | +5% $457 | +10% $539 |
| Rate | -1.0pp $441 | -0.5pp $409 | base $376 | +0.5pp $342 | +1.0pp $308 |
UW: 25.0% down · 7.5% · 30yr · 1.5% tax · 5.0% vac · 8.0% maint · 8.0% mgmt
Financing live
Cash to close
- Down payment
- $32,500
- Closing costs
- $3,900
- Reserves months
- —
- Total cash needed
- —
Loan-product check · same deal, 3 products live
Conventional
25% down · 7.5% · 30yr
- Down + closing
- —
- Monthly P&I
- —
- Monthly cashflow
- —
- DSCR
- —
- Eligible?
- —
Personal DTI + credit; lowest rate.
DSCR
20% down · 8.5% · 30yr
- Down + closing
- —
- Monthly P&I
- —
- Monthly cashflow
- —
- DSCR
- —
- Eligible?
- —
No personal income docs; deal must DSCR.
Hard money
10% down · 12.0% · 12mo
- Down + closing
- —
- Monthly P&I
- —
- Monthly cashflow
- —
- DSCR
- —
- Eligible?
- —
Short-term bridge; refi at stabilization.
Rent comps 5 comps
| Address | Beds | Baths | Sqft | Rent | $/sqft | DOM | Units | Dist |
|---|---|---|---|---|---|---|---|---|
| 1 Morning Glory Ln Whiting, NJ | 2.0 | 2.5 | 1312 | $1,200 | $0.91 | 4d | 1 | 0.38mi |
| 49 Westport Dr #71 Whiting, NJ | 2.0 | 1.5 | 1192 | $1,995 | $1.67 | 44d | 1 | 1.13mi |
| 50 Westport Dr #71 Whiting, NJ | 2.0 | 1.0 | 1120 | $2,200 | $1.96 | 0d | 1 | 1.16mi |
| 57D Milford Ave Unit 53 Whiting, NJ | 2.0 | 1.0 | 880 | $1,800 | $2.05 | 25d | 1 | 1.25mi |
| 19B Maplewood Dr #52 Whiting, NJ | 2.0 | 1.5 | 1109 | $2,250 | $2.03 | 17d | 1 | 1.36mi |
HOA detail
- Monthly dues
- $362 · $4,344/yr
Listing history 10 events
-
2026-06-10status $130,000 Pending 19 DOM
-
2026-06-09days on market $130,000 Active 19 DOM
-
2026-06-08days on market $130,000 Active 18 DOM
-
2026-06-07days on market $130,000 Active 17 DOM
-
2026-06-04days on market $130,000 Active 14 DOM
-
2026-06-03days on market $130,000 Active 13 DOM
-
2026-06-02days on market $130,000 Active 12 DOM
-
2026-06-01days on market $130,000 Active 11 DOM
-
2026-05-31days on market $130,000 Active 10 DOM
-
2026-05-19historical $130,000 1281-char remark
ⓘ Source: listings_history table (triggers on properties + properties_extension) + one-shot
backfill from property_details.listing_events for pre-trigger history.
Climate risk First Street
- Flood 1/10 Low FEMA zone X (unshaded) · 0% chance over 30 yrs
- Wildfire 6/10 Major
- Heat 6/10 Major 7 d/yr ≥103°F today · 14 d/yr by 30 yrs out
- Wind 6/10 Major 67% chance of damaging wind over 30 yrs
- Air quality 3/10 Moderate 2 unhealthy d/yr today · 4 by 30 yrs out
Nearby sold comps map
Loading sold comps map…
Walkable amenities ~0.75 mi
Loading nearby amenities…
Taxation est. · year 1
- Rental income
- $24,850
- − Mortgage interest
- −$7,282
- − Property taxes
- −$1,950
- − Insurance
- −$650
- − Repairs & maintenance
- −$1,988
- − Management
- −$1,988
- − HOA
- −$4,344
- − Depreciation
- −$3,782
- Taxable income
- $2,866
- Est. tax owed @ 24.0%
- −$688
- After-tax cash flow
- $3,819/yr
For passive investors: Depreciation is non-cash, so a rental often shows a tax loss while cash-flowing — sheltering income. Rental losses are passive: they offset passive income freely, and up to $25,000/yr can offset ordinary (W-2) income if you actively participate and your MAGI is under $100k (phasing out to $0 by $150k); unused losses carry forward. On sale, claimed depreciation is recaptured at up to 25%, and gains may owe capital-gains tax (a 1031 exchange can defer both). Figures are a year-1 estimate at your 24.0% rate — not tax advice; consult a CPA.
Condition & rehab AI · 26 photos
This move-in ready home in Crestwood Village offers a bright and spacious interior with updated kitchen and bathrooms, and a well-maintained exterior with a private setting.
Value-add opportunities
- Both paint exterior — enhances curb appeal and resale value
- Both paint interior walls — enhances interior appearance and resale value
Renovation cost estimate screening
Value-add ROI direction
- Both paint exterior — enhances curb appeal and resale value ↑
- Both paint interior walls — enhances interior appearance and resale value ↑
ⓘ Cost ranges are severity-bucket heuristics (US national rule-of-thumb). Get contractor quotes + a written scope before underwriting a rehab budget.
Schools (NCES district)
- District
- Manchester Township School District
- NCES district ID
- 3409450
- Math proficiency
- 25% ▼ -17.00%
- Reading proficiency
- 44% ▼ -5.00%
- Median HH income
- $38,905
- Composite
- 28.8/100
- National rank
- #6662
- State rank
- #320 of 472 in NJ
Livability — Crestwood Village
- Score
- 63/100
- State rank
- #422
- US rank
- #15006
Category grades
Schools grade is shown separately in the Schools card above.
Census & demographics
- Census place
- Crestwood Village, NJ
- City population
- 34,290
- Population (ZIP)
- 34,290
Population outlook (Ocean County) Hauer SSP2
- Today (2025)
- 586,991 people
- By 2030
- 581,403 · -1.0%
- By 2040
- 564,913 · -3.8%
- By 2050
- 538,149 · -8.3%
- By 2075
- 468,845 · -20.1%
- By 2100
- 350,297 · -40.3%
Race, ethnicity, and origin ACS 2023
- Neighborhood character
- Predominantly White (87%)
- Race & ethnicity
- White 87% Hispanic / Latino 5% Black 4% Two or more races 4% Asian 2%
- Hispanic origin (detail)
- Puerto Rican 2%
- Common ancestry
- Romanian 8% Scotch-Irish 2% Lithuanian 2%
- Foreign-born
- 11% · Canada, China
- Languages at home
- 88% English-only · Spanish 3% Russian/Polish/Slavic 2% Other Indo-European 2%
Political lean MEDSL · Ocean
- 2024 margin
- Solid R (+36.0) · D 31.4% · R 67.4% · Other 1.2%
- 2008→2024 swing
- -17.6pp toward R · 2008: -18.4pp · 2024: -36.0pp
- All cycles
- 2024: R+36.0 2020: R+28.7 2016: R+34.0 2012: R+17.7 2008: R+18.4
Not yet ingested
- Civics
- —
Market trends
- HPI YoY
- ▼ -347.85%
- Current HPI
- 274.4679
- Rent YoY
- —
- Metro
- —
- State GDP YoY
- ▲ 2.05%
- F500 in state
- 34
Industry mix (Fortune 500 HQ in NJ)
| Industry | F500 HQs | Revenue |
|---|---|---|
| Consumer Goods | 3 | $31B |
|
||
| Pharmaceuticals | 2 | $153B |
|
||
| Technology | 2 | $21B |
|
||
| Insurance | 2 | $20B |
|
||
| Healthcare | 2 | $19B |
|
||
| Financial Services | 1 | $70B |
|
||
Price history
+0.0% since first listed3 events — show timeline
- 2026-06-09 Pending — BRIGHT MLS
- 2026-05-22 Listed $130,000 BRIGHT MLS
- 2026-05-19 Coming Soon $130,000 BRIGHT MLS
Cash-flow waterfall
monthlySold comps — $/sqft
last 12 mo · ≤1 miLoading sold comps…