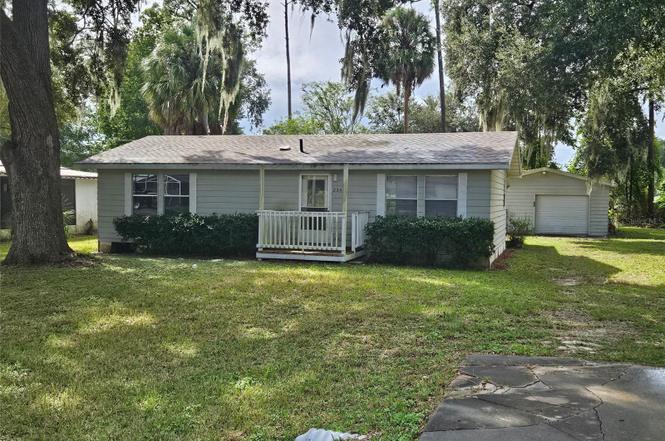
2344 SE 175th Ter · Silver Springs, FL
Flood risk 1/10 · Minimal
- FEMA flood zone
- X (unshaded)
- Chance of flooding over 30 yrs
- 0.0%
- Est. flood insurance / yr
- $507 – $1,088
Fire risk 7/10 · Major
- Est. fire insurance / yr
- $947 – $1,759
Heat risk 8/10 · Major
- Hot days now (above 109°F)
- 7 days/yr
- Hot days in 30 yrs
- 21 days/yr
Wind risk 9/10 · Severe
- Chance of severe wind over 30 yrs
- 99.0%
Air-quality risk 3/10 · Minor
- Unhealthy air days now
- 2 days/yr
- Unhealthy air days in 30 yrs
- 3 days/yr
Risk factors via First Street. Map © Google.
Why this score? — see what drove the D grade
The composite is a weighted blend of 9 inputs, each scored 0–100. Each bar is that input's sub-score; the figure is the points it added to the 100-point composite (weight × sub-score).
- Cash flow +14.8/30.0
- ARV discount +7.5/15.0
- DSCR +4.5/10.0
- 1% rule +4.0/10.0
- Schools +3.6/10.0
- Rent growth +2.5/5.0
- Livability +2.5/5.0
- Condition / age +2.5/5.0
- Appreciation +0.0/10.0
$139,900
🖨 Deal sheet (PDF) 📄 Offer letter ✓ Due diligence
Listing remarks
Are you a snowbird looking for that winter retreat? Are you looking to downsize? This is the home for you. This 2 bedroom, 1 bath home offers all you are looking for. Escape the city life with easy maintenance, large workshop and access to one of the best fishing lakes around. Close enough to go shopping but far enough to relax without the noise (except the wildlife). Come for your visit soon.
Key facts
- Easy maintenance
- Large workshop
- Fishing lakes
Tags
Neighborhood map
What this means for you Summary
Snapshot
- This is a 2-bed/1.0-bath single-family listed at $140k.
Deal economics
- At list price, monthly cash flow is $39 ($474/yr) — positive.
- The deal already cash-flows at list — no discount required.
- To meet the 1% rule (rent ≥ 1% of price), the offer needs to be $126k (9.9% below list).
- Recommended offer: $123k (12.0% below list) — sets the bar for market timing.
- Cap rate 6.6% vs local median 4.6% in Silver Springs — top-decile yield for the area; either an underpriced asset or a hidden risk that comps aren't pricing in. Stress-test before assuming the spread holds.
Location & tenants
- Location reads: area grade D — affects rentability + tenant quality, not the cash-flow math above.
- Marion (rural): math 42% / reading 43% proficiency, ranked #61 of 73 in FL (top 84%) — families likely to look elsewhere, expect single-tenant / working-renter base with shorter leases; 61% free/reduced lunch — lower-income household profile, screen leases tightly.
- Zoned schools: Fort Mccoy School (math 35% / reading 35%, grade F, #1,697 of 2,144 statewide, top 80%, 964 students, 73% FRL); Lake Weir High School (math 23% / reading 34%, grade F, #458 of 667 statewide, top 69%, 1,483 students, 68% FRL).
- Market conditions: 202 active listings in the ZIP; 7,071 units permitted in Marion County in 2024 (534 in 5+ unit buildings).
Forward outlook
- Local home prices are declining (-3.0%/yr); year-one equity from $967 of loan paydown is wiped out by about $4k of value loss. Plan a longer hold.
- Marion County population projected at +13% by 2050 — modest demand growth; plan on rents tracking national, not racing it.
Negotiation context
- It's been on market 176 days — a 12% lower offer ($123k) is reasonable based on typical stale-listing flexibility.
- 4 sale attempts since 2y ago with the ask held roughly flat each time — persistent listings suggest the price (not the market) is what's stuck; bring a comps-based counter.
- Current owner paid $6k; list at $140k implies a 2156% gain — meaningful room to come down on a strong offer.
Risks & watch-outs
- Climate carrying-cost: severe wind risk, 99% chance of damaging wind over 30y; major wildfire risk; extreme-heat days projected 7→21/yr by 2055 (HVAC capex compounding) — expect insurance premiums to compound above CPI over the hold.
Questions for the listing agent
- It's been on market 176 days. Have you received any prior offers? Is the seller open to a 12% concession, seller financing, or rate buy-down credit?
- What does the HOA fee cover, when was the last increase, and are there any pending special assessments or reserve-fund shortfalls?
- Why hasn't it sold? Are there any deal-killer items the seller is aware of (foundation, flood, title, zoning, code violations)?
- Is there a deadline driving the sale (1031 exchange, divorce, estate, relocation)? That informs how much negotiation room exists.
- The area grade is low — what's the realistic commute time and amenity access for the typical tenant pool here? Any planned neighborhood developments (good or bad) we should know about?
- What's the average days-on-market for RENTAL listings here right now (not sales)? A rising rental-DOM trend means longer vacancies and softer asking-rent achievability than the comps imply.
- What's the recent tenant-quality profile in this submarket — average credit score on applications, eviction rate, late-payment / NSF rate, and stable-employment percentage? A property-management company in the area should have these aggregated.
- How much new for-sale + rental construction is in the pipeline within 1–3 miles? Heavy new supply typically softens prices + rents 12–24 months out; constrained supply supports both.
Investment metrics
- 1% rule
- 0.90% ✗
- Cap rate
- 6.63%
- Cash-on-cash
- 1.21%
- DSCR
- 1.05
- GRM
- 9.2
CMA / ARV
- ARV (on-the-fly)
- $89,280
- Comps found
- 2
Show comp detail 2 sales within ~0.75 mi
| Address | Dist | Beds/Ba | Sqft | Sold | Price | $/sf | Match |
|---|---|---|---|---|---|---|---|
| 2531 SE 178th Ave | 0.31mi | 2/2.0 | 1,056 (+10%) | 14mo | $68,500 | $65 | 53 |
| 1376 SE 173rd Ct | 0.65mi | 2/2.0 | 966 (+1%) | 23mo | $90,000 | $93 | 45 |
Match score weights: distance 35% · size 25% · config 20% · recency 20%. Top-matched comps best support the ARV.
Projected returns pro-forma
-3.0% appreciation · 3.0% rent growth · sell at horizon
- IRR
- -14.4%
- Equity multiple
- 0.49×
- Total profit
- $-20,143
- Equity at exit
- $20,860
- IRR
- -5.6%
- Equity multiple
- 0.64×
- Total profit
- $-14,252
- Equity at exit
- $12,096
Cash invested: $39,172 (down + closing). Projections, not guarantees.
Landlord ↔ Tenant lean methodology
- Overall (STATE)
- 87 Strongly Landlord-Friendly
- State Florida
- 87 Strongly Landlord-Friendly · R+3
- County
- — inherits STATE
- City
- — inherits STATE
ZIP-level market 34488
- Home prices YoY
- -26.1%
- Active inventory
- 202
- Price-to-rent
- 9.2×
Monthly cashflow live
- Estimated rent
- $1,261 medium interval (Pro) →
- Mortgage (P&I)
- −$734
- Tax from tax record
- −$163 /mo · $1,953/yr
- Insurance
- −$58
- HOA
- −$2
- Vacancy / Maint / Mgmt
- −$265
- Net cashflow
- $39
Break-even live
Sensitivity live
| Price | -10% $119 | -5% $79 | +0% $39 | +5% $0 | +10% $-40 |
|---|---|---|---|---|---|
| Rent | -10% $-60 | -5% $-10 | +0% $39 | +5% $89 | +10% $139 |
| Rate | -1.0pp $110 | -0.5pp $75 | base $39 | +0.5pp $3 | +1.0pp $-34 |
UW: 25.0% down · 7.5% · 30yr · 1.5% tax · 5.0% vac · 8.0% maint · 8.0% mgmt
Financing live
Cash to close
- Down payment
- $34,975
- Closing costs
- $4,197
- Reserves months
- —
- Total cash needed
- —
Loan-product check · same deal, 3 products live
Conventional
25% down · 7.5% · 30yr
- Down + closing
- —
- Monthly P&I
- —
- Monthly cashflow
- —
- DSCR
- —
- Eligible?
- —
Personal DTI + credit; lowest rate.
DSCR
20% down · 8.5% · 30yr
- Down + closing
- —
- Monthly P&I
- —
- Monthly cashflow
- —
- DSCR
- —
- Eligible?
- —
No personal income docs; deal must DSCR.
Hard money
10% down · 12.0% · 12mo
- Down + closing
- —
- Monthly P&I
- —
- Monthly cashflow
- —
- DSCR
- —
- Eligible?
- —
Short-term bridge; refi at stabilization.
HOA detail
- Monthly dues
- $2 · $24/yr
Listing history 17 events
-
2026-06-22days on market $139,900 Active 176 DOM
-
2026-06-18days on market $139,900 Active 173 DOM
-
2026-06-17days on market $139,900 Active 172 DOM
-
2026-06-16days on market $139,900 Active 171 DOM
-
2026-06-15days on market $139,900 Active 170 DOM
-
2026-06-14days on market $139,900 Active 168 DOM
-
2026-06-13days on market $139,900 Active 167 DOM
-
2026-06-10statusdays on market $139,900 Active 165 DOM
-
2026-04-01status Pending
-
2026-02-12status Active
-
2026-02-03status Pending
-
2025-10-10$139,900 Active
-
2024-11-01historical
-
2024-07-02status Active
-
2024-07-01status Pending
-
2024-06-25$165,000 Active
-
1992-01-01soldstatus $6,200
ⓘ Source: listings_history table (triggers on properties + properties_extension) + one-shot
backfill from property_details.listing_events for pre-trigger history.
Tax reassessment forecast FL · Resets to sale price
- Current annual tax
- $1,953 · $163/mo
- Projected year-2 tax
- $1,953 · $163/mo
- Expected delta
- $0/yr ($0/mo · 0.0%)
ⓘ Screening estimate from a state-policy table — verify with the county assessor before closing.
Climate risk First Street
- Flood 1/10 Low FEMA zone X (unshaded) · 0% chance over 30 yrs
- Wildfire 7/10 Severe
- Heat 8/10 Severe 7 d/yr ≥109°F today · 21 d/yr by 30 yrs out
- Wind 9/10 Extreme 99% chance of damaging wind over 30 yrs
- Air quality 3/10 Moderate 2 unhealthy d/yr today · 3 by 30 yrs out
Nearby sold comps map
Loading sold comps map…
Walkable amenities ~0.75 mi
Loading nearby amenities…
Taxation est. · year 1
- Rental income
- $15,131
- − Mortgage interest
- −$7,837
- − Property taxes
- −$1,953
- − Insurance
- −$700
- − Repairs & maintenance
- −$1,210
- − Management
- −$1,210
- − HOA
- −$24
- − Depreciation
- −$4,070
- Taxable loss
- −$1,872
- Est. tax savings @ 24.0%
- +$449
- After-tax cash flow
- $923/yr
For passive investors: Depreciation is non-cash, so a rental often shows a tax loss while cash-flowing — sheltering income. Rental losses are passive: they offset passive income freely, and up to $25,000/yr can offset ordinary (W-2) income if you actively participate and your MAGI is under $100k (phasing out to $0 by $150k); unused losses carry forward. On sale, claimed depreciation is recaptured at up to 25%, and gains may owe capital-gains tax (a 1031 exchange can defer both). Figures are a year-1 estimate at your 24.0% rate — not tax advice; consult a CPA.
Schools (NCES district)
- District
- Marion
- NCES district ID
- 1201260
- Math proficiency
- 42% ▼ -7.00%
- Reading proficiency
- 43% ▼ -4.00%
- Median HH income
- $40,015
- Composite
- 35.61/100
- National rank
- #4890
- State rank
- #61 of 73 in FL
Livability — Silver Springs
No livability data for this city. (Only ~50 U.S. cities are tracked.)
Census & demographics
- Population (ZIP)
- 11,525
Population outlook (Marion County) Hauer SSP2
- Today (2025)
- 365,905 people
- By 2030
- 376,768 · +3.0%
- By 2040
- 396,555 · +8.4%
- By 2050
- 412,723 · +12.8%
- By 2075
- 446,090 · +21.9%
- By 2100
- 436,193 · +19.2%
Race, ethnicity, and origin ACS 2023
- Neighborhood character
- Predominantly White (79%)
- Race & ethnicity
- White 79% Hispanic / Latino 9% Two or more races 8% Black 8%
- Hispanic origin (detail)
- Puerto Rican 6%
- Common ancestry
- Serbian 2% Romanian 2% Lithuanian 2%
- Foreign-born
- 2% · Canada
- Languages at home
- 90% English-only · Spanish 7% Other Indo-European 2%
Political lean MEDSL · Marion
- 2024 margin
- Solid R (+31.6) · D 33.8% · R 65.5%
- 2008→2024 swing
- -20.0pp toward R · 2008: -11.6pp · 2024: -31.6pp
- All cycles
- 2024: R+31.6 2020: R+25.9 2016: R+26.2 2012: R+16.2 2008: R+11.6
Not yet ingested
- Civics
- —
Market trends
- HPI YoY
- ▼ -80.45%
- Current HPI
- 227.3763
- Rent YoY
- —
- Metro
- —
- State GDP YoY
- ▲ 3.28%
- F500 in state
- 36
Industry mix (Fortune 500 HQ in FL)
| Industry | F500 HQs | Revenue |
|---|---|---|
| Industrial Technology | 2 | $29B |
|
||
| Insurance | 2 | $17B |
|
||
| Retail | 1 | $60B |
|
||
| Technology Distribution | 1 | $58B |
|
||
| Homebuilding | 1 | $35B |
|
||
| Technology Manufacturing | 1 | $35B |
|
||
Price history
+2156.5% since first listed9 events — show timeline
- 2026-04-01 Pending — Stellar MLS as Distributed by MLS Grid
- 2026-02-12 Relisted — Stellar MLS as Distributed by MLS Grid
- 2026-02-03 Pending — Stellar MLS as Distributed by MLS Grid
- 2025-10-10 Listed $139,900 Stellar MLS as Distributed by MLS Grid
- 2024-11-01 Listing Removed — Stellar MLS as Distributed by MLS Grid
- 2024-07-02 Relisted — Stellar MLS as Distributed by MLS Grid
- 2024-07-01 Pending — Stellar MLS as Distributed by MLS Grid
- 2024-06-25 Listed $165,000 Stellar MLS as Distributed by MLS Grid
- 1992-01-01 Sold (Public Records) $6,200 Public Records
Property tax history
+12.6%/yrLatest (2025): $1,953 · +213.9% YoY. Source: county tax records.
Cash-flow waterfall
monthlySold comps — $/sqft
last 12 mo · ≤1 miLoading sold comps…