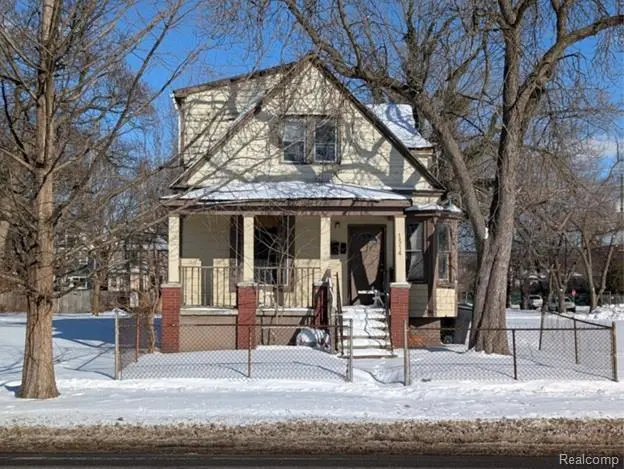
1514 Van Dyke St · Detroit, MI
Flood risk 1/10 · Minimal
- FEMA flood zone
- X (unshaded)
- Chance of flooding over 30 yrs
- 0.0%
- Est. flood insurance / yr
- $473 – $860
Fire risk 1/10 · Minimal
- Est. fire insurance / yr
- $784 – $1,456
Heat risk 3/10 · Minor
- Hot days now (above 96°F)
- 7 days/yr
- Hot days in 30 yrs
- 15 days/yr
Wind risk 2/10 · Minimal
- Chance of severe wind over 30 yrs
- —
Air-quality risk 3/10 · Minor
- Unhealthy air days now
- 2 days/yr
- Unhealthy air days in 30 yrs
- 5 days/yr
Risk factors via First Street. Map © Google.
Why this score? — see what drove the D grade
The composite is a weighted blend of 9 inputs, each scored 0–100. Each bar is that input's sub-score; the figure is the points it added to the 100-point composite (weight × sub-score).
- Cash flow +15.0/30.0
- ARV discount +7.5/15.0
- 1% rule +5.0/10.0
- DSCR +5.0/10.0
- Livability +3.7/5.0
- Rent growth +2.5/5.0
- Schools +1.3/10.0
- Condition / age +1.0/5.0
- Appreciation +0.0/10.0
$1
🖨 Deal sheet 📄 Offer letter ✓ Due diligence
Listing remarks MLS
* * * Please Read All The Remarks To Ensure Your Full Understanding of What's Being Offered * * * A rare opportunity to preserve an early West Village worker era home and keep Detroit history in the built environment. This late nineteenth century wood frame dwelling remains clearly historic and features a distinctive corner bay at the front porch. The structure is currently vacant and reflects long term deferred maintenance. City historic staff have identified similar homes in the area as worthy of preservation and relocation where feasible. These offerings are for the historic structures only. No land is included. The structure is being made available at no cost to a qualified recipient who is willing and able to fund all expenses associated with preservation, deconstruction, lifting, loading, transportation, permits, site safety, insurance, and any required restoration of the origin site. The structure is conveyed as is, where is, with all faults, and with no representations or warranties. Interior access, room count, bathroom count, square footage, and all structural conditions are not represented and must be independently verified by the recipient. Brokers and prospective purchasers should not rely on the listing for accurate information. Broker to confirm all data. A waiver must be fully executed before any tours. The 1514 Van Dyke listing is available in conjunction with MLS Listing #: 20261008575 (1532 Van Dyke).
Key facts
- 4,792 sq ft lot
- Built 1912
- Listed 109 days
Tags
Neighborhood map
What this means for you Summary
Snapshot
- This is a 3-bed/1.5-bath single-family listed at $1. Condition is rated poor.
Deal economics
- At list price, monthly cash flow is $2k ($19k/yr) — positive.
- The deal already cash-flows at list — no discount required.
- Meets the 1% rule at list price ($2k rent vs $1).
- Cap rate 1852153.0% vs local median 10.2% in Detroit — top-decile yield for the area; either an underpriced asset or a hidden risk that comps aren't pricing in. Stress-test before assuming the spread holds.
Location & tenants
- Location reads 73/100 on livability (#218 in MI) — a middle-class / working-renter tenant base. Strengths: amenities A+, commute A+, cost of living A+; Watch: schools F, crime F, employment F.
- Detroit Public Schools Community District (urban): math 10% / reading 24% proficiency, ranked #499 of 540 in MI (top 92%) — low school quality limits family demand, transient renter base, plan for 1-2y turnover; 90% free/reduced lunch — lower-income household profile, screen leases tightly.
- Market conditions: 298 active listings in the ZIP; 23 comparable units currently listed for rent nearby; rentals at typical pace (median 24d on market — plan ~3-4 weeks tenant-placement turnaround); 48% of comp listings sitting > 30 days — soft ceiling on asking rent; lower-income renter base — watch delinquency; 2,639 units permitted in Wayne County in 2024 (1,216 in 5+ unit buildings).
- At $1,954/mo this rent would consume 70% of the median local household income ($34k/yr) (locally 1364% of renters already pay >50% of income on rent) — very limited rent-growth headroom before tenants either downsize or default.
Forward outlook
- Local home prices are declining (-3.0%/yr); year-one equity from $0 of loan paydown is wiped out by about $0 of value loss. Plan a longer hold.
- Wayne County population projected at -17% by 2050 — secular population decline; favor cash flow + early exit over multi-decade hold.
- At projected returns (-3.0% appreciation + 3.0% rent growth), your $0 cash investment doubles in ~1 year — after that, you're playing with house money.
Negotiation context
- It's been on market 110 days — a 9% lower offer ($0) is reasonable based on typical stale-listing flexibility.
- 4 sale attempts since 8y ago with the ask held roughly flat each time — persistent listings suggest the price (not the market) is what's stuck; bring a comps-based counter.
Risks & watch-outs
- Watch-outs: built in 1912 — expect roof / HVAC / electrical / plumbing capex.
Questions for the listing agent
- It's been on market 110 days. Have you received any prior offers? Is the seller open to a 5% concession, seller financing, or rate buy-down credit?
- Have any recent inspections been done? Can we get a copy of the seller's disclosures and any deferred-maintenance estimates?
- Built in 1912 — when were the roof, HVAC, electrical panel, plumbing, and water heater last replaced?
- Why hasn't it sold? Are there any deal-killer items the seller is aware of (foundation, flood, title, zoning, code violations)?
- Is there a deadline driving the sale (1031 exchange, divorce, estate, relocation)? That informs how much negotiation room exists.
- Schools are F-rated, which usually means shorter tenancies and higher turnover. Who's the typical renter profile here, and what's been the actual vacancy rate?
- Crime grade is F in this area — have there been break-ins, vandalism, or insurance claims at this property in the last 3 years? What carrier currently insures it and at what premium?
- The area grade is low — what's the realistic commute time and amenity access for the typical tenant pool here? Any planned neighborhood developments (good or bad) we should know about?
- What's the average days-on-market for RENTAL listings here right now (not sales)? A rising rental-DOM trend means longer vacancies and softer asking-rent achievability than the comps imply.
- What's the recent tenant-quality profile in this submarket — average credit score on applications, eviction rate, late-payment / NSF rate, and stable-employment percentage? A property-management company in the area should have these aggregated.
- How much new for-sale + rental construction is in the pipeline within 1–3 miles? Heavy new supply typically softens prices + rents 12–24 months out; constrained supply supports both.
Investment metrics
- 1% rule
- 195375.00% ✓
- Cap rate
- 1852153.00%
- Cash-on-cash
- 6614809.67%
- DSCR
- 294322.81
- GRM
- 0.0
CMA / ARV
- ARV (median comp)
- $329,192
- List price
- $1
- Delta
- -100.00%
- Verdict
- UNDERPRICED
- Comps
- 20 within 1.0 mi
Show comp detail 12 sales within ~0.75 mi
| Address | Dist | Beds/Ba | Sqft | Sold | Price | $/sf | Match |
|---|---|---|---|---|---|---|---|
| 1474 Shipherd St | 0.08mi | 4/1.5 (+1) | 1,437 (-7%) | 4mo | $315,000 | $219 | 76 |
| 1752 Fischer St | 0.41mi | 2/2.0 (-1) | 1,556 (+1%) | 2mo | $350,100 | $225 | 72 |
| 2509 Beals St | 0.45mi | 3/1.5 | 1,500 (-3%) | 7mo | $307,000 | $205 | 68 |
| 1415 Baldwin St | 0.22mi | 3/2.0 | 1,720 (+11%) | 3mo | $150,000 | $87 | 67 |
| 1738 Fischer St | 0.40mi | 2/2.0 (-1) | 1,556 (+1%) | 8mo | $360,000 | $231 | 66 |
| 1400 Helen St | 0.52mi | 3/2.0 | 1,464 (-5%) | 3mo | $220,000 | $150 | 63 |
| 2559 Helen St | 0.72mi | 3/1.5 | 1,508 (-2%) | 3mo | $85,000 | $56 | 60 |
| 2270 Parker St | 0.30mi | 3/1.0 | 1,319 (-15%) | 4mo | $217,500 | $165 | 56 |
| 2516 Baldwin St | 0.48mi | 3/2.5 | 1,690 (+9%) | 4mo | $315,000 | $186 | 55 |
| 2476 Beals St | 0.42mi | 3/1.5 | 1,324 (-14%) | 6mo | $287,900 | $217 | 52 |
| 1742 Fischer St | 0.40mi | 2/2.5 (-1) | 1,773 (+15%) | 7mo | $400,000 | $226 | 42 |
| 1595 Belvidere St | 0.63mi | 2/2.5 (-1) | 1,725 (+12%) | 3mo | $410,270 | $238 | 40 |
Match score weights: distance 35% · size 25% · config 20% · recency 20%. Top-matched comps best support the ARV.
Projected returns pro-forma
-3.0% appreciation · 3.0% rent growth · sell at horizon
- IRR
- —
- Equity multiple
- 351189.65×
- Total profit
- $98,333
- Equity at exit
- $0
- IRR
- —
- Equity multiple
- 758314.30×
- Total profit
- $212,328
- Equity at exit
- $0
Cash invested: $0 (down + closing). Projections, not guarantees.
Landlord ↔ Tenant lean methodology
- Overall (STATE)
- 62 Landlord-Friendly
- State Michigan
- 62 Landlord-Friendly · EVEN
- County
- — inherits STATE
- City
- — inherits STATE
ZIP-level market 48214
- Active inventory
- 298
Monthly cashflow live
- Estimated rent
- $1,954 high interval (Pro) →
- Mortgage (P&I)
- −$0
- Tax est. 1.5%
- −$0 /mo · $0/yr
- Insurance
- −$0
- HOA
- −$0
- Vacancy / Maint / Mgmt
- −$410
- Net cashflow
- $1,543
Break-even live
UW: 25.0% down · 7.5% · 30yr · 1.5% tax · 5.0% vac · 8.0% maint · 8.0% mgmt
Financing live
Cash to close
- Down payment
- $0
- Closing costs
- $0
- Reserves months
- —
- Total cash needed
- —
Loan-product check · same deal, 3 products live
Conventional
25% down · 7.5% · 30yr
- Down + closing
- —
- Monthly P&I
- —
- Monthly cashflow
- —
- DSCR
- —
- Eligible?
- —
Personal DTI + credit; lowest rate.
DSCR
20% down · 8.5% · 30yr
- Down + closing
- —
- Monthly P&I
- —
- Monthly cashflow
- —
- DSCR
- —
- Eligible?
- —
No personal income docs; deal must DSCR.
Hard money
10% down · 12.0% · 12mo
- Down + closing
- —
- Monthly P&I
- —
- Monthly cashflow
- —
- DSCR
- —
- Eligible?
- —
Short-term bridge; refi at stabilization.
Rent comps 23 comps
| Address | Beds | Baths | Sqft | Rent | $/sqft | DOM | Units | Dist |
|---|---|---|---|---|---|---|---|---|
| 8001 Kercheval Ave Detroit, MI | 1.0–2.0 | 1.0–2.0 | 984 | $2,270 | $2.31 | 1d | 3 | 0.22mi |
| 1454 Townsend St #101 Detroit, MI | 2.0 | 2.0 | 1268 | $2,500 | $1.97 | 3d | 1 | 0.22mi |
| 7918 E Lafayette St #4 Detroit, MI | 3.0 | 1.0 | 1150 | $1,800 | $1.57 | 17d | 1 | 0.23mi |
| 8100 E Jefferson Ave Detroit, MI | 3.0 | 1.0–3.0 | 1089 | $2,210 | $2.03 | 19d | 20 | 0.43mi |
| 374 E Grand Blvd Unit 2A Detroit, MI | 2.0 | 2.0 | 1450 | $2,750 | $1.90 | 43d | 1 | 0.43mi |
| 7700 E Jefferson Ave Detroit, MI | 2.0 | 1.0 | 877 | $1,795 | $2.05 | 43d | 1 | 0.45mi |
| 8845 E Jefferson Ave Unit 207 Detroit, MI | 2.0 | 1.5 | 1500 | $1,695 | $1.13 | 43d | 1 | 0.55mi |
| 8845 E Jefferson Ave Unit 204 Detroit, MI | 2.0 | 1.5 | 1150 | $2,350 | $2.04 | 43d | 1 | 0.55mi |
| 8845 E Jefferson Ave Unit 206 Detroit, MI | 2.0 | 1.5 | 1230 | $1,660 | $1.35 | 43d | 1 | 0.55mi |
| 1738 Canton St Unit 1 Detroit, MI | 4.0 | 1.0 | 2244 | $1,650 | $0.74 | 43d | 1 | 0.56mi |
| 8925 E Jefferson Ave Detroit, MI | 1.0–2.0 | 1.0–2.0 | 1050 | $1,945 | $1.85 | 43d | 9 | 0.58mi |
| 2972 Field St Detroit, MI | 3.0 | 1.0 | 1225 | $1,395 | $1.14 | 17d | 1 | 0.70mi |
| 6533 E Jefferson Ave Detroit, MI | 2.0 | 1.0–2.0 | 1094 | $1,500 | $1.37 | 17d | 2 | 0.85mi |
| 6533 E Jefferson Ave Detroit, MI | 2.0 | 1.0–2.0 | 1181 | $1,500 | $1.27 | 24d | 3 | 0.85mi |
| 6533 E Jefferson Ave #421 Detroit, MI | 2.0 | 1.0 | 1063 | $2,200 | $2.07 | 15d | 1 | 0.85mi |
| 1440 Robert Bradby Dr Detroit, MI | 2.0 | 2.0 | 1250 | $1,472 | $1.18 | 43d | 1 | 1.00mi |
| 3631 Helen St Unit 3635 Detroit, MI | 4.0 | 2.0 | 2157 | $1,650 | $0.76 | 43d | 1 | 1.05mi |
| 4169 Burns St Detroit, MI | 4.0 | 2.5 | 1326 | $2,300 | $1.73 | 24d | 1 | 1.19mi |
| 3500 E Jefferson Detroit, MI | 1.0–2.0 | 1.0–2.0 | 1012 | $2,560 | $2.53 | 1d | 5 | 1.25mi |
| 1348 Village Dr Detroit, MI | 3.0 | 2.5 | 2100 | $2,295 | $1.09 | 24d | 1 | 1.27mi |
| 8843 E Canfield St Detroit, MI | 4.0 | 2.0 | 1200 | $2,400 | $2.00 | 43d | 1 | 1.35mi |
| 3495 Garland St Detroit, MI | 2.0 | 1.0 | 1100 | $900 | $0.82 | 43d | 1 | 1.35mi |
| 2928 Prince Hall Dr Detroit, MI | 2.0 | 2.0 | 1425 | $2,000 | $1.40 | 5d | 1 | 1.46mi |
Listing history 13 events
-
2026-06-01days on market $1 Active 110 DOM
-
2026-05-31days on market $1 Active 109 DOM
-
2026-02-11$1 Active 1448-char remark
Show marketing remark (1448 chars)
* * * Please Read All The Remarks To Ensure Your Full Understanding of What's Being Offered * * * A rare opportunity to preserve an early West Village worker era home and keep Detroit history in the built environment. This late nineteenth century wood frame dwelling remains clearly historic and features a distinctive corner bay at the front porch. The structure is currently vacant and reflects long term deferred maintenance. City historic staff have identified similar homes in the area as worthy of preservation and relocation where feasible. These offerings are for the historic structures only. No land is included. The structure is being made available at no cost to a qualified recipient who is willing and able to fund all expenses associated with preservation, deconstruction, lifting, loading, transportation, permits, site safety, insurance, and any required restoration of the origin site. The structure is conveyed as is, where is, with all faults, and with no representations or warranties. Interior access, room count, bathroom count, square footage, and all structural conditions are not represented and must be independently verified by the recipient. Brokers and prospective purchasers should not rely on the listing for accurate information. Broker to confirm all data. A waiver must be fully executed before any tours. The 1514 Van Dyke listing is available in conjunction with MLS Listing #: 20261008575 (1532 Van Dyke).
-
2019-11-12soldstatus $175,000
-
2019-01-07historical
-
2018-06-12status Pending
-
2018-06-12status Pending
-
2018-06-11historical
-
2018-05-30price $175,000
-
2018-05-30price $175,000
-
2018-04-26$250,000 Active
-
2018-04-26$250,000 Active
ⓘ Source: listings_history table (triggers on properties + properties_extension) + one-shot
backfill from property_details.listing_events for pre-trigger history.
Climate risk First Street
- Flood 1/10 Low FEMA zone X (unshaded) · 0% chance over 30 yrs
- Wildfire 1/10 Low
- Heat 3/10 Moderate 7 d/yr ≥96°F today · 15 d/yr by 30 yrs out
- Wind 2/10 Low
- Air quality 3/10 Moderate 2 unhealthy d/yr today · 5 by 30 yrs out
Nearby sold comps map
Loading sold comps map…
Walkable amenities ~0.75 mi
Loading nearby amenities…
Taxation est. · year 1
- Rental income
- $23,445
- − Mortgage interest
- −$0
- − Property taxes
- −$0
- − Insurance
- −$0
- − Repairs & maintenance
- −$1,876
- − Management
- −$1,876
- − Depreciation
- −$0
- Taxable income
- $19,694
- Est. tax owed @ 24.0%
- −$4,726
- After-tax cash flow
- $13,795/yr
For passive investors: Depreciation is non-cash, so a rental often shows a tax loss while cash-flowing — sheltering income. Rental losses are passive: they offset passive income freely, and up to $25,000/yr can offset ordinary (W-2) income if you actively participate and your MAGI is under $100k (phasing out to $0 by $150k); unused losses carry forward. On sale, claimed depreciation is recaptured at up to 25%, and gains may owe capital-gains tax (a 1031 exchange can defer both). Figures are a year-1 estimate at your 24.0% rate — not tax advice; consult a CPA.
Condition & rehab AI · 1 photo
This historic home requires extensive repairs and maintenance, including roof and exterior siding work, to become move-in ready.
Repairs flagged
- Major roof — Snow on roof, potential ice dam
- Major exterior siding — Peeling paint
Value-add opportunities
- Both repair and paint exterior siding — Improves curb appeal and value
- Both repair roof — Prevents water damage and enhances value
Renovation cost estimate screening
| Repair item | Severity | Est. cost |
|---|---|---|
| roof · Snow on roof, potential ice dam | Major | $15,000–50,000 |
| exterior siding · Peeling paint | Major | $15,000–50,000 |
| Total estimated repair cost · 2 items | $30,000–100,000 |
Value-add ROI direction
- Both repair and paint exterior siding — Improves curb appeal and value ↑
- Both repair roof — Prevents water damage and enhances value ↑
ⓘ Cost ranges are severity-bucket heuristics (US national rule-of-thumb). Get contractor quotes + a written scope before underwriting a rehab budget.
Schools (NCES district)
- District
- Detroit Public Schools Community District
- NCES district ID
- 2601103
- Math proficiency
- 10% ▼ -2.00%
- Reading proficiency
- 24% ▲ 6.00%
- Median HH income
- $25,815
- Composite
- 13.06/100
- National rank
- #9564
- State rank
- #499 of 540 in MI
Livability — Detroit
- Score
- 73/100
- State rank
- #218
- US rank
- #5427
Category grades
Schools grade is shown separately in the Schools card above.
Census & demographics
- Census place
- Detroit, MI
- County
- Wayne County · 1,562,939 people
- City population
- 572,865
- Metro
- Detroit-Warren-Dearborn, MI
- Population (ZIP)
- 18,595
- Household income
- $33,544
- Rent vs Own
- Severe rent burden
- 1364.0
Population outlook (Wayne County) Hauer SSP2
- Today (2025)
- 1,675,273 people
- By 2030
- 1,620,300 · -3.3%
- By 2040
- 1,502,341 · -10.3%
- By 2050
- 1,384,039 · -17.4%
- By 2075
- 1,124,592 · -32.9%
- By 2100
- 881,193 · -47.4%
Race, ethnicity, and origin ACS 2023
- Neighborhood character
- Predominantly Black (79%)
- Race & ethnicity
- Black 79% White 16% Two or more races 4%
- Common ancestry
- Romanian 1% Iranian 1% Lithuanian 1%
- Foreign-born
- 3% · Canada, Jamaica
- Languages at home
- 98% English-only · Spanish 1%
Political lean MEDSL · Wayne
- 2024 margin
- Strong D (+29.0) · D 62.7% · R 33.7% · Other 3.6%
- 2008→2024 swing
- -20.5pp toward R · 2008: 49.5pp · 2024: 29.0pp
- All cycles
- 2024: D+29.0 2020: D+38.1 2016: D+37.3 2012: D+46.9 2008: D+49.5
Not yet ingested
- Civics
- —
Market trends
- HPI YoY
- ▼ -367.43%
- Current HPI
- 102.0969
- Rent YoY
- —
- Metro
- Detroit-Warren-Dearborn, MI
- State GDP YoY
- ▲ 1.37%
- F500 in state
- 28
Industry mix (Fortune 500 HQ in MI)
| Industry | F500 HQs | Revenue |
|---|---|---|
| Automotive Parts | 3 | $48B |
|
||
| Automotive | 2 | $372B |
|
||
| Chemicals | 1 | $45B |
|
||
| Automotive Retail | 1 | $29B |
|
||
| Healthcare / Medical Devices | 1 | $23B |
|
||
| Automotive Technology | 1 | $20B |
|
||
Price history
-30.0% since first listed11 events — show timeline
- 2026-02-11 Listed $1 REALCOMP
- 2026-02-11 Listed $1 MiRealSource-MiMLS
- 2019-11-12 Sold (Public Records) $175,000 Public Records
- 2019-01-07 Listing Removed — REALCOMP
- 2018-06-12 Pending — MiRealSource-MiMLS
- 2018-06-12 Pending — REALCOMP
- 2018-06-11 Listing Removed — MiRealSource-MiMLS
- 2018-05-30 Price Changed $175,000 MiRealSource-MiMLS
- 2018-05-30 Price Changed $175,000 REALCOMP
- 2018-04-26 Listed $250,000 REALCOMP
- 2018-04-26 Listed $250,000 MiRealSource-MiMLS
Property tax history
+23.1%/yrLatest (2025): $5,229 · -11.1% YoY. Source: county tax records.
Cash-flow waterfall
monthlySold comps — $/sqft
last 12 mo · ≤1 miLoading sold comps…