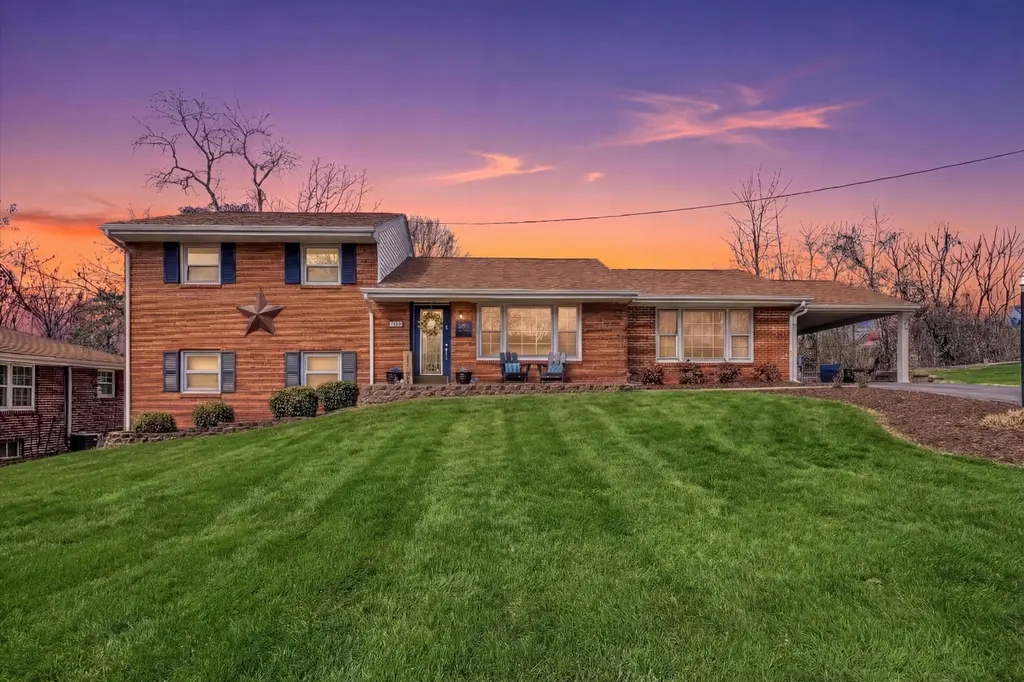
3105 Davis Ave · Cave Spring, VA
Flood risk 1/10 · Minimal
- FEMA flood zone
- X (unshaded)
- Chance of flooding over 30 yrs
- 0.0%
- Est. flood insurance / yr
- $473 – $860
Fire risk 1/10 · Minimal
- Est. fire insurance / yr
- $666 – $1,236
Heat risk 5/10 · Moderate
- Hot days now (above 100°F)
- 7 days/yr
- Hot days in 30 yrs
- 18 days/yr
Wind risk 2/10 · Minimal
- Chance of severe wind over 30 yrs
- 1.0%
Air-quality risk 2/10 · Minimal
- Unhealthy air days now
- 0 days/yr
- Unhealthy air days in 30 yrs
- 1 days/yr
Risk factors via First Street. Map © Google.
Why this score? — see what drove the D- grade
The composite is a weighted blend of 9 inputs, each scored 0–100. Each bar is that input's sub-score; the figure is the points it added to the 100-point composite (weight × sub-score).
- Cash flow +12.8/30.0
- Schools +6.4/10.0
- Rent growth +4.1/5.0
- DSCR +3.8/10.0
- Livability +3.8/5.0
- 1% rule +2.9/10.0
- Condition / age +2.5/5.0
- ARV discount +0.0/15.0
- Appreciation +0.0/10.0
$369,950
🖨 Deal sheet (PDF) 📄 Offer letter ✓ Due diligence
Listing remarks
Welcome to 3105 Davis Ave SW--This home carries a rare sense of warmth you can feel the moment you arrive. Inside, you'll find a beautifully renovated kitchen that blends modern style with everyday comfort, featuring custom cabinetry, a spacious island, and room to gather, cook, and connect. The newly updated laundry room adds convenience, while the thoughtful layout offers four bedrooms, two full baths, and a separate office/workspace--perfect for working from home, creative pursuits, or a quiet place to focus. Outside the wraparound deck and side porch invites morning coffee, weekend entertaining, and quiet evenings under the sky. Schedule your tour today
Key facts
- 8,712 sq ft lot
- Built 1965
- Listed 3 days
Neighborhood map
What this means for you Summary
Snapshot
- This is a 4-bed/2.0-bath single-family listed at $370k.
Deal economics
- At list price, monthly cash flow is $-35 ($-426/yr) — negative.
- To cash-flow at today's rent, offer at most $364k (1.7% below list).
- To meet the 1% rule (rent ≥ 1% of price), the offer needs to be $292k (21.0% below list).
- Recommended offer: $292k (21.0% below list) — sets the bar for 1% rule.
- Cap rate 6.2% vs local median 3.4% in Cave Spring — top-decile yield for the area; either an underpriced asset or a hidden risk that comps aren't pricing in. Stress-test before assuming the spread holds.
Location & tenants
- Location reads 76/100 on livability (#113 in VA, #3,513 nationally) — a middle-class / working-renter tenant base. Strengths: housing A+, health & safety A+, cost of living A-; Watch: amenities F, commute F.
- Roanoke County Public School District (suburban): math 71% / reading 78% proficiency, ranked #9 of 131 in VA (top 7%) — strong family-tenant draw, lease renewals of 3-5y typical.
- Zoned schools: Green Valley Elementary (math 63% / reading 75%, grade A-, #351 of 1,108 statewide, top 32%, 518 students, 43% FRL); Hidden Valley Middle (math 76% / reading 83%, grade A+, #28 of 342 statewide, top 8%, 578 students, 26% FRL); Hidden Valley High (math 90% / reading 92%, grade A+, #5 of 319 statewide, top 1%, 830 students, 24% FRL).
- Market conditions: Rents rising fast (+6.4%/yr); 121 active listings in the ZIP; 10 comparable units currently listed for rent nearby; rentals at typical pace (median 23d on market — plan ~3-4 weeks tenant-placement turnaround); 40% of comp listings sitting > 30 days — soft ceiling on asking rent; 360 units permitted in Roanoke County in 2024 (228 in 5+ unit buildings).
- At $2,922/mo this rent would consume 50% of the median local household income ($70k/yr) (locally 525% of renters already pay >50% of income on rent) — very limited rent-growth headroom before tenants either downsize or default.
Forward outlook
- Local home prices are declining (-3.0%/yr); year-one equity from $3k of loan paydown is wiped out by about $11k of value loss. Plan a longer hold.
- Roanoke County population projected at +5% by 2050 — modest demand growth; plan on rents tracking national, not racing it.
Negotiation context
- Only 3 days on market — expect competitive offers; lowballing is unlikely to land.
- Current owner paid $200k; list at $370k implies a 85% gain — meaningful room to come down on a strong offer.
Risks & watch-outs
- Climate carrying-cost: extreme-heat days projected 7→18/yr by 2055 (HVAC capex compounding) — expect insurance premiums to compound above CPI over the hold.
Questions for the listing agent
- What do current leases actually rent for vs. the listed asking? Can we see a recent rent roll and the last 12 months of T-12 income?
- Built in 1965 — when were the roof, HVAC, electrical panel, plumbing, and water heater last replaced?
- Is there a deadline driving the sale (1031 exchange, divorce, estate, relocation)? That informs how much negotiation room exists.
- Schools are A-rated — typically a magnet for longer-tenancy family renters. What's the average tenant stay here, and is there a school-zone premium baked into asking?
- The area grade is low — what's the realistic commute time and amenity access for the typical tenant pool here? Any planned neighborhood developments (good or bad) we should know about?
- What's the average days-on-market for RENTAL listings here right now (not sales)? A rising rental-DOM trend means longer vacancies and softer asking-rent achievability than the comps imply.
- What's the recent tenant-quality profile in this submarket — average credit score on applications, eviction rate, late-payment / NSF rate, and stable-employment percentage? A property-management company in the area should have these aggregated.
- How much new for-sale + rental construction is in the pipeline within 1–3 miles? Heavy new supply typically softens prices + rents 12–24 months out; constrained supply supports both.
Investment metrics
- 1% rule
- 0.79% ✗
- Cap rate
- 6.18%
- Cash-on-cash
- -0.41%
- DSCR
- 0.98
- GRM
- 10.5
CMA / ARV
- ARV (on-the-fly)
- $307,675
- Comps found
- 12
Show comp detail 12 sales within ~0.75 mi
| Address | Dist | Beds/Ba | Sqft | Sold | Price | $/sf | Match |
|---|---|---|---|---|---|---|---|
| 3105 Davis Ave | 0.00mi | 4/2.0 | 2,185 (+10%) | 1mo | $386,000 | $177 | 82 |
| 3001 Timberlane Ave | 0.30mi | 4/3.0 | 2,006 (+1%) | 1mo | $325,000 | $162 | 80 |
| 2616 Hollowdale Dr | 0.38mi | 3/2.0 (-1) | 2,084 (+5%) | 3mo | $395,000 | $190 | 66 |
| 2716 Deerfield Rd SW | 0.46mi | 3/2.0 (-1) | 2,069 (+4%) | 1mo | $329,950 | $159 | 66 |
| 3406 Poplar Dr | 0.56mi | 4/1.0 | 1,931 (-3%) | 2mo | $299,950 | $155 | 63 |
| 3231 Fleetwood Ave | 0.13mi | 3/1.0 (-1) | 2,255 (+14%) | 2mo | $286,000 | $127 | 61 |
| 3561 Forester Rd SW | 0.34mi | 4/3.0 | 2,194 (+10%) | 4mo | $292,000 | $133 | 59 |
| 2508 Alberta Ave SW | 0.69mi | 3/1.5 (-1) | 1,995 (+0%) | 1mo | $309,250 | $155 | 59 |
| 3038 Dover Dr SW | 0.70mi | 3/2.5 (-1) | 1,981 (-0%) | 2mo | $300,000 | $151 | 58 |
| 2529 Oregon Ave SW | 0.64mi | 4/1.5 | 1,874 (-6%) | 2mo | $361,950 | $193 | 58 |
| 2519 Winifred Dr SW | 0.64mi | 3/2.0 (-1) | 2,208 (+11%) | 3mo | $150,000 | $68 | 44 |
| 2522 Livingston Rd SW | 0.59mi | 3/1.5 (-1) | 2,240 (+13%) | 1mo | $280,000 | $125 | 43 |
Match score weights: distance 35% · size 25% · config 20% · recency 20%. Top-matched comps best support the ARV.
Projected returns pro-forma
-3.0% appreciation · 6.39% rent growth · sell at horizon
- IRR
- -13.6%
- Equity multiple
- 0.50×
- Total profit
- $-51,986
- Equity at exit
- $55,161
- IRR
- -0.4%
- Equity multiple
- 0.97×
- Total profit
- $-3,177
- Equity at exit
- $31,987
Cash invested: $103,586 (down + closing). Projections, not guarantees.
Landlord ↔ Tenant lean methodology
- Overall (STATE)
- 55 Moderately Landlord-Leaning
- State Virginia
- 55 Moderately Landlord-Leaning · D+2
- County
- — inherits STATE
- City
- — inherits STATE
ZIP-level market 24015
- Rents YoY
- 6.4%
- Active inventory
- 121
- Price-to-rent
- 10.5×
Monthly cashflow live
- Estimated rent
- $2,922 high interval (Pro) →
- Mortgage (P&I)
- −$1,940
- Tax from tax record
- −$250 /mo · $3,000/yr
- Insurance
- −$154
- HOA
- −$0
- Vacancy / Maint / Mgmt
- −$614
- Net cashflow
- $-35
Break-even live
Sensitivity live
| Price | -10% $174 | -5% $69 | +0% $-35 | +5% $-140 | +10% $-245 |
|---|---|---|---|---|---|
| Rent | -10% $-266 | -5% $-151 | +0% $-35 | +5% $80 | +10% $195 |
| Rate | -1.0pp $151 | -0.5pp $59 | base $-35 | +0.5pp $-131 | +1.0pp $-229 |
UW: 25.0% down · 7.5% · 30yr · 1.5% tax · 5.0% vac · 8.0% maint · 8.0% mgmt
Financing live
Cash to close
- Down payment
- $92,488
- Closing costs
- $11,098
- Reserves months
- —
- Total cash needed
- —
Loan-product check · same deal, 3 products live
Conventional
25% down · 7.5% · 30yr
- Down + closing
- —
- Monthly P&I
- —
- Monthly cashflow
- —
- DSCR
- —
- Eligible?
- —
Personal DTI + credit; lowest rate.
DSCR
20% down · 8.5% · 30yr
- Down + closing
- —
- Monthly P&I
- —
- Monthly cashflow
- —
- DSCR
- —
- Eligible?
- —
No personal income docs; deal must DSCR.
Hard money
10% down · 12.0% · 12mo
- Down + closing
- —
- Monthly P&I
- —
- Monthly cashflow
- —
- DSCR
- —
- Eligible?
- —
Short-term bridge; refi at stabilization.
Rent comps 10 comps
| Address | Beds | Baths | Sqft | Rent | $/sqft | DOM | Units | Dist |
|---|---|---|---|---|---|---|---|---|
| 2917 Evergreen Ln SW Roanoke, VA | 4.0 | 3.5 | 2240 | $3,195 | $1.43 | 23d | 1 | 0.12mi |
| 2911 Evergreen Ln SW Roanoke, VA | 4.0 | 3.5 | 2240 | $3,195 | $1.43 | 23d | 1 | 0.12mi |
| 2923 Evergreen Ln SW Roanoke, VA | 4.0 | 3.5 | 2240 | $3,195 | $1.43 | 23d | 1 | 0.12mi |
| 3427 Evergreen Ln SW Roanoke, VA | 4.0 | 3.5 | 2240 | $3,195 | $1.43 | 45d | 1 | 0.15mi |
| 3423 Evergreen Ln SW Roanoke, VA | 4.0 | 3.5 | 2240 | $3,195 | $1.43 | 45d | 1 | 0.16mi |
| 3419 Evergreen Ln SW Roanoke, VA | 4.0 | 3.5 | 2240 | $3,195 | $1.43 | 45d | 1 | 0.18mi |
| 3711 Crescent Ridge Dr SW Roanoke, VA | 4.0 | 2.5 | 2232 | $2,899 | $1.30 | 23d | 1 | 0.43mi |
| 3602 Colonial Green Cir SW Roanoke, VA | 3.0 | 2.5 | 1670 | $2,622 | $1.57 | 15d | 1 | 0.45mi |
| 3345 Circle Brook Dr Cave Spring, VA | 1.0–3.0 | 1.0–2.0 | 997 | $1,920 | $1.92 | 15d | 11 | 0.91mi |
| 1668 Brandon Ave SW Roanoke, VA | 3.0 | 1.0 | 1552 | $1,849 | $1.19 | 45d | 1 | 1.34mi |
Listing history 4 events
-
2026-03-23status Pending
-
2026-03-20$369,950 Active
-
2026-03-13historical $369,950
-
2021-05-14soldstatus $200,000
ⓘ Source: listings_history table (triggers on properties + properties_extension) + one-shot
backfill from property_details.listing_events for pre-trigger history.
Tax reassessment forecast VA · Resets to sale price
- Current annual tax
- $3,000 · $250/mo
- Projected year-2 tax
- $3,034 · $253/mo
- Expected delta
- +$33/yr (+$3/mo · 1.1%)
ⓘ Screening estimate from a state-policy table — verify with the county assessor before closing.
Climate risk First Street
- Flood 1/10 Low FEMA zone X (unshaded) · 0% chance over 30 yrs
- Wildfire 1/10 Low
- Heat 5/10 Major 7 d/yr ≥100°F today · 18 d/yr by 30 yrs out
- Wind 2/10 Low 100% chance of damaging wind over 30 yrs
- Air quality 2/10 Low 0 unhealthy d/yr today · 1 by 30 yrs out
Nearby sold comps map
Loading sold comps map…
Walkable amenities ~0.75 mi
Loading nearby amenities…
Taxation est. · year 1
- Rental income
- $35,070
- − Mortgage interest
- −$20,723
- − Property taxes
- −$3,000
- − Insurance
- −$1,850
- − Repairs & maintenance
- −$2,806
- − Management
- −$2,806
- − Depreciation
- −$10,762
- Taxable loss
- −$6,876
- Est. tax savings @ 24.0%
- +$1,650
- After-tax cash flow
- $1,225/yr
For passive investors: Depreciation is non-cash, so a rental often shows a tax loss while cash-flowing — sheltering income. Rental losses are passive: they offset passive income freely, and up to $25,000/yr can offset ordinary (W-2) income if you actively participate and your MAGI is under $100k (phasing out to $0 by $150k); unused losses carry forward. On sale, claimed depreciation is recaptured at up to 25%, and gains may owe capital-gains tax (a 1031 exchange can defer both). Figures are a year-1 estimate at your 24.0% rate — not tax advice; consult a CPA.
Schools (NCES district)
- District
- Roanoke County Public School District
- NCES district ID
- 5103330
- Math proficiency
- 71% ▼ -19.00%
- Reading proficiency
- 78% ▼ -6.00%
- Median HH income
- $60,526
- Composite
- 64.08/100
- National rank
- #578
- State rank
- #9 of 131 in VA
Livability — Cave Spring
- Score
- 76/100
- State rank
- #113
- US rank
- #3513
Category grades
Schools grade is shown separately in the Schools card above.
Census & demographics
- Census place
- Cave Spring, VA
- County
- Roanoke City · 101,625 people
- Metro
- Roanoke, VA
- Population (ZIP)
- 15,865
- Household income
- $69,831
- Rent vs Own
- Severe rent burden
- 525.0
Population outlook (Roanoke County) Hauer SSP2
- Today (2025)
- 98,162 people
- By 2030
- 99,793 · +1.7%
- By 2040
- 101,965 · +3.9%
- By 2050
- 103,328 · +5.3%
- By 2075
- 108,641 · +10.7%
- By 2100
- 104,845 · +6.8%
Race, ethnicity, and origin ACS 2023
- Neighborhood character
- Predominantly White (83%)
- Race & ethnicity
- White 83% Two or more races 7% Black 5% Hispanic / Latino 5% Asian 2%
- Common ancestry
- Italian 5% Slovak 3% Serbian 2%
- Foreign-born
- 4% · Canada, Jamaica
- Languages at home
- 95% English-only · Spanish 2% Tagalog/Filipino 1% Other Indo-European 1%
Political lean MEDSL · Roanoke
- 2024 margin
- Strong R (+22.5) · D 38.2% · R 60.7% · Other 1.1%
- 2008→2024 swing
- -1.4pp toward R · 2008: -21.1pp · 2024: -22.5pp
- All cycles
- 2024: R+22.5 2020: R+21.8 2016: R+28.1 2012: R+25.6 2008: R+21.1
Not yet ingested
- Civics
- —
Market trends
- HPI YoY
- ▼ -333.83%
- Current HPI
- 192.3108
- Rent YoY
- ▲ 6.39%
- Metro
- Roanoke, VA
- State GDP YoY
- ▲ 2.40%
- F500 in state
- 50
Industry mix (Fortune 500 HQ in VA)
| Industry | F500 HQs | Revenue |
|---|---|---|
| Aerospace / Defense | 4 | $236B |
|
||
| Technology / Defense | 3 | $32B |
|
||
| Financial Services | 2 | $176B |
|
||
| Utilities | 2 | $27B |
|
||
| Insurance | 2 | $25B |
|
||
| Technology | 2 | $15B |
|
||
Price history
+85.0% since first listed4 events — show timeline
- 2026-03-23 Pending — MLSRV
- 2026-03-20 Listed $369,950 MLSRV
- 2026-03-13 Coming Soon $369,950 MLSRV
- 2021-05-14 Sold (Public Records) $200,000 Public Records
Property tax history
+4.4%/yrLatest (2025): $3,000 · +6.8% YoY. Source: county tax records.
Cash-flow waterfall
monthlySold comps — $/sqft
last 12 mo · ≤1 miLoading sold comps…