214 Cunningham St · Sadieville, KY
Flood risk 1/10 · Minimal
- FEMA flood zone
- X (unshaded)
- Chance of flooding over 30 yrs
- 0.0%
- Est. flood insurance / yr
- $473 – $860
Fire risk 3/10 · Minor
- Est. fire insurance / yr
- $839 – $1,559
Heat risk 4/10 · Minor
- Hot days now (above 102°F)
- 7 days/yr
- Hot days in 30 yrs
- 19 days/yr
Wind risk 2/10 · Minimal
- Chance of severe wind over 30 yrs
- 1.0%
Air-quality risk 2/10 · Minimal
- Unhealthy air days now
- 1 days/yr
- Unhealthy air days in 30 yrs
- 2 days/yr
Risk factors via First Street. Map © Google.
Why this score? — see what drove the B grade
The composite is a weighted blend of 9 inputs, each scored 0–100. Each bar is that input's sub-score; the figure is the points it added to the 100-point composite (weight × sub-score).
- Cash flow +30.0/30.0
- ARV discount +12.3/15.0
- DSCR +10.0/10.0
- 1% rule +9.7/10.0
- Schools +3.4/10.0
- Livability +3.2/5.0
- Rent growth +2.5/5.0
- Condition / age +2.5/5.0
- Appreciation +0.0/10.0
$190,000
🖨 Deal sheet (PDF) 📄 Offer letter ✓ Due diligence
Listing remarks MLS
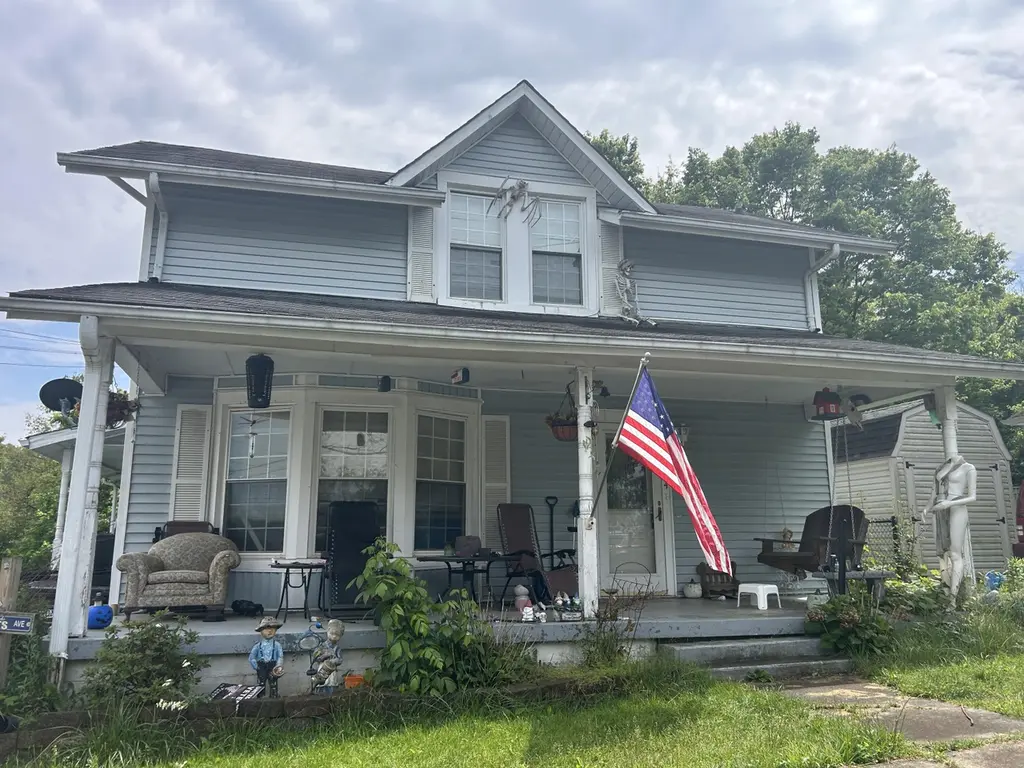
Farmhouse Charm! This Adorable Home Located in Sadieville features Beautiful Hardwood Floors, Updated Bathroom, Spacious 1st Floor Bedroom, Fenced Yard & Storage Shed. Don't wait to see this one!
Key facts
- Extra storage
- Room for pets
- 8,276 sq ft lot
Tags
Property features AI
Exterior
- Parking: Driveway
- Utilities: Public water; Public sewer; Electricity connected; Sewer connected; Water connected
- Home design: Two-level house
- Construction: Vinyl siding; Block foundation; Composition/shingle roof; Built as a house
- Exterior features: Chain link fence; Shed(s)
Interior
- Bedrooms: Total rooms: 8
- Flooring: Hardwood; Vinyl; Parquet
- Bathrooms: 1 full bathroom; 1 half bathroom
- Heating & cooling: Heat pump for heating and cooling
- Interior features: Fireplace; Hardwood, vinyl, and parquet flooring
- Laundry & utility: Washer hookup (lower level); Electric dryer hookup
Neighborhood map
What this means for you Summary
Snapshot
- This is a 3-bed/1.5-bath other listed at $190k.
Deal economics
- At list price, monthly cash flow is $1k ($12k/yr) — positive.
- The deal already cash-flows at list — no discount required.
- Meets the 1% rule at list price ($3k rent vs $190k).
- Recommended offer: $184k (3.0% below list) — sets the bar for market timing.
- Cap rate 12.6% vs local median 2.4% in Sadieville — top-decile yield for the area; either an underpriced asset or a hidden risk that comps aren't pricing in. Stress-test before assuming the spread holds.
Location & tenants
- Location reads 65/100 on livability (#272 in KY) — a middle-class / working-renter tenant base. Strengths: crime A+, cost of living A+, housing A+; Watch: amenities F, commute F, health & safety F.
- Scott County (town): math 32% / reading 44% proficiency, ranked #31 of 165 in KY (top 19%) — families likely to look elsewhere, expect single-tenant / working-renter base with shorter leases.
- Zoned schools: Northern Elementary School (math 43% / reading 48%, grade D-, #142 of 676 statewide, top 21%, 454 students, 34% FRL); Royal Spring Middle School (math 34% / reading 54%, grade D, #40 of 217 statewide, top 19%, 726 students, 44% FRL); Scott County High School (math 34% / reading 37%, grade F, #73 of 254 statewide, top 28%, 1,197 students, 40% FRL) — zoned schools at 39% FRL track the district average.
- Market conditions: 24 active listings in the ZIP; 546 units permitted in Scott County in 2024 (98 in 5+ unit buildings).
Forward outlook
- Local home prices are declining (-3.0%/yr); year-one equity from $1k of loan paydown is wiped out by about $6k of value loss. Plan a longer hold.
- Scott County population projected at +45% by 2050 — long-run rental-demand tailwind backs the buy-and-hold thesis.
- At projected returns (-3.0% appreciation + 3.0% rent growth), your $53k cash investment doubles in ~6 years — after that, you're playing with house money.
Negotiation context
- It's been on market 43 days — a 3% lower offer ($184k) is reasonable based on typical stale-listing flexibility.
- 2 sale attempts since 5y ago; this cycle's ask has dropped $25k (12%) from the opening price — seller is motivated, your offer sets the floor, not the list.
- Current owner paid $160k; 19% above their basis — modest negotiation headroom, anchor on the comps not their cost.
Questions for the listing agent
- It's been on market 43 days. Have you received any prior offers? Is the seller open to a 3% concession, seller financing, or rate buy-down credit?
- Is there a deadline driving the sale (1031 exchange, divorce, estate, relocation)? That informs how much negotiation room exists.
- Schools are F-rated, which usually means shorter tenancies and higher turnover. Who's the typical renter profile here, and what's been the actual vacancy rate?
- What's the average days-on-market for RENTAL listings here right now (not sales)? A rising rental-DOM trend means longer vacancies and softer asking-rent achievability than the comps imply.
- What's the recent tenant-quality profile in this submarket — average credit score on applications, eviction rate, late-payment / NSF rate, and stable-employment percentage? A property-management company in the area should have these aggregated.
- How much new for-sale + rental construction is in the pipeline within 1–3 miles? Heavy new supply typically softens prices + rents 12–24 months out; constrained supply supports both.
Investment metrics
- 1% rule
- 1.47% ✓
- Cap rate
- 12.62%
- Cash-on-cash
- 22.59%
- DSCR
- 2.01
- GRM
- 5.7
CMA / ARV
- ARV (median comp)
- $212,702
- List price
- $190,000
- Delta
- -10.67%
- Verdict
- UNDERPRICED
- Comps
- 16 within 1.0 mi
Projected returns pro-forma
-3.0% appreciation · 3.0% rent growth · sell at horizon
- IRR
- 15.4%
- Equity multiple
- 1.62×
- Total profit
- $32,991
- Equity at exit
- $28,330
- IRR
- 24.1%
- Equity multiple
- 3.08×
- Total profit
- $110,797
- Equity at exit
- $16,428
Cash invested: $53,200 (down + closing). Projections, not guarantees.
Landlord ↔ Tenant lean methodology
- Overall (STATE)
- 83 Strongly Landlord-Friendly
- State Kentucky
- 83 Strongly Landlord-Friendly · R+16
- County
- — inherits STATE
- City
- — inherits STATE
ZIP-level market 40370
- Home prices YoY
- -17.4%
- Active inventory
- 24
- Price-to-rent
- 5.7×
Monthly cashflow live
- Estimated rent
- $2,801 medium interval (Pro) →
- Mortgage (P&I)
- −$996
- Tax from tax record
- −$136 /mo · $1,630/yr
- Insurance
- −$79
- HOA
- −$0
- Vacancy / Maint / Mgmt
- −$588
- Net cashflow
- $1,002
Break-even live
Sensitivity live
| Price | -10% $1,109 | -5% $1,055 | +0% $1,002 | +5% $948 | +10% $894 |
|---|---|---|---|---|---|
| Rent | -10% $780 | -5% $891 | +0% $1,002 | +5% $1,112 | +10% $1,223 |
| Rate | -1.0pp $1,097 | -0.5pp $1,050 | base $1,002 | +0.5pp $952 | +1.0pp $902 |
UW: 25.0% down · 7.5% · 30yr · 1.5% tax · 5.0% vac · 8.0% maint · 8.0% mgmt
Financing live
Cash to close
- Down payment
- $47,500
- Closing costs
- $5,700
- Reserves months
- —
- Total cash needed
- —
Loan-product check · same deal, 3 products live
Conventional
25% down · 7.5% · 30yr
- Down + closing
- —
- Monthly P&I
- —
- Monthly cashflow
- —
- DSCR
- —
- Eligible?
- —
Personal DTI + credit; lowest rate.
DSCR
20% down · 8.5% · 30yr
- Down + closing
- —
- Monthly P&I
- —
- Monthly cashflow
- —
- DSCR
- —
- Eligible?
- —
No personal income docs; deal must DSCR.
Hard money
10% down · 12.0% · 12mo
- Down + closing
- —
- Monthly P&I
- —
- Monthly cashflow
- —
- DSCR
- —
- Eligible?
- —
Short-term bridge; refi at stabilization.
Listing history 22 events
-
2026-06-18days on market $190,000 Active 43 DOM
-
2026-06-17days on market $190,000 Active 42 DOM
-
2026-06-16days on market $190,000 Active 41 DOM
-
2026-06-15days on market $190,000 Active 40 DOM
-
2026-06-14days on market $190,000 Active 38 DOM
-
2026-06-10days on market $190,000 Active 35 DOM
-
2026-06-09days on market $190,000 Active 34 DOM
-
2026-06-08days on market $190,000 Active 33 DOM
-
2026-06-07days on market $190,000 Active 32 DOM
-
2026-06-05pricedays on market $190,000 Active 29 DOM
-
2026-06-03days on market $209,625 Active 28 DOM
-
2026-06-02days on market $209,625 Active 27 DOM
-
2026-06-01days on market $209,625 Active 26 DOM
-
2026-05-31days on market $209,625 Active 25 DOM
-
2026-05-31days on market $209,625 Active 24 DOM
-
2026-05-06$215,000 Active 585-char remark
-
2021-05-12soldstatus $159,900
-
2021-05-06soldstatus $159,900 Closed 199-char remark
Show marketing remark (199 chars)
Farmhouse Charm! This Adorable Home Located in Sadieville features Beautiful Hardwood Floors, Updated Bathroom, Spacious 1st Floor Bedroom, Fenced Yard & Storage Shed. Don't wait to see this one!
-
2021-04-30status Pending 199-char remark
Show marketing remark (199 chars)
Farmhouse Charm! This Adorable Home Located in Sadieville features Beautiful Hardwood Floors, Updated Bathroom, Spacious 1st Floor Bedroom, Fenced Yard & Storage Shed. Don't wait to see this one!
-
2021-03-31status Pending 199-char remark
Show marketing remark (199 chars)
Farmhouse Charm! This Adorable Home Located in Sadieville features Beautiful Hardwood Floors, Updated Bathroom, Spacious 1st Floor Bedroom, Fenced Yard & Storage Shed. Don't wait to see this one!
-
2021-03-27$159,900 Active 199-char remark
Show marketing remark (199 chars)
Farmhouse Charm! This Adorable Home Located in Sadieville features Beautiful Hardwood Floors, Updated Bathroom, Spacious 1st Floor Bedroom, Fenced Yard & Storage Shed. Don't wait to see this one!
-
2018-07-12soldstatus $80,000
ⓘ Source: listings_history table (triggers on properties + properties_extension) + one-shot
backfill from property_details.listing_events for pre-trigger history.
Tax reassessment forecast KY · Resets to sale price
- Current annual tax
- $1,630 · $136/mo
- Projected year-2 tax
- $1,634 · $136/mo
- Expected delta
- +$4/yr ($0/mo · 0.3%)
ⓘ Screening estimate from a state-policy table — verify with the county assessor before closing.
Climate risk First Street
- Flood 1/10 Low FEMA zone X (unshaded) · 0% chance over 30 yrs
- Wildfire 3/10 Moderate
- Heat 4/10 Moderate 7 d/yr ≥102°F today · 19 d/yr by 30 yrs out
- Wind 2/10 Low 100% chance of damaging wind over 30 yrs
- Air quality 2/10 Low 1 unhealthy d/yr today · 2 by 30 yrs out
Nearby sold comps map
Loading sold comps map…
Walkable amenities ~0.75 mi
Loading nearby amenities…
Taxation est. · year 1
- Rental income
- $33,616
- − Mortgage interest
- −$10,643
- − Property taxes
- −$1,630
- − Insurance
- −$950
- − Repairs & maintenance
- −$2,689
- − Management
- −$2,689
- − Depreciation
- −$5,527
- Taxable income
- $9,488
- Est. tax owed @ 24.0%
- −$2,277
- After-tax cash flow
- $9,743/yr
For passive investors: Depreciation is non-cash, so a rental often shows a tax loss while cash-flowing — sheltering income. Rental losses are passive: they offset passive income freely, and up to $25,000/yr can offset ordinary (W-2) income if you actively participate and your MAGI is under $100k (phasing out to $0 by $150k); unused losses carry forward. On sale, claimed depreciation is recaptured at up to 25%, and gains may owe capital-gains tax (a 1031 exchange can defer both). Figures are a year-1 estimate at your 24.0% rate — not tax advice; consult a CPA.
Schools (NCES district)
- District
- Scott County
- NCES district ID
- 2105260
- Math proficiency
- 32% ▼ -14.00%
- Reading proficiency
- 44% ▼ -16.00%
- Median HH income
- $61,324
- Composite
- 33.87/100
- National rank
- #5348
- State rank
- #31 of 165 in KY
Livability — Sadieville
- Score
- 65/100
- State rank
- #272
- US rank
- #13230
Category grades
Schools grade is shown separately in the Schools card above.
Census & demographics
- Census place
- Sadieville, KY
- City population
- 2,662
- Population (ZIP)
- 2,662
Population outlook (Scott County) Hauer SSP2
- Today (2025)
- 63,814 people
- By 2030
- 69,637 · +9.1%
- By 2040
- 81,315 · +27.4%
- By 2050
- 92,677 · +45.2%
- By 2075
- 118,956 · +86.4%
- By 2100
- 136,792 · +114.4%
Race, ethnicity, and origin ACS 2023
- Neighborhood character
- Predominantly White (97%)
- Race & ethnicity
- White 97% Two or more races 2% Hispanic / Latino 2%
- Common ancestry
- Slovak 3% Italian 3% Lithuanian 2%
- Foreign-born
- 0%
Political lean MEDSL · Scott
- 2024 margin
- Strong R (+27.7) · D 35.3% · R 63.0% · Other 1.7%
- 2008→2024 swing
- -7.1pp toward R · 2008: -20.6pp · 2024: -27.7pp
- All cycles
- 2024: R+27.7 2020: R+24.9 2016: R+30.4 2012: R+25.0 2008: R+20.6
Not yet ingested
- Civics
- —
Market trends
- HPI YoY
- ▼ -38.03%
- Current HPI
- 180.1927
- Rent YoY
- —
- Metro
- —
- State GDP YoY
- ▲ 1.81%
- F500 in state
- 4
Industry mix (Fortune 500 HQ in KY)
| Industry | F500 HQs | Revenue |
|---|---|---|
| Healthcare | 1 | $118B |
|
||
| Food / Beverage | 1 | $7B |
|
||
Price history
+137.5% since first listed9 events — show timeline
- 2026-06-03 Price Changed $190,000 ImagineMLS
- 2026-05-23 Price Changed $209,625 ImagineMLS
- 2026-05-06 Listed $215,000 ImagineMLS
- 2021-05-12 Sold (Public Records) $159,900 Public Records
- 2021-05-06 Sold (MLS) $159,900 ImagineMLS
- 2021-04-30 Pending — ImagineMLS
- 2021-03-31 Pending — ImagineMLS
- 2021-03-27 Listed $159,900 ImagineMLS
- 2018-07-12 Sold (Public Records) $80,000 Public Records
Property tax history
+10.2%/yrLatest (2025): $1,630 · +0.0% YoY. Source: county tax records.
Cash-flow waterfall
monthlySold comps — $/sqft
last 12 mo · ≤1 miLoading sold comps…