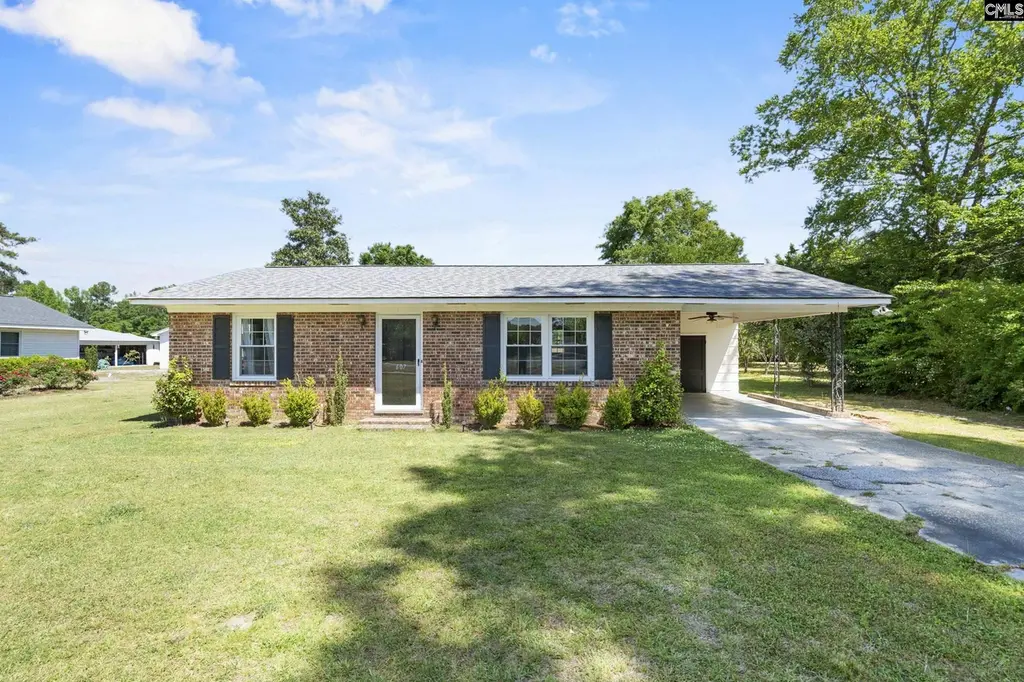
607 E Hampton · Olanta, SC
Flood risk 1/10 · Minimal
- FEMA flood zone
- X (unshaded)
- Chance of flooding over 30 yrs
- 0.0%
- Est. flood insurance / yr
- $507 – $1,088
Fire risk 6/10 · Moderate
- Est. fire insurance / yr
- $783 – $1,453
Heat risk 7/10 · Major
- Hot days now (above 109°F)
- 7 days/yr
- Hot days in 30 yrs
- 15 days/yr
Wind risk 8/10 · Major
- Chance of severe wind over 30 yrs
- 80.0%
Air-quality risk 2/10 · Minimal
- Unhealthy air days now
- 2 days/yr
- Unhealthy air days in 30 yrs
- 2 days/yr
Risk factors via First Street. Map © Google.
Why this score? — see what drove the C- grade
The composite is a weighted blend of 9 inputs, each scored 0–100. Each bar is that input's sub-score; the figure is the points it added to the 100-point composite (weight × sub-score).
- Cash flow +18.6/30.0
- ARV discount +7.5/15.0
- DSCR +5.8/10.0
- Appreciation +5.7/10.0
- 1% rule +3.8/10.0
- Livability +3.5/5.0
- Rent growth +2.5/5.0
- Condition / age +2.5/5.0
- Schools +1.8/10.0
$99,500
🖨 Deal sheet (PDF) 📄 Offer letter ✓ Due diligence
Listing remarks
Charming opportunity in the heart of Olanta! Located at 607 E Hampton St, this home offers small-town living with plenty of potential. Whether you’re looking for a starter home, investment property, or a place to make your own, you’ll appreciate the convenient location and cozy feel. Don’t miss your chance to own a piece of Olanta! Disclaimer: CMLS has not reviewed and, therefore, does not endorse vendors who may appear in listings.
Key facts
- 0.48 acre lot
- Built 1969
- Listed 21 days
Property features AI
Exterior
- Parking: Attached carport
- Utilities: Public water; Public sewer
- Home design: Single-story home
- Construction: Brick exterior above foundation; Slab foundation
- Exterior features: Shed on property; Paved road access
Interior
- Kitchen: Eat-in kitchen; Formica countertops; Painted cabinets; Luxury vinyl plank flooring; Free-standing range
- Bedrooms: Master bedroom on main level with private closet and luxury vinyl plank flooring; Second bedroom on main level with private closet and luxury vinyl plank flooring
- Flooring: Luxury vinyl plank flooring in bedrooms, living areas, and kitchen
- Bathrooms: One full bathroom
- Heating & cooling: Window air conditioning units; Heating: Other (see remarks)
- Interior features: Ceiling fans throughout; Attic access; Free-standing range; Electric water heater
- Laundry & utility: Electric laundry hookups on main level
Neighborhood map
What this means for you Summary
Snapshot
- This is a 2-bed/1.0-bath single-family listed at $100k.
Deal economics
- At list price, monthly cash flow is $96 ($1k/yr) — positive.
- The deal already cash-flows at list — no discount required.
- To meet the 1% rule (rent ≥ 1% of price), the offer needs to be $87k (12.3% below list).
- Recommended offer: $87k (12.3% below list) — sets the bar for 1% rule.
Location & tenants
- Location reads 69/100 on livability (#68 in SC) — a middle-class / working-renter tenant base. Strengths: crime A+, cost of living A+, housing A+; Watch: employment D, schools F, amenities F.
- Florence 03 (town): math 16% / reading 27% proficiency, ranked #67 of 80 in SC (top 84%) — low school quality limits family demand, transient renter base, plan for 1-2y turnover; 83% free/reduced lunch — lower-income household profile, screen leases tightly.
- Market conditions: 8 active listings in the ZIP; 657 units permitted in Florence County in 2024 (40 in 5+ unit buildings).
Forward outlook
- In year one you build about $2k of equity ($688 loan paydown + $1k appreciation (1.5% local appreciation)).
- At projected returns (1.5% appreciation + 3.0% rent growth), your $28k cash investment doubles in ~7 years — after that, you're playing with house money.
Negotiation context
- It's been on market 21 days — a 2% lower offer ($98k) is reasonable based on typical stale-listing flexibility.
Risks & watch-outs
- Climate carrying-cost: severe wind risk, 80% chance of damaging wind over 30y; major wildfire risk; extreme-heat days projected 7→15/yr by 2055 (HVAC capex compounding) — expect insurance premiums to compound above CPI over the hold.
Questions for the listing agent
- Built in 1969 — when were the roof, HVAC, electrical panel, plumbing, and water heater last replaced?
- Is there a deadline driving the sale (1031 exchange, divorce, estate, relocation)? That informs how much negotiation room exists.
- Schools are F-rated, which usually means shorter tenancies and higher turnover. Who's the typical renter profile here, and what's been the actual vacancy rate?
- What's the average days-on-market for RENTAL listings here right now (not sales)? A rising rental-DOM trend means longer vacancies and softer asking-rent achievability than the comps imply.
- What's the recent tenant-quality profile in this submarket — average credit score on applications, eviction rate, late-payment / NSF rate, and stable-employment percentage? A property-management company in the area should have these aggregated.
- How much new for-sale + rental construction is in the pipeline within 1–3 miles? Heavy new supply typically softens prices + rents 12–24 months out; constrained supply supports both.
Investment metrics
- 1% rule
- 0.88% ✗
- Cap rate
- 7.45%
- Cash-on-cash
- 4.13%
- DSCR
- 1.18
- GRM
- 9.5
CMA / ARV
No comps found within radius.
Projected returns pro-forma
1.49% appreciation · 3.0% rent growth · sell at horizon
- IRR
- 7.1%
- Equity multiple
- 1.37×
- Total profit
- $10,347
- Equity at exit
- $36,551
- IRR
- 10.8%
- Equity multiple
- 2.38×
- Total profit
- $38,425
- Equity at exit
- $50,638
Cash invested: $27,860 (down + closing). Projections, not guarantees.
Landlord ↔ Tenant lean methodology
- Overall (STATE)
- 90 Strongly Landlord-Friendly
- State South Carolina
- 90 Strongly Landlord-Friendly · R+6
- County
- — inherits STATE
- City
- — inherits STATE
ZIP-level market 29114
- Home prices YoY
- 0.8%
- Active inventory
- 8
- Price-to-rent
- 9.5×
Monthly cashflow live
- Estimated rent
- $872 medium interval (Pro) →
- Mortgage (P&I)
- −$522
- Tax from tax record
- −$30 /mo · $362/yr
- Insurance
- −$41
- HOA
- −$0
- Vacancy / Maint / Mgmt
- −$183
- Net cashflow
- $96
Break-even live
Sensitivity live
| Price | -10% $152 | -5% $124 | +0% $96 | +5% $68 | +10% $39 |
|---|---|---|---|---|---|
| Rent | -10% $27 | -5% $61 | +0% $96 | +5% $130 | +10% $165 |
| Rate | -1.0pp $146 | -0.5pp $121 | base $96 | +0.5pp $70 | +1.0pp $44 |
UW: 25.0% down · 7.5% · 30yr · 1.5% tax · 5.0% vac · 8.0% maint · 8.0% mgmt
Financing live
Cash to close
- Down payment
- $24,875
- Closing costs
- $2,985
- Reserves months
- —
- Total cash needed
- —
Loan-product check · same deal, 3 products live
Conventional
25% down · 7.5% · 30yr
- Down + closing
- —
- Monthly P&I
- —
- Monthly cashflow
- —
- DSCR
- —
- Eligible?
- —
Personal DTI + credit; lowest rate.
DSCR
20% down · 8.5% · 30yr
- Down + closing
- —
- Monthly P&I
- —
- Monthly cashflow
- —
- DSCR
- —
- Eligible?
- —
No personal income docs; deal must DSCR.
Hard money
10% down · 12.0% · 12mo
- Down + closing
- —
- Monthly P&I
- —
- Monthly cashflow
- —
- DSCR
- —
- Eligible?
- —
Short-term bridge; refi at stabilization.
Listing history 2 events
-
2026-05-12status Pending
-
2026-04-20$99,500 Active
ⓘ Source: listings_history table (triggers on properties + properties_extension) + one-shot
backfill from property_details.listing_events for pre-trigger history.
Tax reassessment forecast SC · Resets to sale price
- Current annual tax
- $362 · $30/mo
- Projected year-2 tax
- $567 · $47/mo
- Expected delta
- +$205/yr (+$17/mo · 56.7%)
ⓘ Screening estimate from a state-policy table — verify with the county assessor before closing.
Climate risk First Street
- Flood 1/10 Low FEMA zone X (unshaded) · 0% chance over 30 yrs
- Wildfire 6/10 Major
- Heat 7/10 Severe 7 d/yr ≥109°F today · 15 d/yr by 30 yrs out
- Wind 8/10 Severe 80% chance of damaging wind over 30 yrs
- Air quality 2/10 Low 2 unhealthy d/yr today · 2 by 30 yrs out
Nearby sold comps map
Loading sold comps map…
Walkable amenities ~0.75 mi
Loading nearby amenities…
Taxation est. · year 1
- Rental income
- $10,469
- − Mortgage interest
- −$5,574
- − Property taxes
- −$362
- − Insurance
- −$498
- − Repairs & maintenance
- −$838
- − Management
- −$838
- − Depreciation
- −$2,895
- Taxable loss
- −$533
- Est. tax savings @ 24.0%
- +$128
- After-tax cash flow
- $1,278/yr
For passive investors: Depreciation is non-cash, so a rental often shows a tax loss while cash-flowing — sheltering income. Rental losses are passive: they offset passive income freely, and up to $25,000/yr can offset ordinary (W-2) income if you actively participate and your MAGI is under $100k (phasing out to $0 by $150k); unused losses carry forward. On sale, claimed depreciation is recaptured at up to 25%, and gains may owe capital-gains tax (a 1031 exchange can defer both). Figures are a year-1 estimate at your 24.0% rate — not tax advice; consult a CPA.
Schools (NCES district)
- District
- Florence 03
- NCES district ID
- 4502190
- Math proficiency
- 16% ▼ -8.00%
- Reading proficiency
- 27% ▼ -5.00%
- Median HH income
- $33,207
- Composite
- 17.51/100
- National rank
- #9053
- State rank
- #67 of 80 in SC
Livability — Olanta
- Score
- 69/100
- State rank
- #68
- US rank
- #8319
Category grades
Schools grade is shown separately in the Schools card above.
Census & demographics
- Census place
- Olanta, SC
- Population (ZIP)
- 1,815
Population outlook (Florence County) Hauer SSP2
- Today (2025)
- 141,714 people
- By 2030
- 142,121 · +0.3%
- By 2040
- 141,344 · -0.3%
- By 2050
- 139,478 · -1.6%
- By 2075
- 132,275 · -6.7%
- By 2100
- 118,374 · -16.5%
Race, ethnicity, and origin ACS 2023
- Neighborhood character
- Majority Black (62%)
- Race & ethnicity
- Black 62% White 35% Hispanic / Latino 1%
- Common ancestry
- Serbian 1%
- Foreign-born
- 1% · Canada
- Languages at home
- 98% English-only · Spanish 1% Other Asian/Pacific 1%
Political lean MEDSL · Florence
- 2024 margin
- Lean R (+8.0) · D 45.3% · R 53.3% · Other 1.3%
- 2008→2024 swing
- -4.8pp toward R · 2008: -3.2pp · 2024: -8.0pp
- All cycles
- 2024: R+8.0 2020: R+2.3 2016: R+5.0 2012: R+0.5 2008: R+3.2
Not yet ingested
- Civics
- —
Market trends
- HPI YoY
- ▲ 1.49%
- Current HPI
- 191.9563
- Rent YoY
- —
- Metro
- —
- State GDP YoY
- ▲ 4.51%
- F500 in state
- 2
Industry mix (Fortune 500 HQ in SC)
| Industry | F500 HQs | Revenue |
|---|---|---|
| Packaging | 1 | $7B |
|
||
Price history
2 events — show timeline
- 2026-05-12 Pending — Consolidated MLS
- 2026-04-20 Listed $99,500 Consolidated MLS
Property tax history
-5.7%/yrLatest (2025): $362 · +29.6% YoY. Source: county tax records.
Cash-flow waterfall
monthlySold comps — $/sqft
last 12 mo · ≤1 miLoading sold comps…