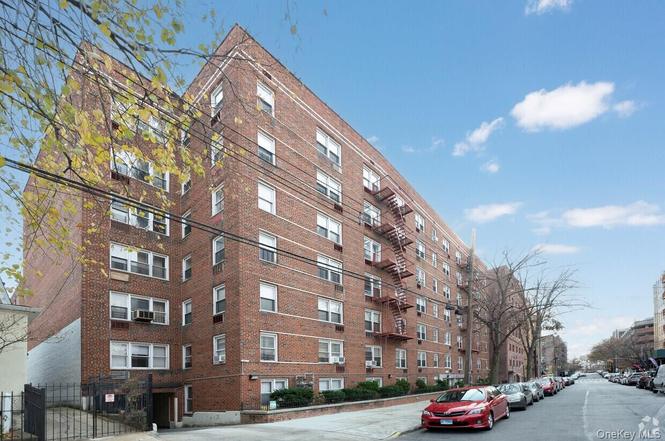
3520 Tryon Ave #405 · New York, NY
Flood risk 1/10 · Minimal
- FEMA flood zone
- X (unshaded)
- Chance of flooding over 30 yrs
- 0.0%
- Est. flood insurance / yr
- $507 – $1,088
Fire risk 1/10 · Minimal
- Est. fire insurance / yr
- $691 – $1,283
Heat risk 6/10 · Moderate
- Hot days now (above 99°F)
- 7 days/yr
- Hot days in 30 yrs
- 15 days/yr
Wind risk 6/10 · Moderate
- Chance of severe wind over 30 yrs
- 27.0%
Air-quality risk 3/10 · Minor
- Unhealthy air days now
- 3 days/yr
- Unhealthy air days in 30 yrs
- 4 days/yr
Risk factors via First Street. Map © Google.
Why this score? — see what drove the B grade
The composite is a weighted blend of 9 inputs, each scored 0–100. Each bar is that input's sub-score; the figure is the points it added to the 100-point composite (weight × sub-score).
- Cash flow +30.0/30.0
- 1% rule +10.0/10.0
- DSCR +10.0/10.0
- ARV discount +7.5/15.0
- Schools +5.0/10.0
- Rent growth +4.8/5.0
- Livability +3.8/5.0
- Condition / age +2.5/5.0
- Appreciation +0.0/10.0
$145,000
🖨 Deal sheet 📄 Offer letter ✓ Due diligence
Listing remarks MLS
This unit is located in the Norwood section of the Bronx near shops, transportation and health care. One bedroom, dining foyer, kitchen, living room and bathroom. Pet friendly (restricted weight). Gas, heat and hot water are included in the maintenance.
Key facts
- King-size bedroom
- Elevator
- Windowed kitchen
Tags
Property features AI
Finance
- HOA & community: Cooperative ownership (stock cooperative) — building/community fees or rules apply
Exterior
- Parking: Assigned parking (waitlist may apply); Garage available
- Utilities: Public sewer; Electricity available; Natural gas available; Trash collection (public)
- Home design: Stock cooperative
- Construction: Brick construction
- Exterior features: Brick exterior; Not waterfront
Interior
- Kitchen: Microwave; Range; Refrigerator
- Bedrooms: 3 total rooms (includes bedrooms and living areas)
- Bathrooms: 1 full bathroom
- Heating & cooling: Baseboard heating; Other heating; Wall/window AC unit(s)
- Interior features: Other interior features; Pets allowed - contact listing for policy
- Laundry & utility: See remarks for utility details
Neighborhood map
What this means for you Summary
Snapshot
- This is a 1-bed/1.0-bath condo listed at $145k.
Deal economics
- At list price, monthly cash flow is $722 ($9k/yr) — positive.
- The deal already cash-flows at list — no discount required.
- Meets the 1% rule at list price ($2k rent vs $145k).
- Recommended offer: $128k (12.0% below list) — sets the bar for market timing.
- Cap rate 12.3% vs local median 2.6% in New York — top-decile yield for the area; either an underpriced asset or a hidden risk that comps aren't pricing in. Stress-test before assuming the spread holds.
Location & tenants
- Location reads 75/100 on livability (#268 in NY, #4,188 nationally) — a middle-class / working-renter tenant base. Strengths: amenities A+, commute A+, health & safety A; Watch: crime F, cost of living F.
- Market conditions: Rents rising fast (+9.2%/yr); 129 active listings in the ZIP; 6,929 units permitted in Bronx County in 2024 (6,829 in 5+ unit buildings).
- At $2,182/mo this rent would consume 53% of the median local household income ($49k/yr) (locally 10930% of renters already pay >50% of income on rent) — very limited rent-growth headroom before tenants either downsize or default.
Forward outlook
- Local home prices are declining (-3.0%/yr); year-one equity from $1k of loan paydown is wiped out by about $4k of value loss. Plan a longer hold.
- Bronx County population projected at +21% by 2050 — long-run rental-demand tailwind backs the buy-and-hold thesis.
- At projected returns (-3.0% appreciation + 8.0% rent growth), your $41k cash investment doubles in ~5 years — after that, you're playing with house money.
Negotiation context
- It's been on market 215 days — a 12% lower offer ($128k) is reasonable based on typical stale-listing flexibility.
- 2 sale attempts since 13y ago; this cycle's ask has dropped $30k (17%) from the opening price — seller is motivated, your offer sets the floor, not the list.
- Current owner paid $40k; list at $145k implies a 263% gain — meaningful room to come down on a strong offer.
Risks & watch-outs
- Climate carrying-cost: major wind risk, 27% chance of damaging wind over 30y; extreme-heat days projected 7→15/yr by 2055 (HVAC capex compounding) — expect insurance premiums to compound above CPI over the hold.
Questions for the listing agent
- It's been on market 215 days. Have you received any prior offers? Is the seller open to a 12% concession, seller financing, or rate buy-down credit?
- Built in 1962 — when were the roof, HVAC, electrical panel, plumbing, and water heater last replaced?
- Any open or pending special assessments — roof, HVAC, plumbing, elevator, façade? What's the per-unit balance and payoff schedule, and is the seller paying it off at close or rolling it to the buyer?
- Why hasn't it sold? Are there any deal-killer items the seller is aware of (foundation, flood, title, zoning, code violations)?
- Is there a deadline driving the sale (1031 exchange, divorce, estate, relocation)? That informs how much negotiation room exists.
- Schools are B-rated — typically a magnet for longer-tenancy family renters. What's the average tenant stay here, and is there a school-zone premium baked into asking?
- Crime grade is F in this area — have there been break-ins, vandalism, or insurance claims at this property in the last 3 years? What carrier currently insures it and at what premium?
- What's the average days-on-market for RENTAL listings here right now (not sales)? A rising rental-DOM trend means longer vacancies and softer asking-rent achievability than the comps imply.
- What's the recent tenant-quality profile in this submarket — average credit score on applications, eviction rate, late-payment / NSF rate, and stable-employment percentage? A property-management company in the area should have these aggregated.
- How much new apartment / multifamily construction is in the pipeline within 1–3 miles? Heavy new supply (>2% of stock underway) typically softens rents 12–24 months out; light construction supports rent growth.
Investment metrics
- 1% rule
- 1.50% ✓
- Cap rate
- 12.26%
- Cash-on-cash
- 21.33%
- DSCR
- 1.95
- GRM
- 5.5
CMA / ARV
No comps found within radius.
Projected returns pro-forma
-3.0% appreciation · 8.0% rent growth · sell at horizon
- IRR
- 19.4%
- Equity multiple
- 1.84×
- Total profit
- $34,022
- Equity at exit
- $21,620
- IRR
- 31.0%
- Equity multiple
- 4.48×
- Total profit
- $141,414
- Equity at exit
- $12,537
Cash invested: $40,600 (down + closing). Projections, not guarantees.
Landlord ↔ Tenant lean methodology
- Overall (CITY)
- 0 Strongly Tenant-Friendly
- State New York
- 15 Strongly Tenant-Friendly · D+10
- County
- — inherits STATE
- City New York
- 0 Strongly Tenant-Friendly · D+34
ZIP-level market 10467
- Home prices YoY
- -32.8%
- Rents YoY
- 9.2%
- Active inventory
- 129
- Price-to-rent
- 5.5×
Monthly cashflow live
- Estimated rent
- $2,182 medium interval (Pro) →
- Mortgage (P&I)
- −$760
- Tax est. 1.5%
- −$181 /mo · $2,175/yr
- Insurance
- −$60
- HOA
- −$0
- Vacancy / Maint / Mgmt
- −$458
- Net cashflow
- $722
Break-even live
UW: 25.0% down · 7.5% · 30yr · 1.5% tax · 5.0% vac · 8.0% maint · 8.0% mgmt
Financing live
Cash to close
- Down payment
- $36,250
- Closing costs
- $4,350
- Reserves months
- —
- Total cash needed
- —
Loan-product check · same deal, 3 products live
Conventional
25% down · 7.5% · 30yr
- Down + closing
- —
- Monthly P&I
- —
- Monthly cashflow
- —
- DSCR
- —
- Eligible?
- —
Personal DTI + credit; lowest rate.
DSCR
20% down · 8.5% · 30yr
- Down + closing
- —
- Monthly P&I
- —
- Monthly cashflow
- —
- DSCR
- —
- Eligible?
- —
No personal income docs; deal must DSCR.
Hard money
10% down · 12.0% · 12mo
- Down + closing
- —
- Monthly P&I
- —
- Monthly cashflow
- —
- DSCR
- —
- Eligible?
- —
Short-term bridge; refi at stabilization.
HOA detail condo
- Monthly dues
- $0 · $0/yr
- Likely covers
- watergas
- Assessments
- None detected in remarks — confirm with the listing agent.
Listing history 15 events
-
2026-06-18days on market $145,000 Active 215 DOM
-
2026-06-17days on market $145,000 Active 214 DOM
-
2026-06-15days on market $145,000 Active 212 DOM
-
2026-06-13days on market $145,000 Active 210 DOM
-
2026-06-10days on market $145,000 Active 206 DOM
-
2026-06-08days on market $145,000 Active 205 DOM
-
2026-06-04days on market $145,000 Active 201 DOM
-
2026-06-03days on market $145,000 Active 200 DOM
-
2026-06-01days on market $145,000 Active 198 DOM
-
2026-05-31days on market $145,000 Active 197 DOM
-
2026-05-07price $145,000
-
2025-12-23price $160,000
-
2025-11-15$175,000 Active
-
2014-04-29soldstatus $39,900 253-char remark
Show marketing remark (253 chars)
This unit is located in the Norwood section of the Bronx near shops, transportation and health care. One bedroom, dining foyer, kitchen, living room and bathroom. Pet friendly (restricted weight). Gas, heat and hot water are included in the maintenance.
-
2013-05-17$39,900 253-char remark
Show marketing remark (253 chars)
This unit is located in the Norwood section of the Bronx near shops, transportation and health care. One bedroom, dining foyer, kitchen, living room and bathroom. Pet friendly (restricted weight). Gas, heat and hot water are included in the maintenance.
ⓘ Source: listings_history table (triggers on properties + properties_extension) + one-shot
backfill from property_details.listing_events for pre-trigger history.
Climate risk First Street
- Flood 1/10 Low FEMA zone X (unshaded) · 0% chance over 30 yrs
- Wildfire 1/10 Low
- Heat 6/10 Major 7 d/yr ≥99°F today · 15 d/yr by 30 yrs out
- Wind 6/10 Major 27% chance of damaging wind over 30 yrs
- Air quality 3/10 Moderate 3 unhealthy d/yr today · 4 by 30 yrs out
Nearby sold comps map
Loading sold comps map…
Walkable amenities ~0.75 mi
Loading nearby amenities…
Taxation est. · year 1
- Rental income
- $26,181
- − Mortgage interest
- −$8,122
- − Property taxes
- −$2,175
- − Insurance
- −$725
- − Repairs & maintenance
- −$2,095
- − Management
- −$2,095
- − Depreciation
- −$4,218
- Taxable income
- $6,752
- Est. tax owed @ 24.0%
- −$1,620
- After-tax cash flow
- $7,038/yr
For passive investors: Depreciation is non-cash, so a rental often shows a tax loss while cash-flowing — sheltering income. Rental losses are passive: they offset passive income freely, and up to $25,000/yr can offset ordinary (W-2) income if you actively participate and your MAGI is under $100k (phasing out to $0 by $150k); unused losses carry forward. On sale, claimed depreciation is recaptured at up to 25%, and gains may owe capital-gains tax (a 1031 exchange can defer both). Figures are a year-1 estimate at your 24.0% rate — not tax advice; consult a CPA.
Schools (NCES district)
No district data.
Livability — New York
- Score
- 75/100
- State rank
- #268
- US rank
- #4188
Category grades
Schools grade is shown separately in the Schools card above.
Census & demographics
- Census place
- New York, NY
- County
- Bronx County · 1,197,324 people
- City population
- 7,731,280
- Metro
- New York-Newark-Jersey City, NY-NJ-PA
- Population (ZIP)
- 96,421
- Household income
- $49,330
- Rent vs Own
- Severe rent burden
- 10930.0
Population outlook (Bronx County) Hauer SSP2
- Today (2025)
- 1,607,353 people
- By 2030
- 1,681,852 · +4.6%
- By 2040
- 1,824,421 · +13.5%
- By 2050
- 1,945,470 · +21.0%
- By 2075
- 2,187,887 · +36.1%
- By 2100
- 2,244,136 · +39.6%
Race, ethnicity, and origin ACS 2023
- Neighborhood character
- Diverse neighborhood (Simpson 0.62)
- Race & ethnicity
- Hispanic / Latino 53% Black 28% Two or more races 11% White 9% Asian 6% Native American 1%
- Hispanic origin (detail)
- Mexican 7% Puerto Rican 16% Dominican 22%
- Foreign-born
- 39% · Canada, Jamaica
- Languages at home
- 41% English-only · Spanish 45% Other Indo-European 7% French/Haitian/Cajun 1%
Political lean MEDSL · Bronx
- 2024 margin
- Solid D (+45.4) · D 72.7% · R 27.3%
- 2008→2024 swing
- -32.3pp toward R · 2008: 77.8pp · 2024: 45.4pp
- All cycles
- 2024: D+45.4 2020: D+67.6 2016: D+79.1 2012: D+82.9 2008: D+77.8
Not yet ingested
- Civics
- —
Market trends
- HPI YoY
- ▼ -112.76%
- Current HPI
- 231.537
- Rent YoY
- ▲ 9.23%
- Metro
- New York-Newark-Jersey City, NY-NJ-PA
- State GDP YoY
- ▲ 2.60%
- F500 in state
- 92
Industry mix (Fortune 500 HQ in NY)
| Industry | F500 HQs | Revenue |
|---|---|---|
| Financial Services | 10 | $950B |
|
||
| Consumer Goods | 9 | $162B |
|
||
| Insurance | 4 | $225B |
|
||
| Telecommunications | 2 | $144B |
|
||
| Pharmaceuticals | 2 | $112B |
|
||
| Media / Entertainment | 2 | $69B |
|
||
Price history
+263.4% since first listed5 events — show timeline
- 2026-05-07 Price Changed $145,000 OneKey® MLS as Distributed by MLS Grid
- 2025-12-23 Price Changed $160,000 OneKey® MLS as Distributed by MLS Grid
- 2025-11-15 Listed $175,000 OneKey® MLS as Distributed by MLS Grid
- 2014-04-29 Sold (MLS) $39,900 OneKey® MLS as Distributed by MLS Grid
- 2013-05-17 Listed $39,900 OneKey® MLS as Distributed by MLS Grid
Cash-flow waterfall
monthlySold comps — $/sqft
last 12 mo · ≤1 miLoading sold comps…