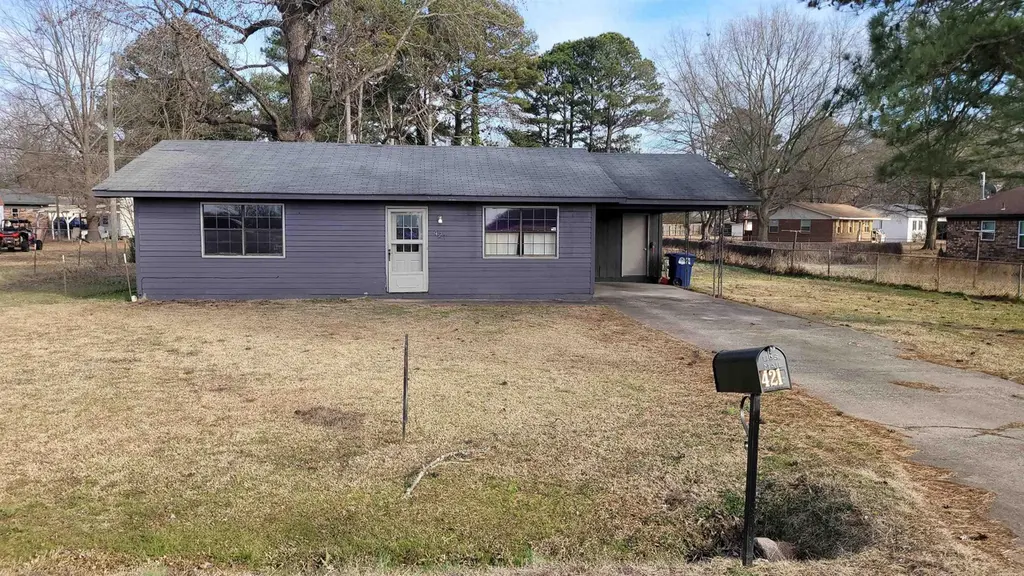
421 S Cherry · Beebe, AR
Flood risk 1/10 · Minimal
- FEMA flood zone
- X (unshaded)
- Chance of flooding over 30 yrs
- 0.0%
- Est. flood insurance / yr
- $507 – $1,088
Fire risk 3/10 · Minor
- Est. fire insurance / yr
- $1,499 – $2,785
Heat risk 6/10 · Moderate
- Hot days now (above 109°F)
- 7 days/yr
- Hot days in 30 yrs
- 19 days/yr
Wind risk 4/10 · Minor
- Chance of severe wind over 30 yrs
- 10.0%
Air-quality risk 2/10 · Minimal
- Unhealthy air days now
- 1 days/yr
- Unhealthy air days in 30 yrs
- 1 days/yr
Risk factors via First Street. Map © Google.
Why this score? — see what drove the D+ grade
The composite is a weighted blend of 9 inputs, each scored 0–100. Each bar is that input's sub-score; the figure is the points it added to the 100-point composite (weight × sub-score).
- ARV discount +15.0/15.0
- Cash flow +14.4/30.0
- DSCR +4.4/10.0
- 1% rule +4.0/10.0
- Schools +3.4/10.0
- Livability +3.3/5.0
- Rent growth +2.5/5.0
- Condition / age +2.5/5.0
- Appreciation +0.0/10.0
$119,000
🖨 Deal sheet (PDF) 📄 Offer letter ✓ Due diligence
Listing remarks MLS
Adorable 3 Bedroom 1 Bath Home . 2018 new Heat and air units. New water heater in 2025. Priced to sell and ideal for first-time buyers, investors, or anyone looking for a solid home at a great value. Convenient to town, schools, and daily essentials. Opportunity and affordability meet right here — don’t miss your chance to make it yours. Agents please see remarks.
Key facts
- 0.51 acre lot
- Built 1980
- Listed 108 days
Neighborhood map
What this means for you Summary
Snapshot
- This is a 3-bed/1.0-bath single-family listed at $119k.
Deal economics
- At list price, monthly cash flow is $23 ($282/yr) — positive.
- The deal already cash-flows at list — no discount required.
- To meet the 1% rule (rent ≥ 1% of price), the offer needs to be $107k (10.0% below list).
- Recommended offer: $107k (10.0% below list) — sets the bar for 1% rule.
- Cap rate 6.5% vs local median 3.8% in Beebe — top-decile yield for the area; either an underpriced asset or a hidden risk that comps aren't pricing in. Stress-test before assuming the spread holds.
Location & tenants
- Location reads 66/100 on livability (#114 in AR) — a middle-class / working-renter tenant base. Strengths: cost of living A+, housing A+; Watch: crime F, amenities F, commute F.
- Beebe School District (town): math 44% / reading 36% proficiency, ranked #64 of 238 in AR (top 27%) — families likely to look elsewhere, expect single-tenant / working-renter base with shorter leases.
- Zoned schools: Beebe Elementary School (math 50% / reading 35%, grade F, #169 of 454 statewide, top 38%, 871 students, 54% FRL); Beebe Junior High School (math 50% / reading 44%, grade D+, #46 of 201 statewide, top 24%, 519 students, 51% FRL); Beebe High School (math 30% / reading 36%, grade F, #115 of 292 statewide, top 40%, 1,031 students, 42% FRL).
- Market conditions: 152 active listings in the ZIP; 3 comparable units currently listed for rent nearby; rentals at typical pace (median 26d on market — plan ~3-4 weeks tenant-placement turnaround); 219 units permitted in White County in 2024 (36 in 5+ unit buildings).
Forward outlook
- Local home prices are declining (-3.0%/yr); year-one equity from $823 of loan paydown is wiped out by about $4k of value loss. Plan a longer hold.
- White County population projected at +7% by 2050 — modest demand growth; plan on rents tracking national, not racing it.
Negotiation context
- It's been on market 109 days — a 9% lower offer ($108k) is reasonable based on typical stale-listing flexibility.
- 7 sale attempts since 9y ago with the ask held roughly flat each time — persistent listings suggest the price (not the market) is what's stuck; bring a comps-based counter.
Risks & watch-outs
- Climate carrying-cost: extreme-heat days projected 7→19/yr by 2055 (HVAC capex compounding) — expect insurance premiums to compound above CPI over the hold.
Questions for the listing agent
- It's been on market 109 days. Have you received any prior offers? Is the seller open to a 10% concession, seller financing, or rate buy-down credit?
- Why hasn't it sold? Are there any deal-killer items the seller is aware of (foundation, flood, title, zoning, code violations)?
- Is there a deadline driving the sale (1031 exchange, divorce, estate, relocation)? That informs how much negotiation room exists.
- Schools are D-rated, which usually means shorter tenancies and higher turnover. Who's the typical renter profile here, and what's been the actual vacancy rate?
- Crime grade is F in this area — have there been break-ins, vandalism, or insurance claims at this property in the last 3 years? What carrier currently insures it and at what premium?
- The area grade is low — what's the realistic commute time and amenity access for the typical tenant pool here? Any planned neighborhood developments (good or bad) we should know about?
- What's the average days-on-market for RENTAL listings here right now (not sales)? A rising rental-DOM trend means longer vacancies and softer asking-rent achievability than the comps imply.
- What's the recent tenant-quality profile in this submarket — average credit score on applications, eviction rate, late-payment / NSF rate, and stable-employment percentage? A property-management company in the area should have these aggregated.
- How much new for-sale + rental construction is in the pipeline within 1–3 miles? Heavy new supply typically softens prices + rents 12–24 months out; constrained supply supports both.
Investment metrics
- 1% rule
- 0.90% ✗
- Cap rate
- 6.53%
- Cash-on-cash
- 0.85%
- DSCR
- 1.04
- GRM
- 9.3
CMA / ARV
- ARV (median comp)
- $151,091
- List price
- $119,000
- Delta
- -21.24%
- Verdict
- UNDERPRICED
- Comps
- 20 within 1.0 mi
Show comp detail 12 sales within ~0.75 mi
| Address | Dist | Beds/Ba | Sqft | Sold | Price | $/sf | Match |
|---|---|---|---|---|---|---|---|
| 616 S Elm St | 0.16mi | 3/1.0 | 1,048 (+5%) | 3mo | $151,000 | $144 | 82 |
| 606 N Elm | 0.10mi | 2/1.0 (-1) | 962 (-4%) | 18mo | $65,000 | $68 | 69 |
| 507 S Cypress St | 0.14mi | 3/1.0 | 1,108 (+11%) | 16mo | $70,000 | $63 | 62 |
| 704 N Cypress St | 0.74mi | 2/1.0 (-1) | 1,022 (+2%) | 5mo | $130,000 | $127 | 53 |
| 302 E Mississippi St | 0.72mi | 2/2.0 (-1) | 1,000 (0%) | 10mo | $152,000 | $152 | 49 |
| 229 Baldwin Dr | 0.54mi | 3/2.0 | 1,143 (+14%) | 8mo | $170,000 | $149 | 41 |
| 201 Baldwin Dr | 0.56mi | 3/2.0 | 1,143 (+14%) | 11mo | $172,000 | $150 | 37 |
| 514 E Mississippi | 0.71mi | 3/2.0 | 1,102 (+10%) | 14mo | $147,500 | $134 | 34 |
| 239 Baldwin Dr | 0.74mi | 3/2.0 | 1,143 (+14%) | 13mo | $179,825 | $157 | 27 |
| 210 Baldwin Dr | 0.73mi | 3/2.0 | 1,143 (+14%) | 14mo | $173,435 | $152 | 26 |
| 227 Baldwin Dr | 0.74mi | 3/2.0 | 1,143 (+14%) | 15mo | $171,900 | $150 | 25 |
| 221 Baldwin Dr | 0.75mi | 3/2.0 | 1,143 (+14%) | 18mo | $179,125 | $157 | 22 |
Match score weights: distance 35% · size 25% · config 20% · recency 20%. Top-matched comps best support the ARV.
Projected returns pro-forma
-3.0% appreciation · 3.0% rent growth · sell at horizon
- IRR
- -14.9%
- Equity multiple
- 0.47×
- Total profit
- $-17,772
- Equity at exit
- $17,743
- IRR
- -6.3%
- Equity multiple
- 0.60×
- Total profit
- $-13,485
- Equity at exit
- $10,289
Cash invested: $33,320 (down + closing). Projections, not guarantees.
Landlord ↔ Tenant lean methodology
- Overall (STATE)
- 92 Strongly Landlord-Friendly
- State Arkansas
- 92 Strongly Landlord-Friendly · R+14
- County
- — inherits STATE
- City
- — inherits STATE
ZIP-level market 72012
- Home prices YoY
- -15.4%
- Active inventory
- 152
- Price-to-rent
- 9.3×
Monthly cashflow live
- Estimated rent
- $1,071 medium interval (Pro) →
- Mortgage (P&I)
- −$624
- Tax est. 1.5%
- −$149 /mo · $1,785/yr
- Insurance
- −$50
- HOA
- −$0
- Vacancy / Maint / Mgmt
- −$225
- Net cashflow
- $23
Break-even live
Sensitivity live
| Price | -10% $106 | -5% $65 | +0% $23 | +5% $-18 | +10% $-59 |
|---|---|---|---|---|---|
| Rent | -10% $-61 | -5% $-19 | +0% $23 | +5% $66 | +10% $108 |
| Rate | -1.0pp $83 | -0.5pp $54 | base $23 | +0.5pp $-7 | +1.0pp $-39 |
UW: 25.0% down · 7.5% · 30yr · 1.5% tax · 5.0% vac · 8.0% maint · 8.0% mgmt
Financing live
Cash to close
- Down payment
- $29,750
- Closing costs
- $3,570
- Reserves months
- —
- Total cash needed
- —
Loan-product check · same deal, 3 products live
Conventional
25% down · 7.5% · 30yr
- Down + closing
- —
- Monthly P&I
- —
- Monthly cashflow
- —
- DSCR
- —
- Eligible?
- —
Personal DTI + credit; lowest rate.
DSCR
20% down · 8.5% · 30yr
- Down + closing
- —
- Monthly P&I
- —
- Monthly cashflow
- —
- DSCR
- —
- Eligible?
- —
No personal income docs; deal must DSCR.
Hard money
10% down · 12.0% · 12mo
- Down + closing
- —
- Monthly P&I
- —
- Monthly cashflow
- —
- DSCR
- —
- Eligible?
- —
Short-term bridge; refi at stabilization.
Rent comps 3 comps
| Address | Beds | Baths | Sqft | Rent | $/sqft | DOM | Units | Dist |
|---|---|---|---|---|---|---|---|---|
| 501 N Elm St Beebe, AR | 2.0 | 1.0 | 1028 | $795 | $0.77 | 25d | 1 | 0.68mi |
| 213 N Hickory St Beebe, AR | 4.0 | 1.0 | 1380 | $1,450 | $1.05 | 25d | 1 | 0.72mi |
| 606 Oregon St Beebe, AR | 2.0 | 2.0 | 1394 | $1,095 | $0.79 | 46d | 1 | 1.19mi |
Listing history 37 events
-
2026-06-22days on market $119,000 Active 109 DOM
-
2026-06-21days on market $119,000 Active 108 DOM
-
2026-06-19days on market $119,000 Active 106 DOM
-
2026-06-18days on market $119,000 Active 105 DOM
-
2026-06-17days on market $119,000 Active 104 DOM
-
2026-06-16days on market $119,000 Active 103 DOM
-
2026-06-15days on market $119,000 Active 102 DOM
-
2026-06-14days on market $119,000 Active 100 DOM
-
2026-06-12days on market $119,000 Active 99 DOM
-
2026-06-09days on market $119,000 Active 96 DOM
-
2026-06-08days on market $119,000 Active 95 DOM
-
2026-06-07days on market $119,000 Active 94 DOM
-
2026-06-05days on market $119,000 Active 91 DOM
-
2026-06-03days on market $119,000 Active 90 DOM
-
2026-06-02days on market $119,000 Active 89 DOM
-
2026-06-01days on market $119,000 Active 88 DOM
-
2026-05-31days on market $119,000 Active 87 DOM
-
2026-05-30days on market $119,000 Active 86 DOM
-
2026-03-05$119,000 New Listing 379-char remark
Show marketing remark (379 chars)
Adorable 3 Bedroom 1 Bath Home . 2018 new Heat and air units. New water heater in 2025. Priced to sell and ideal for first-time buyers, investors, or anyone looking for a solid home at a great value. Convenient to town, schools, and daily essentials. Opportunity and affordability meet right here — don’t miss your chance to make it yours. Agents please see remarks.
-
2026-01-25historical
-
2025-01-24$135,000 New Listing
-
2023-03-02status Under Contract
-
2023-03-02soldstatus $120,000
-
2023-02-28soldstatus $120,000 Sold
-
2023-01-29historical Take Backups
-
2023-01-28$120,000 New Listing
-
2022-12-03historical
-
2022-11-21status Back on Market
-
2022-10-22status Under Contract
-
2022-10-07price $119,000
-
2022-09-25$125,000 New Listing
-
2018-10-09soldstatus $71,500
-
2018-10-05soldstatus $71,500
-
2018-10-05$71,500
-
2017-10-02historical
-
2017-06-02$70,000 New Listing
-
2006-01-19soldstatus $60,000
ⓘ Source: listings_history table (triggers on properties + properties_extension) + one-shot
backfill from property_details.listing_events for pre-trigger history.
Climate risk First Street
- Flood 1/10 Low FEMA zone X (unshaded) · 0% chance over 30 yrs
- Wildfire 3/10 Moderate
- Heat 6/10 Major 7 d/yr ≥109°F today · 19 d/yr by 30 yrs out
- Wind 4/10 Moderate 10% chance of damaging wind over 30 yrs
- Air quality 2/10 Low 1 unhealthy d/yr today · 1 by 30 yrs out
Nearby sold comps map
Loading sold comps map…
Walkable amenities ~0.75 mi
Loading nearby amenities…
Taxation est. · year 1
- Rental income
- $12,848
- − Mortgage interest
- −$6,666
- − Property taxes
- −$1,785
- − Insurance
- −$595
- − Repairs & maintenance
- −$1,028
- − Management
- −$1,028
- − Depreciation
- −$3,462
- Taxable loss
- −$1,715
- Est. tax savings @ 24.0%
- +$412
- After-tax cash flow
- $693/yr
For passive investors: Depreciation is non-cash, so a rental often shows a tax loss while cash-flowing — sheltering income. Rental losses are passive: they offset passive income freely, and up to $25,000/yr can offset ordinary (W-2) income if you actively participate and your MAGI is under $100k (phasing out to $0 by $150k); unused losses carry forward. On sale, claimed depreciation is recaptured at up to 25%, and gains may owe capital-gains tax (a 1031 exchange can defer both). Figures are a year-1 estimate at your 24.0% rate — not tax advice; consult a CPA.
Schools (NCES district)
- District
- Beebe School District
- NCES district ID
- 0502880
- Math proficiency
- 44% ▼ -10.00%
- Reading proficiency
- 36% ▼ -7.00%
- Median HH income
- $45,433
- Composite
- 34.1/100
- National rank
- #5293
- State rank
- #64 of 238 in AR
Livability — Beebe
- Score
- 66/100
- State rank
- #114
- US rank
- #11235
Category grades
Schools grade is shown separately in the Schools card above.
Census & demographics
- Census place
- Beebe, AR
- Population (ZIP)
- 13,663
Population outlook (White County) Hauer SSP2
- Today (2025)
- 82,310 people
- By 2030
- 83,861 · +1.9%
- By 2040
- 86,492 · +5.1%
- By 2050
- 88,246 · +7.2%
- By 2075
- 91,307 · +10.9%
- By 2100
- 91,548 · +11.2%
Race, ethnicity, and origin ACS 2023
- Neighborhood character
- Predominantly White (90%)
- Race & ethnicity
- White 90% Two or more races 6% Hispanic / Latino 3% Black 1%
- Common ancestry
- Slovak 3% Italian 2% Romanian 1%
- Foreign-born
- 1% · Canada
- Languages at home
- 98% English-only · Spanish 1%
Political lean MEDSL · White
- 2024 margin
- Solid R (+61.2) · D 18.3% · R 79.5% · Other 2.2%
- 2008→2024 swing
- -14.0pp toward R · 2008: -47.2pp · 2024: -61.2pp
- All cycles
- 2024: R+61.2 2020: R+58.9 2016: R+57.9 2012: R+53.7 2008: R+47.2
Not yet ingested
- Civics
- —
Market trends
- HPI YoY
- ▼ -40.40%
- Current HPI
- 221.5962
- Rent YoY
- —
- Metro
- —
- State GDP YoY
- ▲ 3.80%
- F500 in state
- 10
Industry mix (Fortune 500 HQ in AR)
| Industry | F500 HQs | Revenue |
|---|---|---|
| Retail | 1 | $681B |
|
||
| Food / Agriculture | 1 | $53B |
|
||
| Retail / Energy | 1 | $22B |
|
||
| Transportation / Logistics | 1 | $12B |
|
||
| Energy | 1 | $4B |
|
||
Price history
+98.3% since first listed19 events — show timeline
- 2026-03-05 Listed $119,000 CARMLS
- 2026-01-25 Listing Removed — CARMLS
- 2025-01-24 Listed $135,000 CARMLS
- 2023-03-02 Pending — CARMLS
- 2023-03-02 Sold (Public Records) $120,000 Public Records
- 2023-02-28 Sold (MLS) $120,000 CARMLS
- 2023-01-29 Contingent — CARMLS
- 2023-01-28 Listed $120,000 CARMLS
- 2022-12-03 Listing Removed — CARMLS
- 2022-11-21 Relisted — CARMLS
- 2022-10-22 Pending — CARMLS
- 2022-10-07 Price Changed $119,000 CARMLS
- 2022-09-25 Listed $125,000 CARMLS
- 2018-10-09 Sold (Public Records) $71,500 Public Records
- 2018-10-05 Listed $71,500 CARMLS
- 2018-10-05 Sold (MLS) $71,500 CARMLS
- 2017-10-02 Listing Removed — CARMLS
- 2017-06-02 Listed $70,000 CARMLS
- 2006-01-19 Sold (Public Records) $60,000 Public Records
Property tax history
-15.1%/yrLatest (2024): $70 · -51.9% YoY. Source: county tax records.
Cash-flow waterfall
monthlySold comps — $/sqft
last 12 mo · ≤1 miLoading sold comps…