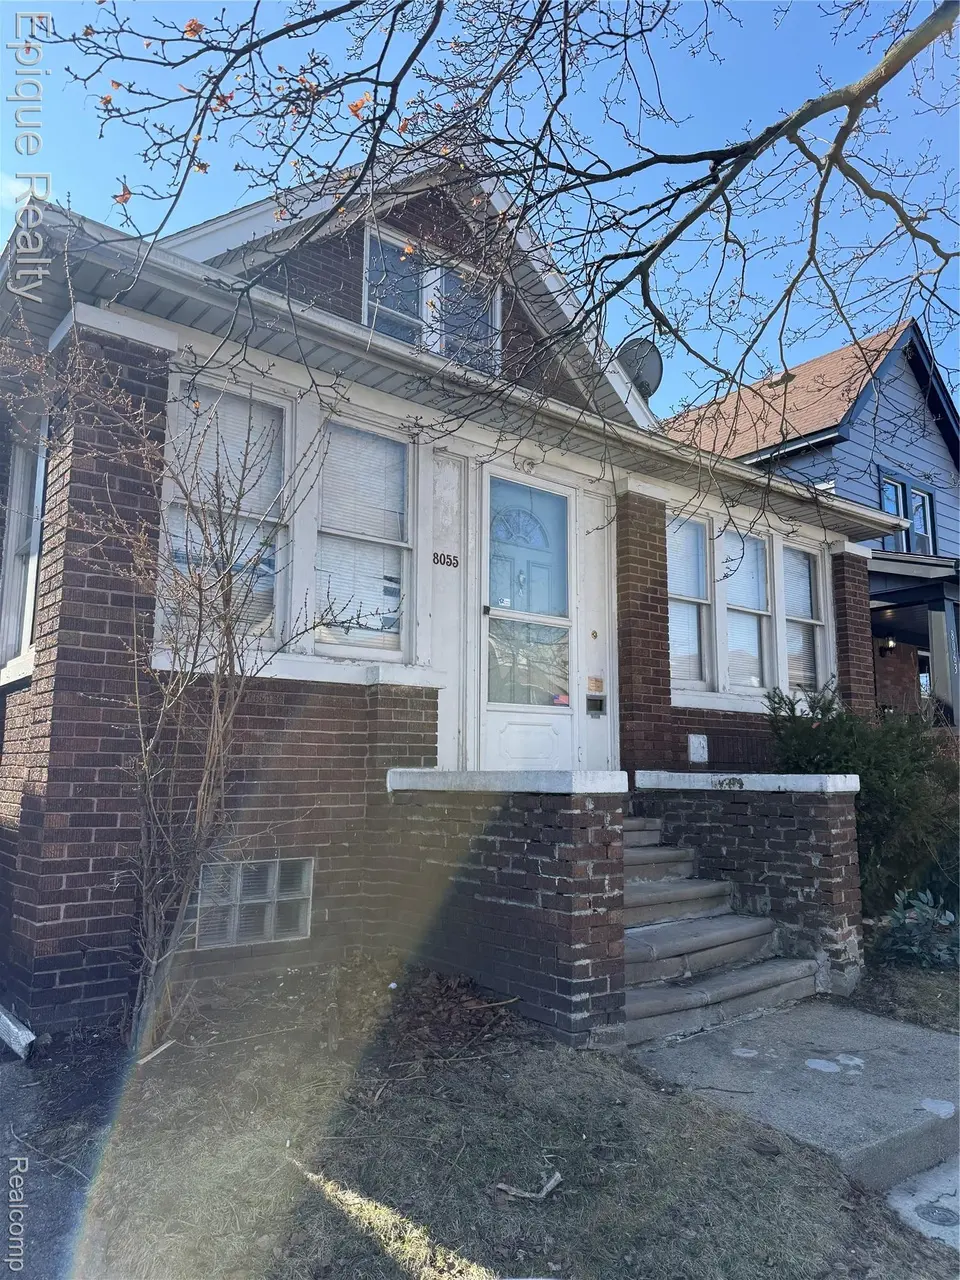
8055 Gartner St · Detroit, MI
Flood risk 1/10 · Minimal
- FEMA flood zone
- X (unshaded)
- Chance of flooding over 30 yrs
- 0.0%
- Est. flood insurance / yr
- $473 – $860
Fire risk 1/10 · Minimal
- Est. fire insurance / yr
- $784 – $1,456
Heat risk 3/10 · Minor
- Hot days now (above 95°F)
- 7 days/yr
- Hot days in 30 yrs
- 15 days/yr
Wind risk 2/10 · Minimal
- Chance of severe wind over 30 yrs
- —
Air-quality risk 4/10 · Minor
- Unhealthy air days now
- 6 days/yr
- Unhealthy air days in 30 yrs
- 8 days/yr
Risk factors via First Street. Map © Google.
Why this score? — see what drove the B- grade
The composite is a weighted blend of 9 inputs, each scored 0–100. Each bar is that input's sub-score; the figure is the points it added to the 100-point composite (weight × sub-score).
- Cash flow +25.7/30.0
- Appreciation +10.0/10.0
- DSCR +8.6/10.0
- 1% rule +7.5/10.0
- ARV discount +7.2/15.0
- Livability +3.7/5.0
- Rent growth +2.5/5.0
- Condition / age +2.5/5.0
- Schools +1.3/10.0
$150,000
🖨 Deal sheet (PDF) 📄 Offer letter ✓ Due diligence
Listing remarks MLS
HIGHEST AND BEST OFFER BY SUNDAY MARCH 22 AT 6PM. OPEN HOUSE TODAY =MARCH 22 1PM-3PM. DUPLEX!!! 6 BEDROOMS! 2 FULL BATHS! LIVE IN ONE AND RENT OUT THE OTHER! Purchase with a Rent To Own/Land Contract agreement. $15,000 Down! and $1700/mo plus taxes and Insurance. Great custom wood work and a great location makes this an amazing opportunity IF YOU DDONT WANT TO GET A MORTGAGE. .Agent Owned
Key facts
- 3,049 sq ft lot
- 2 garage spots
- Built 1924
Neighborhood map
What this means for you Summary
Snapshot
- This is a 6-bed/1.0-bath single-family listed at $150k.
Deal economics
- At list price, monthly cash flow is $360 ($4k/yr) — positive.
- The deal already cash-flows at list — no discount required.
- Meets the 1% rule at list price ($2k rent vs $150k).
- Recommended offer: $148k (1.5% below list) — sets the bar for market timing.
Location & tenants
- Location reads 73/100 on livability (#218 in MI) — a middle-class / working-renter tenant base. Strengths: amenities A+, commute A+, cost of living A+; Watch: schools F, crime F, employment F.
- Detroit Public Schools Community District (urban): math 10% / reading 24% proficiency, ranked #499 of 540 in MI (top 92%) — low school quality limits family demand, transient renter base, plan for 1-2y turnover; 90% free/reduced lunch — lower-income household profile, screen leases tightly.
- Market conditions: 69 active listings in the ZIP; 1 comparable units currently listed for rent nearby; lower-income renter base — watch delinquency; 2,639 units permitted in Wayne County in 2024 (1,216 in 5+ unit buildings).
- At $1,878/mo this rent would consume 52% of the median local household income ($43k/yr) (locally 831% of renters already pay >50% of income on rent) — very limited rent-growth headroom before tenants either downsize or default.
Forward outlook
- In year one you build about $16k of equity ($1k loan paydown + $15k appreciation (10.0% local appreciation)).
- Wayne County population projected at -17% by 2050 — secular population decline; favor cash flow + early exit over multi-decade hold.
- At projected returns (10.0% appreciation + 3.0% rent growth), your $42k cash investment doubles in ~2 years — after that, you're playing with house money.
- By year 3, paydown + projected appreciation supports a ~$41k cash-out refi (75% LTV) — recoverable capital for the next deal without selling this one.
Negotiation context
- It's been on market 19 days — a 2% lower offer ($148k) is reasonable based on typical stale-listing flexibility.
- 9 sale attempts since 4y ago; this cycle's ask is 8724% above the opening price — seller raised mid-cycle; expect resistance to lowballs.
- Current owner paid $90k; list at $150k implies a 67% gain — meaningful room to come down on a strong offer.
Risks & watch-outs
- Watch-outs: built in 1924 — expect roof / HVAC / electrical / plumbing capex.
Questions for the listing agent
- Built in 1924 — when were the roof, HVAC, electrical panel, plumbing, and water heater last replaced?
- Is there a deadline driving the sale (1031 exchange, divorce, estate, relocation)? That informs how much negotiation room exists.
- Schools are F-rated, which usually means shorter tenancies and higher turnover. Who's the typical renter profile here, and what's been the actual vacancy rate?
- Crime grade is F in this area — have there been break-ins, vandalism, or insurance claims at this property in the last 3 years? What carrier currently insures it and at what premium?
- What's the average days-on-market for RENTAL listings here right now (not sales)? A rising rental-DOM trend means longer vacancies and softer asking-rent achievability than the comps imply.
- What's the recent tenant-quality profile in this submarket — average credit score on applications, eviction rate, late-payment / NSF rate, and stable-employment percentage? A property-management company in the area should have these aggregated.
- How much new for-sale + rental construction is in the pipeline within 1–3 miles? Heavy new supply typically softens prices + rents 12–24 months out; constrained supply supports both.
Investment metrics
- 1% rule
- 1.25% ✓
- Cap rate
- 9.17%
- Cash-on-cash
- 10.28%
- DSCR
- 1.46
- GRM
- 6.7
CMA / ARV
- ARV (on-the-fly)
- $149,112
- Comps found
- 2
Show comp detail 2 sales within ~0.75 mi
| Address | Dist | Beds/Ba | Sqft | Sold | Price | $/sf | Match |
|---|---|---|---|---|---|---|---|
| 8810 Lafayette Blvd | 0.57mi | 5/2.0 (-1) | 1,504 (+10%) | 22mo | $130,000 | $86 | 30 |
| 9182 Lafayette Blvd | 0.67mi | 5/2.0 (-1) | 1,553 (+14%) | 14mo | $170,000 | $109 | 26 |
Match score weights: distance 35% · size 25% · config 20% · recency 20%. Top-matched comps best support the ARV.
Projected returns pro-forma
10.0% appreciation · 3.0% rent growth · sell at horizon
- IRR
- 31.8%
- Equity multiple
- 3.49×
- Total profit
- $104,701
- Equity at exit
- $135,132
- IRR
- 27.5%
- Equity multiple
- 7.92×
- Total profit
- $290,461
- Equity at exit
- $291,417
Cash invested: $42,000 (down + closing). Projections, not guarantees.
Landlord ↔ Tenant lean methodology
- Overall (STATE)
- 62 Landlord-Friendly
- State Michigan
- 62 Landlord-Friendly · EVEN
- County
- — inherits STATE
- City
- — inherits STATE
ZIP-level market 48209
- Home prices YoY
- 21.8%
- Active inventory
- 69
- Price-to-rent
- 6.7×
Monthly cashflow live
- Estimated rent
- $1,878 medium interval (Pro) →
- Mortgage (P&I)
- −$787
- Tax from tax record
- −$274 /mo · $3,291/yr
- Insurance
- −$62
- HOA
- −$0
- Vacancy / Maint / Mgmt
- −$394
- Net cashflow
- $360
Break-even live
Sensitivity live
| Price | -10% $445 | -5% $402 | +0% $360 | +5% $317 | +10% $275 |
|---|---|---|---|---|---|
| Rent | -10% $212 | -5% $286 | +0% $360 | +5% $434 | +10% $508 |
| Rate | -1.0pp $435 | -0.5pp $398 | base $360 | +0.5pp $321 | +1.0pp $282 |
UW: 25.0% down · 7.5% · 30yr · 1.5% tax · 5.0% vac · 8.0% maint · 8.0% mgmt
Financing live
Cash to close
- Down payment
- $37,500
- Closing costs
- $4,500
- Reserves months
- —
- Total cash needed
- —
Loan-product check · same deal, 3 products live
Conventional
25% down · 7.5% · 30yr
- Down + closing
- —
- Monthly P&I
- —
- Monthly cashflow
- —
- DSCR
- —
- Eligible?
- —
Personal DTI + credit; lowest rate.
DSCR
20% down · 8.5% · 30yr
- Down + closing
- —
- Monthly P&I
- —
- Monthly cashflow
- —
- DSCR
- —
- Eligible?
- —
No personal income docs; deal must DSCR.
Hard money
10% down · 12.0% · 12mo
- Down + closing
- —
- Monthly P&I
- —
- Monthly cashflow
- —
- DSCR
- —
- Eligible?
- —
Short-term bridge; refi at stabilization.
Rent comps 1 comps
| Address | Beds | Baths | Sqft | Rent | $/sqft | DOM | Units | Dist |
|---|---|---|---|---|---|---|---|---|
| 8804 Mason Pl Detroit, MI | 5.0 | 2.0 | 1680 | $2,800 | $1.67 | 0d | 1 | 0.37mi |
Listing history 28 events
-
2026-04-06historical $1,700
Show marketing remark (391 chars)
HIGHEST AND BEST OFFER BY SUNDAY MARCH 22 AT 6PM. OPEN HOUSE TODAY =MARCH 22 1PM-3PM. DUPLEX!!! 6 BEDROOMS! 2 FULL BATHS! LIVE IN ONE AND RENT OUT THE OTHER! Purchase with a Rent To Own/Land Contract agreement. $15,000 Down! and $1700/mo plus taxes and Insurance. Great custom wood work and a great location makes this an amazing opportunity IF YOU DDONT WANT TO GET A MORTGAGE. .Agent Owned
-
2026-04-06status Pending
Show marketing remark (391 chars)
HIGHEST AND BEST OFFER BY SUNDAY MARCH 22 AT 6PM. OPEN HOUSE TODAY =MARCH 22 1PM-3PM. DUPLEX!!! 6 BEDROOMS! 2 FULL BATHS! LIVE IN ONE AND RENT OUT THE OTHER! Purchase with a Rent To Own/Land Contract agreement. $15,000 Down! and $1700/mo plus taxes and Insurance. Great custom wood work and a great location makes this an amazing opportunity IF YOU DDONT WANT TO GET A MORTGAGE. .Agent Owned
-
2026-04-06status Pending 397-char remark
Show marketing remark (391 chars)
HIGHEST AND BEST OFFER BY SUNDAY MARCH 22 AT 6PM. OPEN HOUSE TODAY =MARCH 22 1PM-3PM. DUPLEX!!! 6 BEDROOMS! 2 FULL BATHS! LIVE IN ONE AND RENT OUT THE OTHER! Purchase with a Rent To Own/Land Contract agreement. $15,000 Down! and $1700/mo plus taxes and Insurance. Great custom wood work and a great location makes this an amazing opportunity IF YOU DDONT WANT TO GET A MORTGAGE. .Agent Owned
-
2026-04-06status Pending 391-char remark
Show marketing remark (391 chars)
HIGHEST AND BEST OFFER BY SUNDAY MARCH 22 AT 6PM. OPEN HOUSE TODAY =MARCH 22 1PM-3PM. DUPLEX!!! 6 BEDROOMS! 2 FULL BATHS! LIVE IN ONE AND RENT OUT THE OTHER! Purchase with a Rent To Own/Land Contract agreement. $15,000 Down! and $1700/mo plus taxes and Insurance. Great custom wood work and a great location makes this an amazing opportunity IF YOU DDONT WANT TO GET A MORTGAGE. .Agent Owned
-
2026-04-06status Pending
Show marketing remark (391 chars)
HIGHEST AND BEST OFFER BY SUNDAY MARCH 22 AT 6PM. OPEN HOUSE TODAY =MARCH 22 1PM-3PM. DUPLEX!!! 6 BEDROOMS! 2 FULL BATHS! LIVE IN ONE AND RENT OUT THE OTHER! Purchase with a Rent To Own/Land Contract agreement. $15,000 Down! and $1700/mo plus taxes and Insurance. Great custom wood work and a great location makes this an amazing opportunity IF YOU DDONT WANT TO GET A MORTGAGE. .Agent Owned
-
2026-03-19$1,700
-
2026-03-18$150,000 Active 397-char remark
Show marketing remark (391 chars)
HIGHEST AND BEST OFFER BY SUNDAY MARCH 22 AT 6PM. OPEN HOUSE TODAY =MARCH 22 1PM-3PM. DUPLEX!!! 6 BEDROOMS! 2 FULL BATHS! LIVE IN ONE AND RENT OUT THE OTHER! Purchase with a Rent To Own/Land Contract agreement. $15,000 Down! and $1700/mo plus taxes and Insurance. Great custom wood work and a great location makes this an amazing opportunity IF YOU DDONT WANT TO GET A MORTGAGE. .Agent Owned
-
2026-03-18$150,000 Active
Show marketing remark (391 chars)
HIGHEST AND BEST OFFER BY SUNDAY MARCH 22 AT 6PM. OPEN HOUSE TODAY =MARCH 22 1PM-3PM. DUPLEX!!! 6 BEDROOMS! 2 FULL BATHS! LIVE IN ONE AND RENT OUT THE OTHER! Purchase with a Rent To Own/Land Contract agreement. $15,000 Down! and $1700/mo plus taxes and Insurance. Great custom wood work and a great location makes this an amazing opportunity IF YOU DDONT WANT TO GET A MORTGAGE. .Agent Owned
-
2026-03-18$150,000 Active 391-char remark
Show marketing remark (391 chars)
HIGHEST AND BEST OFFER BY SUNDAY MARCH 22 AT 6PM. OPEN HOUSE TODAY =MARCH 22 1PM-3PM. DUPLEX!!! 6 BEDROOMS! 2 FULL BATHS! LIVE IN ONE AND RENT OUT THE OTHER! Purchase with a Rent To Own/Land Contract agreement. $15,000 Down! and $1700/mo plus taxes and Insurance. Great custom wood work and a great location makes this an amazing opportunity IF YOU DDONT WANT TO GET A MORTGAGE. .Agent Owned
-
2026-03-18$150,000 Active
Show marketing remark (391 chars)
HIGHEST AND BEST OFFER BY SUNDAY MARCH 22 AT 6PM. OPEN HOUSE TODAY =MARCH 22 1PM-3PM. DUPLEX!!! 6 BEDROOMS! 2 FULL BATHS! LIVE IN ONE AND RENT OUT THE OTHER! Purchase with a Rent To Own/Land Contract agreement. $15,000 Down! and $1700/mo plus taxes and Insurance. Great custom wood work and a great location makes this an amazing opportunity IF YOU DDONT WANT TO GET A MORTGAGE. .Agent Owned
-
2023-02-06soldstatus $90,000
-
2023-01-17soldstatus $90,000 Sold
-
2023-01-17soldstatus $90,000 Closed
-
2022-12-28status Pending
-
2022-12-28status Pending
-
2022-12-28status Pending
-
2022-12-28status Pending
-
2022-12-22historical
-
2022-12-22historical
-
2022-12-02price $85,000
-
2022-12-02price $85,000
-
2022-12-01price $85,000
-
2022-12-01price $85,000
-
2022-11-17$95,000 Active
-
2022-11-14$95,000 Active
-
2022-11-08$95,000 Active
-
2022-11-08historical
-
2022-11-04$95,000 Active
ⓘ Source: listings_history table (triggers on properties + properties_extension) + one-shot
backfill from property_details.listing_events for pre-trigger history.
Tax reassessment forecast MI · Partial reset (capped growth)
- Current annual tax
- $3,291 · $274/mo
- Projected year-2 tax
- $3,291 · $274/mo
- Expected delta
- $0/yr ($0/mo · 0.0%)
ⓘ Screening estimate from a state-policy table — verify with the county assessor before closing.
Climate risk First Street
- Flood 1/10 Low FEMA zone X (unshaded) · 0% chance over 30 yrs
- Wildfire 1/10 Low
- Heat 3/10 Moderate 7 d/yr ≥95°F today · 15 d/yr by 30 yrs out
- Wind 2/10 Low
- Air quality 4/10 Moderate 6 unhealthy d/yr today · 8 by 30 yrs out
Nearby sold comps map
Loading sold comps map…
Walkable amenities ~0.75 mi
Loading nearby amenities…
Taxation est. · year 1
- Rental income
- $22,531
- − Mortgage interest
- −$8,402
- − Property taxes
- −$3,291
- − Insurance
- −$750
- − Repairs & maintenance
- −$1,802
- − Management
- −$1,802
- − Depreciation
- −$4,364
- Taxable income
- $2,119
- Est. tax owed @ 24.0%
- −$509
- After-tax cash flow
- $3,811/yr
For passive investors: Depreciation is non-cash, so a rental often shows a tax loss while cash-flowing — sheltering income. Rental losses are passive: they offset passive income freely, and up to $25,000/yr can offset ordinary (W-2) income if you actively participate and your MAGI is under $100k (phasing out to $0 by $150k); unused losses carry forward. On sale, claimed depreciation is recaptured at up to 25%, and gains may owe capital-gains tax (a 1031 exchange can defer both). Figures are a year-1 estimate at your 24.0% rate — not tax advice; consult a CPA.
Schools (NCES district)
- District
- Detroit Public Schools Community District
- NCES district ID
- 2601103
- Math proficiency
- 10% ▼ -2.00%
- Reading proficiency
- 24% ▲ 6.00%
- Median HH income
- $25,815
- Composite
- 13.06/100
- National rank
- #9564
- State rank
- #499 of 540 in MI
Livability — Detroit
- Score
- 73/100
- State rank
- #218
- US rank
- #5427
Category grades
Schools grade is shown separately in the Schools card above.
Census & demographics
- Census place
- Detroit, MI
- County
- Wayne County · 1,562,939 people
- City population
- 572,865
- Metro
- Detroit-Warren-Dearborn, MI
- Population (ZIP)
- 27,184
- Household income
- $43,161
- Rent vs Own
- Severe rent burden
- 831.0
Population outlook (Wayne County) Hauer SSP2
- Today (2025)
- 1,675,273 people
- By 2030
- 1,620,300 · -3.3%
- By 2040
- 1,502,341 · -10.3%
- By 2050
- 1,384,039 · -17.4%
- By 2075
- 1,124,592 · -32.9%
- By 2100
- 881,193 · -47.4%
Race, ethnicity, and origin ACS 2023
- Neighborhood character
- Predominantly Hispanic (76%)
- Race & ethnicity
- Hispanic / Latino 76% White 17% Two or more races 14% Black 6% Native American 2%
- Hispanic origin (detail)
- Mexican 58% Puerto Rican 7% Cuban 1%
- Common ancestry
- Romanian 2% Lithuanian 0%
- Foreign-born
- 26% · Canada
- Languages at home
- 38% English-only · Spanish 62%
Political lean MEDSL · Wayne
- 2024 margin
- Strong D (+29.0) · D 62.7% · R 33.7% · Other 3.6%
- 2008→2024 swing
- -20.5pp toward R · 2008: 49.5pp · 2024: 29.0pp
- All cycles
- 2024: D+29.0 2020: D+38.1 2016: D+37.3 2012: D+46.9 2008: D+49.5
Not yet ingested
- Civics
- —
Market trends
- HPI YoY
- ▲ 73.77%
- Current HPI
- 412.9753
- Rent YoY
- —
- Metro
- Detroit-Warren-Dearborn, MI
- State GDP YoY
- ▲ 1.37%
- F500 in state
- 28
Industry mix (Fortune 500 HQ in MI)
| Industry | F500 HQs | Revenue |
|---|---|---|
| Automotive Parts | 3 | $48B |
|
||
| Automotive | 2 | $372B |
|
||
| Chemicals | 1 | $45B |
|
||
| Automotive Retail | 1 | $29B |
|
||
| Healthcare / Medical Devices | 1 | $23B |
|
||
| Automotive Technology | 1 | $20B |
|
||
Price history
-98.2% since first listed28 events — show timeline
- 2026-04-06 Rental Removed $1,700 REALSOURCE
- 2026-04-06 Pending — REALCOMP
- 2026-04-06 Pending — REALCOMP
- 2026-04-06 Pending — MiRealSource-MiMLS
- 2026-04-06 Pending — MiRealSource-MiMLS
- 2026-03-19 Listed for Rent $1,700 REALSOURCE
- 2026-03-18 Listed $150,000 REALCOMP
- 2026-03-18 Listed $150,000 REALCOMP
- 2026-03-18 Listed $150,000 MiRealSource-MiMLS
- 2026-03-18 Listed $150,000 MiRealSource-MiMLS
- 2023-02-06 Sold (Public Records) $90,000 Public Records
- 2023-01-17 Sold (MLS) $90,000 MiRealSource-MiMLS
- 2023-01-17 Sold (MLS) $90,000 REALCOMP
- 2022-12-28 Pending — MiRealSource-MiMLS
- 2022-12-28 Pending — MiRealSource-MiMLS
- 2022-12-28 Pending — REALCOMP
- 2022-12-28 Pending — REALCOMP
- 2022-12-22 Listing Removed — MiRealSource-MiMLS
- 2022-12-22 Listing Removed — REALCOMP
- 2022-12-02 Price Changed $85,000 MiRealSource-MiMLS
- 2022-12-02 Price Changed $85,000 MiRealSource-MiMLS
- 2022-12-01 Price Changed $85,000 REALCOMP
- 2022-12-01 Price Changed $85,000 REALCOMP
- 2022-11-17 Listed $95,000 REALCOMP
- 2022-11-14 Listed $95,000 MiRealSource-MiMLS
- 2022-11-08 Listed $95,000 REALCOMP
- 2022-11-08 Coming Soon — REALCOMP
- 2022-11-04 Listed $95,000 MiRealSource-MiMLS
Property tax history
+13.9%/yrLatest (2025): $3,291 · -10.7% YoY. Source: county tax records.
Cash-flow waterfall
monthlySold comps — $/sqft
last 12 mo · ≤1 miLoading sold comps…