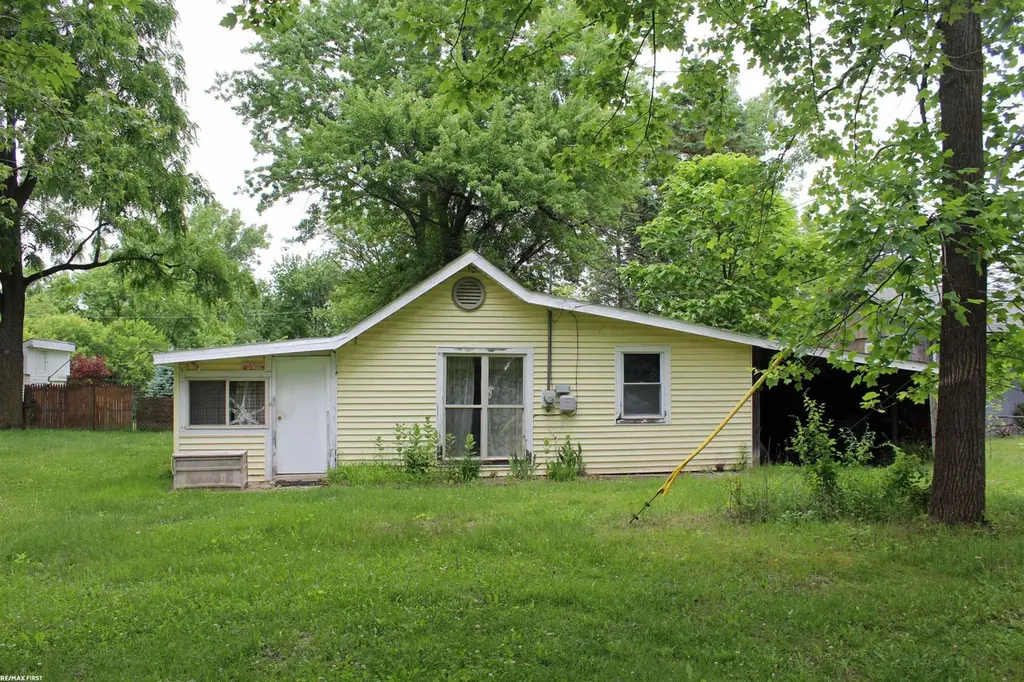
4954 Whipple Lake Rd St · Independence, MI
Flood risk 1/10 · Minimal
- FEMA flood zone
- X (unshaded)
- Chance of flooding over 30 yrs
- 0.0%
- Est. flood insurance / yr
- $507 – $1,088
Fire risk 1/10 · Minimal
- Est. fire insurance / yr
- $784 – $1,456
Heat risk 2/10 · Minimal
- Hot days now (above 95°F)
- 7 days/yr
- Hot days in 30 yrs
- 15 days/yr
Wind risk 2/10 · Minimal
- Chance of severe wind over 30 yrs
- —
Air-quality risk 3/10 · Minor
- Unhealthy air days now
- 2 days/yr
- Unhealthy air days in 30 yrs
- 4 days/yr
Risk factors via First Street. Map © Google.
Why this score? — see what drove the B- grade
The composite is a weighted blend of 9 inputs, each scored 0–100. Each bar is that input's sub-score; the figure is the points it added to the 100-point composite (weight × sub-score).
- Cash flow +30.0/30.0
- 1% rule +10.0/10.0
- DSCR +10.0/10.0
- ARV discount +7.5/15.0
- Schools +4.8/10.0
- Rent growth +2.5/5.0
- Livability +2.5/5.0
- Condition / age +2.5/5.0
- Appreciation +0.0/10.0
$85,000
🖨 Deal sheet 📄 Offer letter ✓ Due diligence
Listing remarks MLS
Opportunity awaits at 4954 Whipple Lake Rd! This 2-bedroom, 1-bath home is ready for a complete renovation and offers endless potential for investors, flippers, or buyers looking to build sweat equity. Property requires significant updates and is being offered as-is. Bring your vision and transform this property into something special. Whether you're looking for your next rehab project or a chance to create a custom retreat, this property offers a blank canvas with plenty of possibilities. Buyer to verify all information and property condition.
Key facts
- 0.41 acre lot
Property features AI
Finance
- Other: Property listed by RE/MAX First
- HOA & community: Has homeowners association
Exterior
- Utilities: Public water; Public sewer
- Home design: Single-family residence; One story
- Construction: Aluminum siding; Slab foundation
- Exterior features: Public maintained road; Lot dimensions approximately 100 x 180; Lot size about 0.41 acres; No pool
Interior
- Bedrooms: Total of 5 rooms (includes bedrooms and living spaces)
- Bathrooms: 1 full bathroom
- Heating & cooling: Ceiling fan(s); Forced air heating (natural gas)
- Interior features: Ceiling fan(s); Forced air heating; Natural gas heating
Neighborhood map
What this means for you Summary
Snapshot
- This is a 2-bed/1.0-bath single-family listed at $85k.
Deal economics
- At list price, monthly cash flow is $974 ($12k/yr) — positive.
- The deal already cash-flows at list — no discount required.
- Meets the 1% rule at list price ($2k rent vs $85k).
Location & tenants
- Location reads: area grade B — affects rentability + tenant quality, not the cash-flow math above.
- Clarkston Community School District (suburban): math 48% / reading 58% proficiency, ranked #69 of 540 in MI (top 13%) — acceptable for families but not a draw, mixed tenant base, ~2y average lease; only 16% free/reduced lunch — higher-income household profile.
- Market conditions: 147 active listings in the ZIP; 1 comparable units currently listed for rent nearby; high-income renter base; 2,614 units permitted in Oakland County in 2024 (721 in 5+ unit buildings).
- This rent is only 18% of the median local income ($129k/yr) — well below the 30% rent-burden line; pricing power to push rent on renewal without tenant pushback.
Forward outlook
- Local home prices are declining (-3.0%/yr); year-one equity from $588 of loan paydown is wiped out by about $3k of value loss. Plan a longer hold.
- Oakland County population projected at +10% by 2050 — modest demand growth; plan on rents tracking national, not racing it.
- At projected returns (-3.0% appreciation + 3.0% rent growth), your $24k cash investment doubles in ~3 years — after that, you're playing with house money.
Negotiation context
- Only 1 days on market — expect competitive offers; lowballing is unlikely to land.
- 2 sale attempts with the ask held roughly flat each time — persistent listings suggest the price (not the market) is what's stuck; bring a comps-based counter.
Questions for the listing agent
- Is there a deadline driving the sale (1031 exchange, divorce, estate, relocation)? That informs how much negotiation room exists.
- What's the average days-on-market for RENTAL listings here right now (not sales)? A rising rental-DOM trend means longer vacancies and softer asking-rent achievability than the comps imply.
- What's the recent tenant-quality profile in this submarket — average credit score on applications, eviction rate, late-payment / NSF rate, and stable-employment percentage? A property-management company in the area should have these aggregated.
- How much new for-sale + rental construction is in the pipeline within 1–3 miles? Heavy new supply typically softens prices + rents 12–24 months out; constrained supply supports both.
Investment metrics
- 1% rule
- 2.28% ✓
- Cap rate
- 20.04%
- Cash-on-cash
- 49.10%
- DSCR
- 3.18
- GRM
- 3.7
CMA / ARV
- ARV (on-the-fly)
- $260,288
- Comps found
- 4
Show comp detail 4 sales within ~0.75 mi
| Address | Dist | Beds/Ba | Sqft | Sold | Price | $/sf | Match |
|---|---|---|---|---|---|---|---|
| 9515 Woodside Dr | 0.45mi | 1/1.0 (-1) | 1,296 (-2%) | 3mo | $59,000 | $46 | 68 |
| 5039 W Princeton Ave | 0.23mi | 3/2.0 (+1) | 1,494 (+12%) | 1mo | $356,000 | $238 | 59 |
| 5177 Mattawa Dr | 0.63mi | 2/1.0 | 1,317 (-1%) | 23mo | $235,000 | $178 | 50 |
| 8990 Woodlawn Ave | 0.59mi | 3/2.0 (+1) | 1,380 (+4%) | 10mo | $270,000 | $196 | 49 |
Match score weights: distance 35% · size 25% · config 20% · recency 20%. Top-matched comps best support the ARV.
Projected returns pro-forma
-3.0% appreciation · 3.0% rent growth · sell at horizon
- IRR
- 46.7%
- Equity multiple
- 3.03×
- Total profit
- $48,260
- Equity at exit
- $12,674
- IRR
- 52.4%
- Equity multiple
- 6.12×
- Total profit
- $121,929
- Equity at exit
- $7,349
Cash invested: $23,800 (down + closing). Projections, not guarantees.
Landlord ↔ Tenant lean methodology
- Overall (STATE)
- 62 Landlord-Friendly
- State Michigan
- 62 Landlord-Friendly · EVEN
- County
- — inherits STATE
- City
- — inherits STATE
ZIP-level market 48348
- Active inventory
- 147
- Price-to-rent
- 3.7×
Monthly cashflow live
- Estimated rent
- $1,937 medium interval (Pro) →
- Mortgage (P&I)
- −$446
- Tax from tax record
- −$75 /mo · $899/yr
- Insurance
- −$35
- HOA
- −$0
- Vacancy / Maint / Mgmt
- −$407
- Net cashflow
- $974
Break-even live
UW: 25.0% down · 7.5% · 30yr · 1.5% tax · 5.0% vac · 8.0% maint · 8.0% mgmt
Financing live
Cash to close
- Down payment
- $21,250
- Closing costs
- $2,550
- Reserves months
- —
- Total cash needed
- —
Loan-product check · same deal, 3 products live
Conventional
25% down · 7.5% · 30yr
- Down + closing
- —
- Monthly P&I
- —
- Monthly cashflow
- —
- DSCR
- —
- Eligible?
- —
Personal DTI + credit; lowest rate.
DSCR
20% down · 8.5% · 30yr
- Down + closing
- —
- Monthly P&I
- —
- Monthly cashflow
- —
- DSCR
- —
- Eligible?
- —
No personal income docs; deal must DSCR.
Hard money
10% down · 12.0% · 12mo
- Down + closing
- —
- Monthly P&I
- —
- Monthly cashflow
- —
- DSCR
- —
- Eligible?
- —
Short-term bridge; refi at stabilization.
Rent comps 1 comps
| Address | Beds | Baths | Sqft | Rent | $/sqft | DOM | Units | Dist |
|---|---|---|---|---|---|---|---|---|
| 4000 Brookside Rd Clarkston, MI | 2.0 | 2.0 | 1672 | $3,032 | $1.81 | 1d | 1 | 1.43mi |
Listing history 2 events
-
2026-06-18remarks 550-char remark
Show marketing remark (550 chars)
Opportunity awaits at 4954 Whipple Lake Rd! This 2-bedroom, 1-bath home is ready for a complete renovation and offers endless potential for investors, flippers, or buyers looking to build sweat equity. Property requires significant updates and is being offered as-is. Bring your vision and transform this property into something special. Whether you're looking for your next rehab project or a chance to create a custom retreat, this property offers a blank canvas with plenty of possibilities. Buyer to verify all information and property condition.
-
2026-06-18$85,000 Active 1 DOM
Show marketing remark (550 chars)
Opportunity awaits at 4954 Whipple Lake Rd! This 2-bedroom, 1-bath home is ready for a complete renovation and offers endless potential for investors, flippers, or buyers looking to build sweat equity. Property requires significant updates and is being offered as-is. Bring your vision and transform this property into something special. Whether you're looking for your next rehab project or a chance to create a custom retreat, this property offers a blank canvas with plenty of possibilities. Buyer to verify all information and property condition.
ⓘ Source: listings_history table (triggers on properties + properties_extension) + one-shot
backfill from property_details.listing_events for pre-trigger history.
Tax reassessment forecast MI · Partial reset (capped growth)
- Current annual tax
- $899 · $75/mo
- Projected year-2 tax
- $1,104 · $92/mo
- Expected delta
- +$205/yr (+$17/mo · 22.8%)
ⓘ Screening estimate from a state-policy table — verify with the county assessor before closing.
Climate risk First Street
- Flood 1/10 Low FEMA zone X (unshaded) · 0% chance over 30 yrs
- Wildfire 1/10 Low
- Heat 2/10 Low 7 d/yr ≥95°F today · 15 d/yr by 30 yrs out
- Wind 2/10 Low
- Air quality 3/10 Moderate 2 unhealthy d/yr today · 4 by 30 yrs out
Nearby sold comps map
Loading sold comps map…
Walkable amenities ~0.75 mi
Loading nearby amenities…
Taxation est. · year 1
- Rental income
- $23,239
- − Mortgage interest
- −$4,761
- − Property taxes
- −$899
- − Insurance
- −$425
- − Repairs & maintenance
- −$1,859
- − Management
- −$1,859
- − Depreciation
- −$2,473
- Taxable income
- $10,963
- Est. tax owed @ 24.0%
- −$2,631
- After-tax cash flow
- $9,055/yr
For passive investors: Depreciation is non-cash, so a rental often shows a tax loss while cash-flowing — sheltering income. Rental losses are passive: they offset passive income freely, and up to $25,000/yr can offset ordinary (W-2) income if you actively participate and your MAGI is under $100k (phasing out to $0 by $150k); unused losses carry forward. On sale, claimed depreciation is recaptured at up to 25%, and gains may owe capital-gains tax (a 1031 exchange can defer both). Figures are a year-1 estimate at your 24.0% rate — not tax advice; consult a CPA.
Schools (NCES district)
- District
- Clarkston Community School District
- NCES district ID
- 2609900
- Math proficiency
- 48% ▼ -8.00%
- Reading proficiency
- 58% ▼ -5.00%
- Median HH income
- $79,317
- Composite
- 48.04/100
- National rank
- #2193
- State rank
- #69 of 540 in MI
Livability — Independence
No livability data for this city. (Only ~50 U.S. cities are tracked.)
Census & demographics
- County
- Oakland County · 1,009,092 people
- Metro
- Detroit-Warren-Dearborn, MI
- Population (ZIP)
- 24,574
- Household income
- $129,410
- Rent vs Own
- Severe rent burden
- 212.0
Population outlook (Oakland County) Hauer SSP2
- Today (2025)
- 1,335,747 people
- By 2030
- 1,375,100 · +2.9%
- By 2040
- 1,435,385 · +7.5%
- By 2050
- 1,469,250 · +10.0%
- By 2075
- 1,531,946 · +14.7%
- By 2100
- 1,450,485 · +8.6%
Race, ethnicity, and origin ACS 2023
- Neighborhood character
- Predominantly White (87%)
- Race & ethnicity
- White 87% Two or more races 6% Hispanic / Latino 5% Black 2% Asian 2%
- Hispanic origin (detail)
- Mexican 2%
- Common ancestry
- Romanian 10% Slovak 4% Lithuanian 3%
- Foreign-born
- 5% · Canada, Vietnam
- Languages at home
- 95% English-only · Spanish 2% French/Haitian/Cajun 1% Other Indo-European 1%
Political lean MEDSL · Oakland
- 2024 margin
- D (+10.6) · D 54.4% · R 43.8% · Other 1.9%
- 2008→2024 swing
- -3.9pp toward R · 2008: 14.5pp · 2024: 10.6pp
- All cycles
- 2024: D+10.6 2020: D+14.1 2016: D+8.1 2012: D+8.1 2008: D+14.5
Not yet ingested
- Civics
- —
Market trends
- HPI YoY
- ▼ -275.65%
- Current HPI
- 196.4302
- Rent YoY
- —
- Metro
- Detroit-Warren-Dearborn, MI
- State GDP YoY
- ▲ 1.37%
- F500 in state
- 28
Industry mix (Fortune 500 HQ in MI)
| Industry | F500 HQs | Revenue |
|---|---|---|
| Automotive Parts | 3 | $48B |
|
||
| Automotive | 2 | $372B |
|
||
| Chemicals | 1 | $45B |
|
||
| Automotive Retail | 1 | $29B |
|
||
| Healthcare / Medical Devices | 1 | $23B |
|
||
| Automotive Technology | 1 | $20B |
|
||
Price history
+0.0% since first listed2 events — show timeline
- 2026-06-18 Listed $85,000 REALCOMP
- 2026-06-18 Listed $85,000 MiRealSource-MiMLS
Property tax history
+2.8%/yrLatest (2025): $899 · +4.2% YoY. Source: county tax records.
Cash-flow waterfall
monthlySold comps — $/sqft
last 12 mo · ≤1 miLoading sold comps…