 🏗️ New Construction
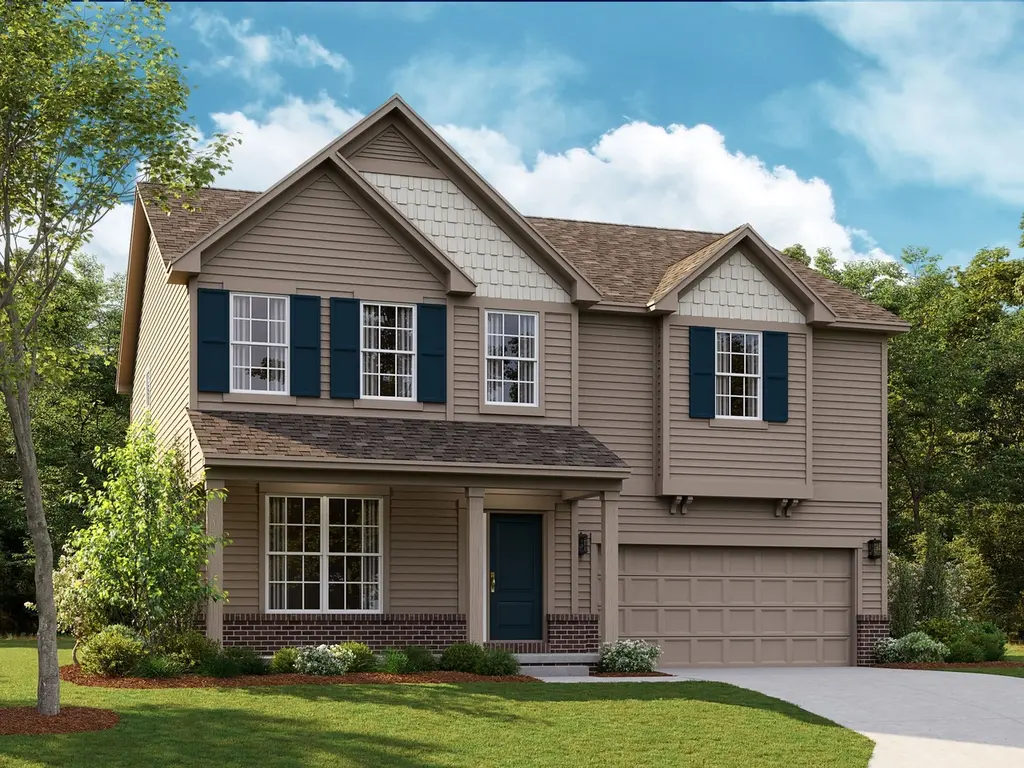
Draper Plan · Saline, MI
Flood risk No data
- FEMA flood zone
- —
- Chance of flooding over 30 yrs
- —
- Est. flood insurance / yr
- —
Fire risk No data
- Est. fire insurance / yr
- —
Heat risk No data
- Hot days now (above threshold)
- —
- Hot days in 30 yrs
- —
Wind risk No data
- Chance of severe wind over 30 yrs
- —
Air-quality risk No data
- Unhealthy air days now
- —
- Unhealthy air days in 30 yrs
- —
Risk factors via First Street. Map © Google.
Why this score? — see what drove the F grade
The composite is a weighted blend of 9 inputs, each scored 0–100. Each bar is that input's sub-score; the figure is the points it added to the 100-point composite (weight × sub-score).
- Cash flow +7.5/30.0
- ARV discount +7.5/15.0
- Schools +5.9/10.0
- Livability +4.0/5.0
- Rent growth +2.5/5.0
- Condition / age +2.5/5.0
- 1% rule +2.2/10.0
- DSCR +1.6/10.0
- Appreciation +0.0/10.0
$487,900
🖨 Deal sheet (PDF) 📄 Offer letter ✓ Due diligence
Listing remarks MLS
Our brand-new Draper floorplan is the one you have been searching for! With 2,589 square feet of living space, this home is truly a hit.
Key facts
- 2 garage spots
- Listed 880 days
Neighborhood map
What this means for you Summary
Snapshot
- This is a 4-bed/2.5-bath single-family listed at $488k.
Deal economics
- At list price, monthly cash flow is $-670 ($-8k/yr) — negative.
- To cash-flow at today's rent, offer at most $442k (9.4% below list).
- To meet the 1% rule (rent ≥ 1% of price), the offer needs to be $387k (20.7% below list).
- Recommended offer: $387k (20.7% below list) — sets the bar for 1% rule.
- Cap rate 4.8% vs local median 2.1% in Saline — top-decile yield for the area; either an underpriced asset or a hidden risk that comps aren't pricing in. Stress-test before assuming the spread holds.
Location & tenants
- Location reads 81/100 on livability (#67 in MI, #1,442 nationally) — a professional / high-income tenant draw. Strengths: housing A+, health & safety A+, employment A; Watch: amenities D, commute F.
- Saline Area Schools (suburban): math 59% / reading 70% proficiency, ranked #20 of 540 in MI (top 4%) — acceptable for families but not a draw, mixed tenant base, ~2y average lease; only 8% free/reduced lunch — higher-income household profile.
- Zoned schools: Pleasant Ridge Elementary School (math 77% / reading 67%, grade A-, #51 of 1,397 statewide, top 5%, 466 students, 16% FRL); Saline Middle School (math 60% / reading 74%, grade A-, #31 of 493 statewide, top 6%, 1,113 students, 16% FRL); Saline High School (math 59% / reading 78%, grade B, #41 of 713 statewide, top 6%, 1,605 students, 12% FRL).
- Market conditions: 228 active listings in the ZIP; 3 comparable units currently listed for rent nearby; rentals at typical pace (median 16d on market — plan ~3-4 weeks tenant-placement turnaround); high-income renter base; 996 units permitted in Washtenaw County in 2024 (492 in 5+ unit buildings).
- This rent runs 41% of the median local income ($114k/yr) — at the standard rent-burdened threshold; future hikes will face affordability resistance.
Forward outlook
- Local home prices are declining (-3.0%/yr); year-one equity from $4k of loan paydown is wiped out by about $16k of value loss. Plan a longer hold.
- Washtenaw County population projected at +25% by 2050 — long-run rental-demand tailwind backs the buy-and-hold thesis.
Negotiation context
- It's been on market 880 days — a 12% lower offer ($429k) is reasonable based on typical stale-listing flexibility.
Questions for the listing agent
- What do current leases actually rent for vs. the listed asking? Can we see a recent rent roll and the last 12 months of T-12 income?
- It's been on market 880 days. Have you received any prior offers? Is the seller open to a 21% concession, seller financing, or rate buy-down credit?
- Why hasn't it sold? Are there any deal-killer items the seller is aware of (foundation, flood, title, zoning, code violations)?
- Is there a deadline driving the sale (1031 exchange, divorce, estate, relocation)? That informs how much negotiation room exists.
- Schools are A-rated — typically a magnet for longer-tenancy family renters. What's the average tenant stay here, and is there a school-zone premium baked into asking?
- The area grade is low — what's the realistic commute time and amenity access for the typical tenant pool here? Any planned neighborhood developments (good or bad) we should know about?
- What's the average days-on-market for RENTAL listings here right now (not sales)? A rising rental-DOM trend means longer vacancies and softer asking-rent achievability than the comps imply.
- What's the recent tenant-quality profile in this submarket — average credit score on applications, eviction rate, late-payment / NSF rate, and stable-employment percentage? A property-management company in the area should have these aggregated.
- How much new for-sale + rental construction is in the pipeline within 1–3 miles? Heavy new supply typically softens prices + rents 12–24 months out; constrained supply supports both.
Investment metrics
- 1% rule
- 0.72% ✗
- Cap rate
- 4.80%
- Cash-on-cash
- -5.33%
- DSCR
- 0.76
- GRM
- 11.6
CMA / ARV
- ARV (median comp)
- $538,942
- List price
- $487,900
- Delta
- -9.47%
- Verdict
- FAIR
- Comps
- 20 within 1.0 mi
Show comp detail 12 sales within ~0.75 mi
| Address | Dist | Beds/Ba | Sqft | Sold | Price | $/sf | Match |
|---|---|---|---|---|---|---|---|
| 27139 Silo Dr | 0.06mi | 4/2.5 | 2,589 (0%) | 2mo | $555,295 | $214 | 95 |
| 27146 Silo Dr | 0.08mi | 4/2.5 | 2,580 (-0%) | 2mo | $557,155 | $216 | 94 |
| 27108 Silo Dr | 0.07mi | 4/2.5 | 2,580 (-0%) | 4mo | $571,410 | $221 | 93 |
| 27107 Gallop Way | 0.08mi | 4/2.5 | 2,589 (0%) | 6mo | $519,900 | $201 | 91 |
| 2794 Gallop Way | 0.03mi | 4/2.5 | 2,450 (-5%) | 0mo | $555,660 | $227 | 90 |
| 27106 Gallop Way | 0.08mi | 4/2.5 | 2,450 (-5%) | 5mo | $508,600 | $208 | 84 |
| 27154 Gallop Way | 0.07mi | 4/2.5 | 2,450 (-5%) | 9mo | $527,635 | $215 | 81 |
| 2739 Salt Springs Dr #39 | 0.29mi | 3/2.5 (-1) | 2,567 (-1%) | 5mo | $520,000 | $203 | 76 |
| 2739 Salt Springs Dr #39 | 0.29mi | 3/2.5 (-1) | 2,567 (-1%) | 5mo | $520,000 | $203 | 76 |
| 2765 Silo Dr | 0.04mi | 4/2.5 | 2,949 (+14%) | 8mo | $634,190 | $215 | 68 |
| 2732 Wheatfield Way | 0.31mi | 3/2.5 (-1) | 2,756 (+6%) | 6mo | $530,000 | $192 | 65 |
| 2736 Salt Springs Dr | 0.33mi | 5/3.5 (+1) | 2,977 (+15%) | 8mo | $525,000 | $176 | 44 |
Match score weights: distance 35% · size 25% · config 20% · recency 20%. Top-matched comps best support the ARV.
Projected returns pro-forma
-3.0% appreciation · 3.0% rent growth · sell at horizon
- IRR
- -25.4%
- Equity multiple
- 0.14×
- Total profit
- $-129,935
- Equity at exit
- $80,358
- IRR
- -21.5%
- Equity multiple
- -0.11×
- Total profit
- $-167,842
- Equity at exit
- $46,598
Cash invested: $150,904 (down + closing). Projections, not guarantees.
Landlord ↔ Tenant lean methodology
- Overall (STATE)
- 62 Landlord-Friendly
- State Michigan
- 62 Landlord-Friendly · EVEN
- County
- — inherits STATE
- City
- — inherits STATE
ZIP-level market 48176
- Active inventory
- 228
- Price-to-rent
- 10.5×
Monthly cashflow live
- Estimated rent
- $3,867 medium interval (Pro) →
- Mortgage (P&I)
- −$2,826
- Tax est. 1.5%
- −$674 /mo · $8,084/yr
- Insurance
- −$225
- HOA
- −$0
- Vacancy / Maint / Mgmt
- −$812
- Net cashflow
- $-670
Break-even live
Sensitivity live
| Price | -10% $-297 | -5% $-484 | +0% $-670 | +5% $-856 | +10% $-1,042 |
|---|---|---|---|---|---|
| Rent | -10% $-975 | -5% $-823 | +0% $-670 | +5% $-517 | +10% $-364 |
| Rate | -1.0pp $-398 | -0.5pp $-533 | base $-670 | +0.5pp $-809 | +1.0pp $-952 |
UW: 25.0% down · 7.5% · 30yr · 1.5% tax · 5.0% vac · 8.0% maint · 8.0% mgmt
Financing live
Cash to close
- Down payment
- $134,735
- Closing costs
- $16,168
- Reserves months
- —
- Total cash needed
- —
Loan-product check · same deal, 3 products live
Conventional
25% down · 7.5% · 30yr
- Down + closing
- —
- Monthly P&I
- —
- Monthly cashflow
- —
- DSCR
- —
- Eligible?
- —
Personal DTI + credit; lowest rate.
DSCR
20% down · 8.5% · 30yr
- Down + closing
- —
- Monthly P&I
- —
- Monthly cashflow
- —
- DSCR
- —
- Eligible?
- —
No personal income docs; deal must DSCR.
Hard money
10% down · 12.0% · 12mo
- Down + closing
- —
- Monthly P&I
- —
- Monthly cashflow
- —
- DSCR
- —
- Eligible?
- —
Short-term bridge; refi at stabilization.
Rent comps 3 comps
| Address | Beds | Baths | Sqft | Rent | $/sqft | DOM | Units | Dist |
|---|---|---|---|---|---|---|---|---|
| 2770 Silo Dr Saline, MI | 3.0 | 2.5 | 1900 | $5,000 | $2.63 | 15d | 1 | 0.06mi |
| 1903 Salt Springs Dr Saline, MI | 3.0 | 2.5 | 1773 | $3,000 | $1.69 | 45d | 1 | 0.48mi |
| 372 Highland Dr Saline, MI | 3.0 | 1.5 | 1853 | $2,450 | $1.32 | 15d | 1 | 1.36mi |
Listing history 29 events
-
2026-06-21days on market $487,900 Active 880 DOM
-
2026-06-18days on market $487,900 Active 877 DOM
-
2026-06-17days on market $487,900 Active 876 DOM
-
2026-06-16days on market $487,900 Active 875 DOM
-
2026-06-15days on market $487,900 Active 874 DOM
-
2026-06-14days on market $487,900 Active 872 DOM
-
2026-06-13days on market $487,900 Active 871 DOM
-
2026-06-10days on market $487,900 Active 869 DOM
-
2026-06-09days on market $487,900 Active 868 DOM
-
2026-06-08days on market $487,900 Active 867 DOM
-
2026-06-07days on market $487,900 Active 866 DOM
-
2026-06-05days on market $487,900 Active 863 DOM
-
2026-06-03days on market $487,900 Active 862 DOM
-
2026-06-02days on market $487,900 Active 861 DOM
-
2026-06-01days on market $487,900 Active 860 DOM
-
2026-05-31days on market $487,900 Active 859 DOM
-
2026-05-30days on market $487,900 Active 858 DOM
-
2026-05-12price $487,900 136-char remark
Show marketing remark (136 chars)
Our brand-new Draper floorplan is the one you have been searching for! With 2,589 square feet of living space, this home is truly a hit.
-
2026-03-31price $486,900 136-char remark
Show marketing remark (136 chars)
Our brand-new Draper floorplan is the one you have been searching for! With 2,589 square feet of living space, this home is truly a hit.
-
2026-01-01price $481,900 136-char remark
Show marketing remark (136 chars)
Our brand-new Draper floorplan is the one you have been searching for! With 2,589 square feet of living space, this home is truly a hit.
-
2025-08-01price $471,900 136-char remark
Show marketing remark (136 chars)
Our brand-new Draper floorplan is the one you have been searching for! With 2,589 square feet of living space, this home is truly a hit.
-
2025-04-22price $469,900 136-char remark
Show marketing remark (136 chars)
Our brand-new Draper floorplan is the one you have been searching for! With 2,589 square feet of living space, this home is truly a hit.
-
2024-10-10price $466,900 136-char remark
Show marketing remark (136 chars)
Our brand-new Draper floorplan is the one you have been searching for! With 2,589 square feet of living space, this home is truly a hit.
-
2024-09-17price $463,900 136-char remark
Show marketing remark (136 chars)
Our brand-new Draper floorplan is the one you have been searching for! With 2,589 square feet of living space, this home is truly a hit.
-
2024-06-25price $460,900 136-char remark
Show marketing remark (136 chars)
Our brand-new Draper floorplan is the one you have been searching for! With 2,589 square feet of living space, this home is truly a hit.
-
2024-03-19price $458,900 136-char remark
Show marketing remark (136 chars)
Our brand-new Draper floorplan is the one you have been searching for! With 2,589 square feet of living space, this home is truly a hit.
-
2024-03-06price $455,900 136-char remark
Show marketing remark (136 chars)
Our brand-new Draper floorplan is the one you have been searching for! With 2,589 square feet of living space, this home is truly a hit.
-
2024-02-16price $452,900 136-char remark
Show marketing remark (136 chars)
Our brand-new Draper floorplan is the one you have been searching for! With 2,589 square feet of living space, this home is truly a hit.
-
2024-01-23$449,900 Active 136-char remark
Show marketing remark (136 chars)
Our brand-new Draper floorplan is the one you have been searching for! With 2,589 square feet of living space, this home is truly a hit.
ⓘ Source: listings_history table (triggers on properties + properties_extension) + one-shot
backfill from property_details.listing_events for pre-trigger history.
Nearby sold comps map
Loading sold comps map…
Walkable amenities ~0.75 mi
Loading nearby amenities…
Taxation est. · year 1
- Rental income
- $46,400
- − Mortgage interest
- −$30,189
- − Property taxes
- −$8,084
- − Insurance
- −$2,695
- − Repairs & maintenance
- −$3,712
- − Management
- −$3,712
- − Depreciation
- −$15,678
- Taxable loss
- −$17,670
- Est. tax savings @ 24.0%
- +$4,241
- After-tax cash flow
- $-3,797/yr
For passive investors: Depreciation is non-cash, so a rental often shows a tax loss while cash-flowing — sheltering income. Rental losses are passive: they offset passive income freely, and up to $25,000/yr can offset ordinary (W-2) income if you actively participate and your MAGI is under $100k (phasing out to $0 by $150k); unused losses carry forward. On sale, claimed depreciation is recaptured at up to 25%, and gains may owe capital-gains tax (a 1031 exchange can defer both). Figures are a year-1 estimate at your 24.0% rate — not tax advice; consult a CPA.
Schools (NCES district)
- District
- Saline Area Schools
- NCES district ID
- 2630660
- Math proficiency
- 59% ▼ -11.00%
- Reading proficiency
- 70% ▼ -2.00%
- Median HH income
- $96,722
- Composite
- 59.23/100
- National rank
- #939
- State rank
- #20 of 540 in MI
Livability — Saline
- Score
- 81/100
- State rank
- #67
- US rank
- #1442
Category grades
Schools grade is shown separately in the Schools card above.
Census & demographics
- County
- Washtenaw County · 306,860 people
- City population
- 23,451
- Metro
- Ann Arbor, MI
- Population (ZIP)
- 23,451
- Household income
- $114,206
- Rent vs Own
- Severe rent burden
- 315.0
Population outlook (Washtenaw County) Hauer SSP2
- Today (2025)
- 402,878 people
- By 2030
- 424,104 · +5.3%
- By 2040
- 464,633 · +15.3%
- By 2050
- 504,728 · +25.3%
- By 2075
- 614,463 · +52.5%
- By 2100
- 676,181 · +67.8%
Race, ethnicity, and origin ACS 2023
- Neighborhood character
- Predominantly White (85%)
- Race & ethnicity
- White 85% Two or more races 6% Hispanic / Latino 5% Asian 3% Black 2%
- Hispanic origin (detail)
- Mexican 3% Puerto Rican 1%
- Common ancestry
- Romanian 8% Lithuanian 3% Iranian 3%
- Foreign-born
- 8% · Canada, China, Vietnam
- Languages at home
- 90% English-only · Other Indo-European 3% Spanish 2% Chinese 1%
Political lean MEDSL · Washtenaw
- 2024 margin
- Solid D (+44.4) · D 71.0% · R 26.6% · Other 2.4%
- 2008→2024 swing
- +3.5pp toward D · 2008: 41.0pp · 2024: 44.4pp
- All cycles
- 2024: D+44.4 2020: D+46.6 2016: D+41.5 2012: D+36.0 2008: D+41.0
Not yet ingested
- Civics
- —
Market trends
- HPI YoY
- ▼ -133.08%
- Current HPI
- 192.5282
- Rent YoY
- —
- Metro
- Ann Arbor, MI
- State GDP YoY
- ▲ 1.37%
- F500 in state
- 28
Industry mix (Fortune 500 HQ in MI)
| Industry | F500 HQs | Revenue |
|---|---|---|
| Automotive Parts | 3 | $48B |
|
||
| Automotive | 2 | $372B |
|
||
| Chemicals | 1 | $45B |
|
||
| Automotive Retail | 1 | $29B |
|
||
| Healthcare / Medical Devices | 1 | $23B |
|
||
| Automotive Technology | 1 | $20B |
|
||
Price history
+8.4% since first listed12 events — show timeline
- 2026-05-12 Price Changed $487,900 Zillow
- 2026-03-31 Price Changed $486,900 Zillow
- 2026-01-01 Price Changed $481,900 Zillow
- 2025-08-01 Price Changed $471,900 Zillow
- 2025-04-22 Price Changed $469,900 Zillow
- 2024-10-10 Price Changed $466,900 Zillow
- 2024-09-17 Price Changed $463,900 Zillow
- 2024-06-25 Price Changed $460,900 Zillow
- 2024-03-19 Price Changed $458,900 Zillow
- 2024-03-06 Price Changed $455,900 Zillow
- 2024-02-16 Price Changed $452,900 Zillow
- 2024-01-23 Listed $449,900 Zillow
Cash-flow waterfall
monthlySold comps — $/sqft
last 12 mo · ≤1 miLoading sold comps…