 Duplex
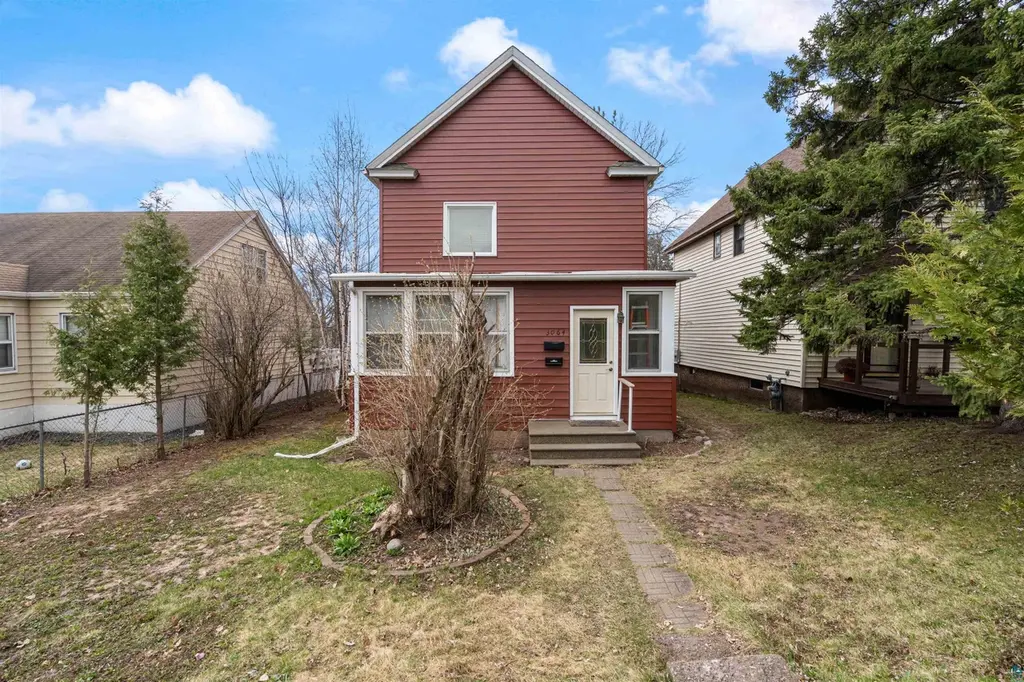
3064 Devonshire St · Duluth, MN
Flood risk 1/10 · Minimal
- FEMA flood zone
- X
- Chance of flooding over 30 yrs
- 0.0%
- Est. flood insurance / yr
- $473 – $860
Fire risk 2/10 · Minimal
- Est. fire insurance / yr
- $888 – $1,650
Heat risk 2/10 · Minimal
- Hot days now (above 90°F)
- 7 days/yr
- Hot days in 30 yrs
- 13 days/yr
Wind risk 1/10 · Minimal
- Chance of severe wind over 30 yrs
- —
Air-quality risk 2/10 · Minimal
- Unhealthy air days now
- 0 days/yr
- Unhealthy air days in 30 yrs
- 1 days/yr
Risk factors via First Street. Map © Google.
Why this score? — see what drove the C+ grade
The composite is a weighted blend of 9 inputs, each scored 0–100. Each bar is that input's sub-score; the figure is the points it added to the 100-point composite (weight × sub-score).
- Cash flow +30.0/30.0
- 1% rule +10.0/10.0
- DSCR +10.0/10.0
- Schools +4.2/10.0
- Livability +4.1/5.0
- Rent growth +2.5/5.0
- Condition / age +2.5/5.0
- ARV discount +0.0/15.0
- Appreciation +0.0/10.0
$240,000
🖨 Deal sheet (PDF) 📄 Offer letter ✓ Due diligence
Multi-family units
County records classify this as Multi-Family (2-4 Unit). Listing-text estimate: 2 units. confirmed
Listing remarks MLS
Same owner for 23 years.W/in the years,interior has been repainted,hdwd floors all redone,new front door,new picture window in front porch,& basement painted.2 bdrms & an enclosed in the main floor unit.Upstairs also has 2 bdrms, kit. & bath, hdwd floors.
Key facts
- New furnace
- Steel siding
- Water heater
Tags
Property features AI
Finance
- Other: Property zoned residential
- Financial info: Unit 1 actual rent: $1,030; Unit 2 actual rent: $930
Exterior
- Parking: Off-street parking
- Utilities: Public water; Public sewer
- Home design: Residential income duplex; 2 stories
- Construction: Steel siding; Stone foundation; Rubber and composition roof; Built area above grade: 1,606 (total for building)
- Exterior features: Exterior lighting; Level to rolling slope lot; Paved city street frontage
Interior
- Kitchen: Range; Refrigerator
- Bedrooms: Unit 1: 2 bedrooms (currently vacant); Unit 2: 2 bedrooms
- Flooring: Hardwood floors
- Bathrooms: Unit 1: 1 bathroom; Unit 2: 1 bathroom
- Heating & cooling: Baseboard heating; Forced air heating; Electric heating
- Interior features: Hardwood floors; Spacious rooms; Lighting (exterior lighting noted under Exterior)
- Laundry & utility: Common area laundry
Neighborhood map
What this means for you Summary
Snapshot
- This is a 2 × 2-bed/1.0-bath units multifamily listed at $240k.
Deal economics
- At list price, monthly cash flow is $1k ($17k/yr) — positive. Per door: $709/mo.
- The deal already cash-flows at list — no discount required.
- Meets the 1% rule at list price ($4k rent vs $240k).
- Recommended offer: $233k (3.0% below list) — sets the bar for market timing.
- Cap rate 13.4% vs local median 4.9% in Duluth — top-decile yield for the area; either an underpriced asset or a hidden risk that comps aren't pricing in. Stress-test before assuming the spread holds.
Location & tenants
- Location reads 82/100 on livability (#36 in MN, #1,060 nationally) — a professional / high-income tenant draw. Strengths: commute A+, cost of living A+, housing A+; Watch: amenities F.
- Duluth Public School District (urban): math 44% / reading 55% proficiency, ranked #132 of 301 in MN (top 44%) — families likely to look elsewhere, expect single-tenant / working-renter base with shorter leases.
- Zoned schools: Piedmont Elementary (math 42% / reading 37%, grade F, #604 of 857 statewide, top 74%, 426 students, 63% FRL); Lincoln Park Middle School (math 26% / reading 39%, grade F, #186 of 258 statewide, top 72%, 524 students, 66% FRL); Denfeld High School (math 32% / reading 42%, grade F, #282 of 471 statewide, top 63%, 940 students, 56% FRL) — zoned schools average 62% FRL vs 39% district-wide (23 pts higher); higher-poverty schools than district average — tighter screening recommended.
- Zoned-school proficiency averages 36% at this address vs 50% district-wide (-13 pts) — the specific schools serving this property underperform the Duluth Public School District average; the district grade overstates school quality for this exact location.
- Market conditions: 45 active listings in the ZIP; 1 comparable units currently listed for rent nearby; lower-income renter base — watch delinquency; 639 units permitted in St. Louis County in 2024 (338 in 5+ unit buildings).
- At $3,772/mo this rent would consume 106% of the median local household income ($43k/yr) (locally 506% of renters already pay >50% of income on rent) — very limited rent-growth headroom before tenants either downsize or default.
Forward outlook
- Local home prices are declining (-3.0%/yr); year-one equity from $2k of loan paydown is wiped out by about $7k of value loss. Plan a longer hold.
- At projected returns (-3.0% appreciation + 3.0% rent growth), your $67k cash investment doubles in ~5 years — after that, you're playing with house money.
Negotiation context
- It's been on market 44 days — a 3% lower offer ($233k) is reasonable based on typical stale-listing flexibility.
- 5 sale attempts since 21y ago with the ask held roughly flat each time — persistent listings suggest the price (not the market) is what's stuck; bring a comps-based counter.
- Current owner paid $104k; list at $240k implies a 131% gain — meaningful room to come down on a strong offer.
Risks & watch-outs
- Watch-outs: built in 1905 — expect roof / HVAC / electrical / plumbing capex.
Questions for the listing agent
- It's been on market 44 days. Have you received any prior offers? Is the seller open to a 3% concession, seller financing, or rate buy-down credit?
- Can we see the unit-by-unit rent roll, current vacancy, and any below-market leases? What's the average tenancy length?
- What capital expenditures (roof, boiler, parking lot, exteriors) have been made in the last 5 years, and what's planned in the next 2?
- Built in 1905 — when were the roof, HVAC, electrical panel, plumbing, and water heater last replaced?
- Is there a deadline driving the sale (1031 exchange, divorce, estate, relocation)? That informs how much negotiation room exists.
- Schools are B-rated — typically a magnet for longer-tenancy family renters. What's the average tenant stay here, and is there a school-zone premium baked into asking?
- What's the average days-on-market for RENTAL listings here right now (not sales)? A rising rental-DOM trend means longer vacancies and softer asking-rent achievability than the comps imply.
- What's the recent tenant-quality profile in this submarket — average credit score on applications, eviction rate, late-payment / NSF rate, and stable-employment percentage? A property-management company in the area should have these aggregated.
- How much new apartment / multifamily construction is in the pipeline within 1–3 miles? Heavy new supply (>2% of stock underway) typically softens rents 12–24 months out; light construction supports rent growth.
Investment metrics
- 1% rule
- 1.57% ✓
- Cap rate
- 13.38%
- Cash-on-cash
- 25.33%
- DSCR
- 2.13
- GRM
- 5.3
CMA / ARV
- ARV (median comp)
- $171,516
- List price
- $240,000
- Delta
- 39.93%
- Verdict
- OVERPRICED
- Comps
- 20 within 1.0 mi
Show comp detail 4 sales within ~0.75 mi
| Address | Dist | Beds/Ba | Sqft | Sold | Price | $/sf | Match |
|---|---|---|---|---|---|---|---|
| 2911 W 3rd St | 0.21mi | 4/2.0 (+1) | 1,600 (-0%) | 8mo | $245,000 | $153 | 78 |
| 3141 Restormel St | 0.07mi | 2/1.0 (-1) | 1,640 (+2%) | 15mo | $1,250 | $1 | 72 |
| 2826 W 3rd St | 0.27mi | 3/2.0 | 1,476 (-8%) | 4mo | $149,900 | $102 | 71 |
| 2619 W 5th St | 0.40mi | 3/2.0 | 1,652 (+3%) | 21mo | $150,000 | $91 | 59 |
Match score weights: distance 35% · size 25% · config 20% · recency 20%. Top-matched comps best support the ARV.
Projected returns pro-forma
-3.0% appreciation · 3.0% rent growth · sell at horizon
- IRR
- 18.9%
- Equity multiple
- 1.77×
- Total profit
- $51,439
- Equity at exit
- $35,785
- IRR
- 27.2%
- Equity multiple
- 3.40×
- Total profit
- $161,098
- Equity at exit
- $20,751
Cash invested: $67,200 (down + closing). Projections, not guarantees.
Landlord ↔ Tenant lean methodology
- Overall (STATE)
- 46 Balanced
- State Minnesota
- 46 Balanced · D+2
- County
- — inherits STATE
- City
- — inherits STATE
ZIP-level market 55806
- Active inventory
- 45
- Price-to-rent
- 10.6×
Monthly cashflow live
- Estimated rent
- $3,772 medium interval (Pro) →
- Mortgage (P&I)
- −$1,259
- Tax from tax record
- −$203 /mo · $2,436/yr
- Insurance
- −$100
- HOA
- −$0
- Vacancy / Maint / Mgmt
- −$792
- Net cashflow
- $1,418
Break-even live
Sensitivity live
| Price | -10% $1,554 | -5% $1,486 | +0% $1,418 | +5% $1,350 | +10% $1,282 |
|---|---|---|---|---|---|
| Rent | -10% $1,120 | -5% $1,269 | +0% $1,418 | +5% $1,567 | +10% $1,716 |
| Rate | -1.0pp $1,539 | -0.5pp $1,479 | base $1,418 | +0.5pp $1,356 | +1.0pp $1,293 |
2-unit breakdown (identical units grouped — click to expand)
| Units | Beds | Baths | Est. rent |
|---|---|---|---|
| 2× units | 2 | 1 | $3,772 |
| #1 | 2 | 1 | $1,886 |
| #2 | 2 | 1 | $1,886 |
| Total (2 units) | $3,772 | ||
UW: 25.0% down · 7.5% · 30yr · 1.5% tax · 5.0% vac · 8.0% maint · 8.0% mgmt
Financing live
Cash to close
- Down payment
- $60,000
- Closing costs
- $7,200
- Reserves months
- —
- Total cash needed
- —
Loan-product check · same deal, 3 products live
Conventional
25% down · 7.5% · 30yr
- Down + closing
- —
- Monthly P&I
- —
- Monthly cashflow
- —
- DSCR
- —
- Eligible?
- —
Personal DTI + credit; lowest rate.
DSCR
20% down · 8.5% · 30yr
- Down + closing
- —
- Monthly P&I
- —
- Monthly cashflow
- —
- DSCR
- —
- Eligible?
- —
No personal income docs; deal must DSCR.
Hard money
10% down · 12.0% · 12mo
- Down + closing
- —
- Monthly P&I
- —
- Monthly cashflow
- —
- DSCR
- —
- Eligible?
- —
Short-term bridge; refi at stabilization.
Rent comps 1 comps
| Address | Beds | Baths | Sqft | Rent | $/sqft | DOM | Units | Dist |
|---|---|---|---|---|---|---|---|---|
| 2302 Hillcrest Dr Duluth, MN | 3.0 | 1.5 | 1072 | $3,500 | $3.26 | 45d | 1 | 1.27mi |
Listing history 29 events
-
2026-06-21days on market $240,000 Active 44 DOM
-
2026-06-19days on market $240,000 Active 42 DOM
-
2026-06-18days on market $240,000 Active 41 DOM
-
2026-06-17days on market $240,000 Active 40 DOM
-
2026-06-16days on market $240,000 Active 39 DOM
-
2026-06-15days on market $240,000 Active 38 DOM
-
2026-06-14pricedays on market $240,000 Active 36 DOM
-
2026-06-13days on market $250,000 Active 35 DOM
-
2026-06-10days on market $250,000 Active 33 DOM
-
2026-06-09days on market $250,000 Active 32 DOM
-
2026-06-08days on market $250,000 Active 31 DOM
-
2026-06-07days on market $250,000 Active 30 DOM
-
2026-06-05days on market $250,000 Active 27 DOM
-
2026-06-03days on market $250,000 Active 26 DOM
-
2026-06-02days on market $250,000 Active 25 DOM
-
2026-06-01days on market $250,000 Active 24 DOM
-
2026-05-31days on market $250,000 Active 23 DOM
-
2026-05-30days on market $250,000 Active 22 DOM
-
2026-05-08$250,000 Active 983-char remark
-
2010-04-16soldstatus $104,000
-
2010-03-30soldstatus $104,000 267-char remark
Show marketing remark (255 chars)
Same owner for 23 years. Within the years, interior has been repainted, hardwood floors all redone, new front door, new picture window in front porch, and basement painted. 2 bedrooms and an enclosed in the main floor unit, eat-in kitchen and updated bath
-
2010-03-30soldstatus $104,000
Show marketing remark (255 chars)
Same owner for 23 years. Within the years, interior has been repainted, hardwood floors all redone, new front door, new picture window in front porch, and basement painted. 2 bedrooms and an enclosed in the main floor unit, eat-in kitchen and updated bath
-
2010-02-25historical 267-char remark
Show marketing remark (267 chars)
Same owner for 23 years.W/in the years,interior has been repainted,hdwd floors all redone,new front door,new picture window in front porch,& basement painted.2 bdrms & an enclosed in the main floor unit.Upstairs also has 2 bdrms, kit. & bath, hdwd floors.
-
2009-12-31$105,000
Show marketing remark (267 chars)
Same owner for 23 years.W/in the years,interior has been repainted,hdwd floors all redone,new front door,new picture window in front porch,& basement painted.2 bdrms & an enclosed in the main floor unit.Upstairs also has 2 bdrms, kit. & bath, hdwd floors.
-
2009-12-31$105,000 267-char remark
Show marketing remark (267 chars)
Same owner for 23 years.W/in the years,interior has been repainted,hdwd floors all redone,new front door,new picture window in front porch,& basement painted.2 bdrms & an enclosed in the main floor unit.Upstairs also has 2 bdrms, kit. & bath, hdwd floors.
-
2006-03-20historical
-
2006-03-16$119,900
-
2005-12-10historical
-
2005-08-10$119,900
ⓘ Source: listings_history table (triggers on properties + properties_extension) + one-shot
backfill from property_details.listing_events for pre-trigger history.
Tax reassessment forecast MN · Partial reset (capped growth)
- Current annual tax
- $2,436 · $203/mo
- Projected year-2 tax
- $2,562 · $214/mo
- Expected delta
- +$126/yr (+$10/mo · 5.2%)
ⓘ Screening estimate from a state-policy table — verify with the county assessor before closing.
Climate risk First Street
- Flood 1/10 Low FEMA zone X · 0% chance over 30 yrs
- Wildfire 2/10 Low
- Heat 2/10 Low 7 d/yr ≥90°F today · 13 d/yr by 30 yrs out
- Wind 1/10 Low
- Air quality 2/10 Low 0 unhealthy d/yr today · 1 by 30 yrs out
Nearby sold comps map
Loading sold comps map…
Walkable amenities ~0.75 mi
Loading nearby amenities…
Taxation est. · year 1
- Rental income
- $45,264
- − Mortgage interest
- −$13,444
- − Property taxes
- −$2,436
- − Insurance
- −$1,200
- − Repairs & maintenance
- −$3,621
- − Management
- −$3,621
- − Depreciation
- −$6,982
- Taxable income
- $13,960
- Est. tax owed @ 24.0%
- −$3,350
- After-tax cash flow
- $13,669/yr
For passive investors: Depreciation is non-cash, so a rental often shows a tax loss while cash-flowing — sheltering income. Rental losses are passive: they offset passive income freely, and up to $25,000/yr can offset ordinary (W-2) income if you actively participate and your MAGI is under $100k (phasing out to $0 by $150k); unused losses carry forward. On sale, claimed depreciation is recaptured at up to 25%, and gains may owe capital-gains tax (a 1031 exchange can defer both). Figures are a year-1 estimate at your 24.0% rate — not tax advice; consult a CPA.
Schools (NCES district)
- District
- Duluth Public School District
- NCES district ID
- 2711040
- Math proficiency
- 44% ▼ -10.00%
- Reading proficiency
- 55% ▼ -6.00%
- Median HH income
- $45,692
- Composite
- 41.92/100
- National rank
- #3360
- State rank
- #132 of 301 in MN
Livability — Duluth
- Score
- 82/100
- State rank
- #36
- US rank
- #1060
Category grades
Schools grade is shown separately in the Schools card above.
Census & demographics
- Census place
- Duluth, MN
- County
- Saint Louis County · 115,152 people
- City population
- 71,097
- Metro
- Duluth, MN-WI
- Population (ZIP)
- 9,356
- Household income
- $42,833
- Rent vs Own
- Severe rent burden
- 506.0
Population outlook (St. Louis County) Hauer SSP2
- Today (2025)
- 202,411 people
- By 2030
- 203,234 · +0.4%
- By 2040
- 202,520 · +0.1%
- By 2050
- 200,853 · -0.8%
- By 2075
- 200,943 · -0.7%
- By 2100
- 192,058 · -5.1%
Race, ethnicity, and origin ACS 2023
- Neighborhood character
- Predominantly White (79%)
- Race & ethnicity
- White 79% Two or more races 7% Black 7% Native American 5% Hispanic / Latino 3% Asian 1%
- Common ancestry
- Portuguese 10% Romanian 5% Scottish 2%
- Foreign-born
- 4% · Canada, China
- Languages at home
- 93% English-only · Other Indo-European 2% Spanish 2% Chinese 1%
Political lean MEDSL · St. Louis
- 2024 margin
- D (+13.7) · D 55.9% · R 42.2% · Other 1.8%
- 2008→2024 swing
- -18.8pp toward R · 2008: 32.5pp · 2024: 13.7pp
- All cycles
- 2024: D+13.7 2020: D+15.6 2016: D+11.8 2012: D+29.6 2008: D+32.5
Not yet ingested
- Civics
- —
Market trends
- HPI YoY
- ▼ -122.85%
- Current HPI
- 195.9805
- Rent YoY
- —
- Metro
- Duluth, MN-WI
- State GDP YoY
- ▲ 2.41%
- F500 in state
- 34
Industry mix (Fortune 500 HQ in MN)
| Industry | F500 HQs | Revenue |
|---|---|---|
| Healthcare | 2 | $407B |
|
||
| Retail | 2 | $150B |
|
||
| Consumer Goods | 2 | $32B |
|
||
| Industrial Machinery | 2 | $6B |
|
||
| Agriculture | 1 | $40B |
|
||
| Healthcare / Medical Devices | 1 | $32B |
|
||
Price history
+100.2% since first listed12 events — show timeline
- 2026-06-13 Price Changed $240,000 LSAR
- 2026-05-08 Listed $250,000 LSAR
- 2010-04-16 Sold (Public Records) $104,000 Public Records
- 2010-03-30 Sold (MLS) $104,000 NORTHSTARMLS as Distributed by MLS Grid
- 2010-03-30 Sold (MLS) $104,000 NORTHSTARMLS as Distributed by MLS Grid
- 2010-02-25 Listing Removed — NORTHSTARMLS as Distributed by MLS Grid
- 2009-12-31 Listed $105,000 NORTHSTARMLS as Distributed by MLS Grid
- 2009-12-31 Listed $105,000 NORTHSTARMLS as Distributed by MLS Grid
- 2006-03-20 Listing Removed — NORTHSTARMLS as Distributed by MLS Grid
- 2006-03-16 Listed $119,900 NORTHSTARMLS as Distributed by MLS Grid
- 2005-12-10 Listing Removed — NORTHSTARMLS as Distributed by MLS Grid
- 2005-08-10 Listed $119,900 NORTHSTARMLS as Distributed by MLS Grid
Property tax history
+6.4%/yrLatest (2026): $2,436 · +14.0% YoY. Source: county tax records.
Cash-flow waterfall
monthlySold comps — $/sqft
last 12 mo · ≤1 miLoading sold comps…