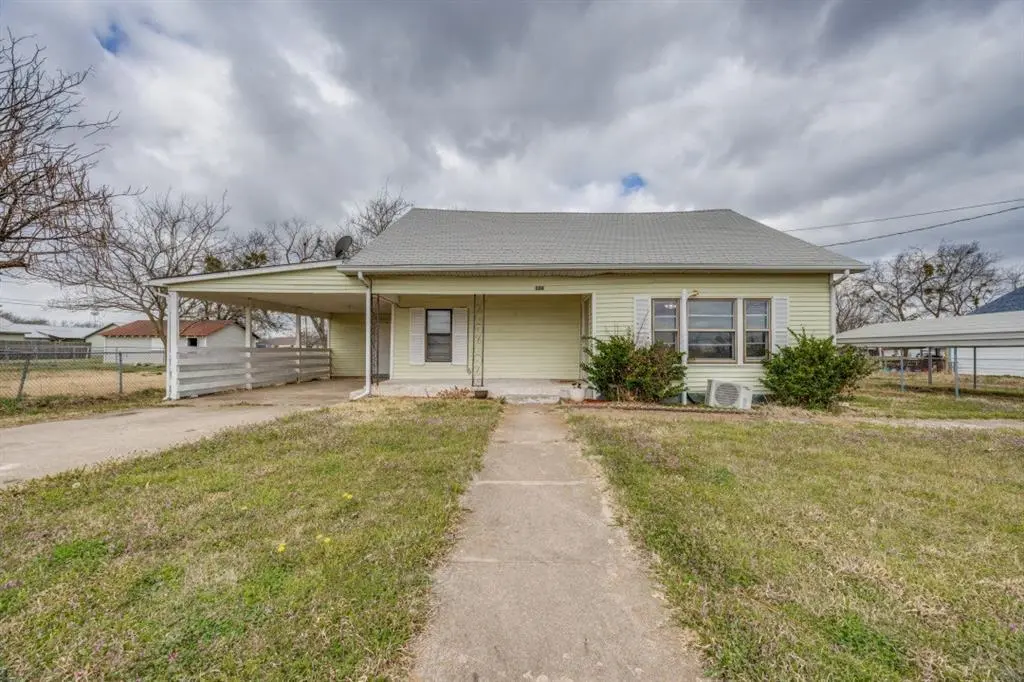
308 N Bois D Arc St · Savoy, TX
Flood risk 1/10 · Minimal
- FEMA flood zone
- X (unshaded)
- Chance of flooding over 30 yrs
- 0.0%
- Est. flood insurance / yr
- $507 – $1,088
Fire risk 7/10 · Major
- Est. fire insurance / yr
- $1,222 – $2,270
Heat risk 7/10 · Major
- Hot days now (above 109°F)
- 7 days/yr
- Hot days in 30 yrs
- 22 days/yr
Wind risk 5/10 · Moderate
- Chance of severe wind over 30 yrs
- 26.0%
Air-quality risk 2/10 · Minimal
- Unhealthy air days now
- 1 days/yr
- Unhealthy air days in 30 yrs
- 2 days/yr
Risk factors via First Street. Map © Google.
Why this score? — see what drove the C- grade
The composite is a weighted blend of 9 inputs, each scored 0–100. Each bar is that input's sub-score; the figure is the points it added to the 100-point composite (weight × sub-score).
- ARV discount +13.9/15.0
- Cash flow +11.6/30.0
- Appreciation +5.9/10.0
- Schools +4.4/10.0
- DSCR +3.4/10.0
- Livability +3.2/5.0
- 1% rule +3.1/10.0
- Rent growth +2.5/5.0
- Condition / age +2.5/5.0
$149,000
🖨 Deal sheet (PDF) 📄 Offer letter ✓ Due diligence
Listing remarks MLS
Welcome home to this inviting 3 bedroom, 1 bath residence nestled in the heart of a quiet small town. This older home blends character and comfort. The living room is enhanced with a mini-split unit for efficient cooling. Additional window units throughout the home offer flexibility and convenience. Each bedroom offers comfortable space with natural light. This home is move in ready while still leaving room for your personal style. Enjoy being in a slower pace of small town living with easy access to Bonham or Sherman. Perfect for 1st time buyers, downsizers or investors looking for a solid property with charm and potential.
Key facts
- Easy access
- Window units
- Natural light
Tags
Neighborhood map
What this means for you Summary
Snapshot
- This is a 3-bed/1.0-bath single-family listed at $149k.
Deal economics
- At list price, monthly cash flow is $-45 ($-543/yr) — negative.
- To cash-flow at today's rent, offer at most $141k (5.4% below list).
- To meet the 1% rule (rent ≥ 1% of price), the offer needs to be $120k (19.5% below list).
- Recommended offer: $120k (19.5% below list) — sets the bar for 1% rule.
Location & tenants
- Location reads 63/100 on livability (#870 in TX) — a middle-class / working-renter tenant base. Strengths: crime A+, cost of living A+, housing A+; Watch: employment C-, amenities F, commute F.
- Savoy ISD (rural): math 45% / reading 55% proficiency, ranked #372 of 1,141 in TX (top 33%) — acceptable for families but not a draw, mixed tenant base, ~2y average lease.
- Zoned schools: Savoy El (math 47% / reading 52%, grade D, #865 of 4,322 statewide, top 21%, 187 students, 59% FRL); Savoy H S (math 32% / reading 57%, grade F, #652 of 1,632 statewide, top 43%, 132 students, 54% FRL).
- Market conditions: 33 active listings in the ZIP; 1 comparable units currently listed for rent nearby; 82 units permitted in Fannin County in 2024 (0 in 5+ unit buildings).
Forward outlook
- In year one you build about $4k of equity ($1k loan paydown + $3k appreciation (1.8% local appreciation)).
- Fannin County population projected to shrink 6% by 2050 — rents likely to lag national; underwrite the cash flow, not the appreciation.
- At projected returns (1.8% appreciation + 3.0% rent growth), your $42k cash investment doubles in ~9 years — after that, you're playing with house money.
- By year 9, paydown + projected appreciation supports a ~$32k cash-out refi (75% LTV) — recoverable capital for the next deal without selling this one.
Negotiation context
- It's been on market 109 days — a 9% lower offer ($136k) is reasonable based on typical stale-listing flexibility.
- 4 sale attempts since 5y ago; this cycle's ask has dropped $16k (10%) from the opening price — seller is motivated, your offer sets the floor, not the list.
Risks & watch-outs
- Watch-outs: built in 1950 — expect roof / HVAC / electrical / plumbing capex.
- Climate carrying-cost: moderate wind risk, 26% chance of damaging wind over 30y; major wildfire risk; extreme-heat days projected 7→22/yr by 2055 (HVAC capex compounding) — expect insurance premiums to compound above CPI over the hold.
Questions for the listing agent
- What do current leases actually rent for vs. the listed asking? Can we see a recent rent roll and the last 12 months of T-12 income?
- It's been on market 109 days. Have you received any prior offers? Is the seller open to a 19% concession, seller financing, or rate buy-down credit?
- Built in 1950 — when were the roof, HVAC, electrical panel, plumbing, and water heater last replaced?
- Why hasn't it sold? Are there any deal-killer items the seller is aware of (foundation, flood, title, zoning, code violations)?
- Is there a deadline driving the sale (1031 exchange, divorce, estate, relocation)? That informs how much negotiation room exists.
- What's the average days-on-market for RENTAL listings here right now (not sales)? A rising rental-DOM trend means longer vacancies and softer asking-rent achievability than the comps imply.
- What's the recent tenant-quality profile in this submarket — average credit score on applications, eviction rate, late-payment / NSF rate, and stable-employment percentage? A property-management company in the area should have these aggregated.
- How much new for-sale + rental construction is in the pipeline within 1–3 miles? Heavy new supply typically softens prices + rents 12–24 months out; constrained supply supports both.
Investment metrics
- 1% rule
- 0.81% ✗
- Cap rate
- 5.93%
- Cash-on-cash
- -1.30%
- DSCR
- 0.94
- GRM
- 10.3
CMA / ARV
- ARV (median comp)
- $173,868
- List price
- $149,000
- Delta
- -14.30%
- Verdict
- UNDERPRICED
- Comps
- 20 within 1.0 mi
Show comp detail 8 sales within ~0.75 mi
| Address | Dist | Beds/Ba | Sqft | Sold | Price | $/sf | Match |
|---|---|---|---|---|---|---|---|
| 302 N Commerce St | 0.07mi | 2/2.0 (-1) | 1,372 (+10%) | 4mo | $133,500 | $97 | 68 |
| 202 W Whitewright Rd | 0.62mi | 3/2.0 | 1,200 (-4%) | 3mo | $219,900 | $183 | 58 |
| 210 S Vine St | 0.45mi | 2/1.0 (-1) | 1,155 (-7%) | 6mo | $149,000 | $129 | 57 |
| 304 W Carter St | 0.50mi | 2/1.0 (-1) | 1,184 (-5%) | 13mo | $150,000 | $127 | 53 |
| 100 Butler St | 0.23mi | 3/2.0 | 1,409 (+13%) | 20mo | $285,000 | $202 | 47 |
| 402 W Carter St | 0.61mi | 3/2.0 | 1,176 (-6%) | 14mo | $145,000 | $123 | 46 |
| 309 S Water St | 0.48mi | 3/1.0 | 1,078 (-13%) | 15mo | $155,000 | $144 | 43 |
| 106 S Cedar St | 0.46mi | 3/1.0 | 1,092 (-12%) | 20mo | $149,900 | $137 | 42 |
Match score weights: distance 35% · size 25% · config 20% · recency 20%. Top-matched comps best support the ARV.
Projected returns pro-forma
1.79% appreciation · 3.0% rent growth · sell at horizon
- IRR
- 2.6%
- Equity multiple
- 1.14×
- Total profit
- $5,751
- Equity at exit
- $57,088
- IRR
- 6.6%
- Equity multiple
- 1.88×
- Total profit
- $36,708
- Equity at exit
- $80,935
Cash invested: $41,720 (down + closing). Projections, not guarantees.
Landlord ↔ Tenant lean methodology
- Overall (STATE)
- 87 Strongly Landlord-Friendly
- State Texas
- 87 Strongly Landlord-Friendly · R+5
- County
- — inherits STATE
- City
- — inherits STATE
ZIP-level market 75479
- Home prices YoY
- 0.7%
- Active inventory
- 33
- Price-to-rent
- 10.3×
Monthly cashflow live
- Estimated rent
- $1,200 medium interval (Pro) →
- Mortgage (P&I)
- −$781
- Tax from tax record
- −$150 /mo · $1,797/yr
- Insurance
- −$62
- HOA
- −$0
- Vacancy / Maint / Mgmt
- −$252
- Net cashflow
- $-45
Break-even live
Sensitivity live
| Price | -10% $39 | -5% $-3 | +0% $-45 | +5% $-87 | +10% $-130 |
|---|---|---|---|---|---|
| Rent | -10% $-140 | -5% $-93 | +0% $-45 | +5% $2 | +10% $50 |
| Rate | -1.0pp $30 | -0.5pp $-7 | base $-45 | +0.5pp $-84 | +1.0pp $-123 |
UW: 25.0% down · 7.5% · 30yr · 1.5% tax · 5.0% vac · 8.0% maint · 8.0% mgmt
Financing live
Cash to close
- Down payment
- $37,250
- Closing costs
- $4,470
- Reserves months
- —
- Total cash needed
- —
Loan-product check · same deal, 3 products live
Conventional
25% down · 7.5% · 30yr
- Down + closing
- —
- Monthly P&I
- —
- Monthly cashflow
- —
- DSCR
- —
- Eligible?
- —
Personal DTI + credit; lowest rate.
DSCR
20% down · 8.5% · 30yr
- Down + closing
- —
- Monthly P&I
- —
- Monthly cashflow
- —
- DSCR
- —
- Eligible?
- —
No personal income docs; deal must DSCR.
Hard money
10% down · 12.0% · 12mo
- Down + closing
- —
- Monthly P&I
- —
- Monthly cashflow
- —
- DSCR
- —
- Eligible?
- —
Short-term bridge; refi at stabilization.
Rent comps 1 comps
| Address | Beds | Baths | Sqft | Rent | $/sqft | DOM | Units | Dist |
|---|---|---|---|---|---|---|---|---|
| 12600 U.S. 82 Unit 1 Savoy, TX | 2.0 | 1.0 | 1300 | $1,200 | $0.92 | 22d | 1 | 1.42mi |
Listing history 30 events
-
2026-06-21days on market $149,000 Active 109 DOM
-
2026-06-19days on market $149,000 Active 107 DOM
-
2026-06-18days on market $149,000 Active 106 DOM
-
2026-06-17days on market $149,000 Active 105 DOM
-
2026-06-16days on market $149,000 Active 104 DOM
-
2026-06-15days on market $149,000 Active 103 DOM
-
2026-06-14days on market $149,000 Active 101 DOM
-
2026-06-12days on market $149,000 Active 100 DOM
-
2026-06-09days on market $149,000 Active 97 DOM
-
2026-06-08days on market $149,000 Active 96 DOM
-
2026-06-07days on market $149,000 Active 95 DOM
-
2026-06-05days on market $149,000 Active 93 DOM
-
2026-06-04pricedays on market $149,000 Active 91 DOM
-
2026-06-02days on market $155,000 Active 90 DOM
-
2026-06-01days on market $155,000 Active 89 DOM
-
2026-05-31days on market $155,000 Active 88 DOM
-
2026-05-31days on market $155,000 Active 87 DOM
-
2026-04-19price $155,000 639-char remark
Show marketing remark (639 chars)
Welcome home to this inviting 3 bedroom, 1 bath residence nestled in the heart of a quiet small town. This older home blends character and comfort. The living room is enhanced with a mini-split unit for efficient cooling. Additional window units throughout the home offer flexibility and convenience. Each bedroom offers comfortable space with natural light. This home is move in ready while still leaving room for your personal style. Enjoy being in a slower pace of small town living with easy access to Bonham or Sherman. Perfect for 1st time buyers, downsizers or investors looking for a solid property with charm and potential.
-
2026-03-01$165,000 Active 639-char remark
Show marketing remark (639 chars)
Welcome home to this inviting 3 bedroom, 1 bath residence nestled in the heart of a quiet small town. This older home blends character and comfort. The living room is enhanced with a mini-split unit for efficient cooling. Additional window units throughout the home offer flexibility and convenience. Each bedroom offers comfortable space with natural light. This home is move in ready while still leaving room for your personal style. Enjoy being in a slower pace of small town living with easy access to Bonham or Sherman. Perfect for 1st time buyers, downsizers or investors looking for a solid property with charm and potential.
-
2025-12-10historical
-
2025-06-24price $164,500
-
2025-06-09$174,500 Active
-
2021-10-26soldstatus
-
2021-10-22soldstatus Sold
-
2021-09-11status Pending
-
2021-09-09status Active
-
2021-08-31historical Active Option Contract
-
2021-08-27$118,000 Active
-
2021-03-30soldstatus
-
1999-03-03soldstatus
ⓘ Source: listings_history table (triggers on properties + properties_extension) + one-shot
backfill from property_details.listing_events for pre-trigger history.
Tax reassessment forecast TX · Resets to sale price
- Current annual tax
- $1,797 · $150/mo
- Projected year-2 tax
- $2,727 · $227/mo
- Expected delta
- +$930/yr (+$77/mo · 51.7%)
ⓘ Screening estimate from a state-policy table — verify with the county assessor before closing.
Climate risk First Street
- Flood 1/10 Low FEMA zone X (unshaded) · 0% chance over 30 yrs
- Wildfire 7/10 Severe
- Heat 7/10 Severe 7 d/yr ≥109°F today · 22 d/yr by 30 yrs out
- Wind 5/10 Major 26% chance of damaging wind over 30 yrs
- Air quality 2/10 Low 1 unhealthy d/yr today · 2 by 30 yrs out
Nearby sold comps map
Loading sold comps map…
Walkable amenities ~0.75 mi
Loading nearby amenities…
Taxation est. · year 1
- Rental income
- $14,400
- − Mortgage interest
- −$8,346
- − Property taxes
- −$1,797
- − Insurance
- −$745
- − Repairs & maintenance
- −$1,152
- − Management
- −$1,152
- − Depreciation
- −$4,335
- Taxable loss
- −$3,127
- Est. tax savings @ 24.0%
- +$750
- After-tax cash flow
- $208/yr
For passive investors: Depreciation is non-cash, so a rental often shows a tax loss while cash-flowing — sheltering income. Rental losses are passive: they offset passive income freely, and up to $25,000/yr can offset ordinary (W-2) income if you actively participate and your MAGI is under $100k (phasing out to $0 by $150k); unused losses carry forward. On sale, claimed depreciation is recaptured at up to 25%, and gains may owe capital-gains tax (a 1031 exchange can defer both). Figures are a year-1 estimate at your 24.0% rate — not tax advice; consult a CPA.
Schools (NCES district)
- District
- Savoy ISD
- NCES district ID
- 4839450
- Math proficiency
- 45% ▲ 10.00%
- Reading proficiency
- 55% ▲ 5.00%
- Median HH income
- $45,326
- Composite
- 44.34/100
- National rank
- #6144
- State rank
- #372 of 1141 in TX
Livability — Savoy
- Score
- 63/100
- State rank
- #870
- US rank
- #15697
Category grades
Schools grade is shown separately in the Schools card above.
Census & demographics
- Census place
- Savoy, TX
- Population (ZIP)
- 2,090
Population outlook (Fannin County) Hauer SSP2
- Today (2025)
- 33,423 people
- By 2030
- 33,035 · -1.2%
- By 2040
- 32,250 · -3.5%
- By 2050
- 31,462 · -5.9%
- By 2075
- 29,447 · -11.9%
- By 2100
- 25,459 · -23.8%
Race, ethnicity, and origin ACS 2023
- Neighborhood character
- Predominantly White (82%)
- Race & ethnicity
- White 82% Hispanic / Latino 9% Two or more races 5% Asian 2% Black 1%
- Hispanic origin (detail)
- Mexican 2%
- Common ancestry
- Iranian 1% Slovak 1% Lithuanian 1%
- Foreign-born
- 3% · Canada, China
- Languages at home
- 97% English-only · Spanish 1%
Political lean MEDSL · Fannin
- 2024 margin
- Solid R (+67.4) · D 15.9% · R 83.3%
- 2008→2024 swing
- -27.8pp toward R · 2008: -39.6pp · 2024: -67.4pp
- All cycles
- 2024: R+67.4 2020: R+63.4 2016: R+61.9 2012: R+52.5 2008: R+39.6
Not yet ingested
- Civics
- —
Market trends
- HPI YoY
- ▲ 1.79%
- Current HPI
- 246.6145
- Rent YoY
- —
- Metro
- —
- State GDP YoY
- ▲ 3.95%
- F500 in state
- 110
Industry mix (Fortune 500 HQ in TX)
| Industry | F500 HQs | Revenue |
|---|---|---|
| Energy | 16 | $1,198B |
|
||
| Technology | 5 | $198B |
|
||
| Engineering / Construction | 4 | $72B |
|
||
| Energy Services | 3 | $60B |
|
||
| Utilities | 3 | $41B |
|
||
| Healthcare | 2 | $330B |
|
||
Price history
+31.4% since first listed13 events — show timeline
- 2026-04-19 Price Changed $155,000 NTREIS
- 2026-03-01 Listed $165,000 NTREIS
- 2025-12-10 Listing Removed — NTREIS
- 2025-06-24 Price Changed $164,500 NTREIS
- 2025-06-09 Listed $174,500 NTREIS
- 2021-10-26 Sold (Public Records) — Public Records
- 2021-10-22 Sold (MLS) — NTREIS
- 2021-09-11 Pending — NTREIS
- 2021-09-09 Relisted — NTREIS
- 2021-08-31 Contingent — NTREIS
- 2021-08-27 Listed $118,000 NTREIS
- 2021-03-30 Sold (Public Records) — Public Records
- 1999-03-03 Sold (Public Records) — Public Records
Property tax history
+6.3%/yrLatest (2025): $1,797 · -5.5% YoY. Source: county tax records.
Cash-flow waterfall
monthlySold comps — $/sqft
last 12 mo · ≤1 miLoading sold comps…