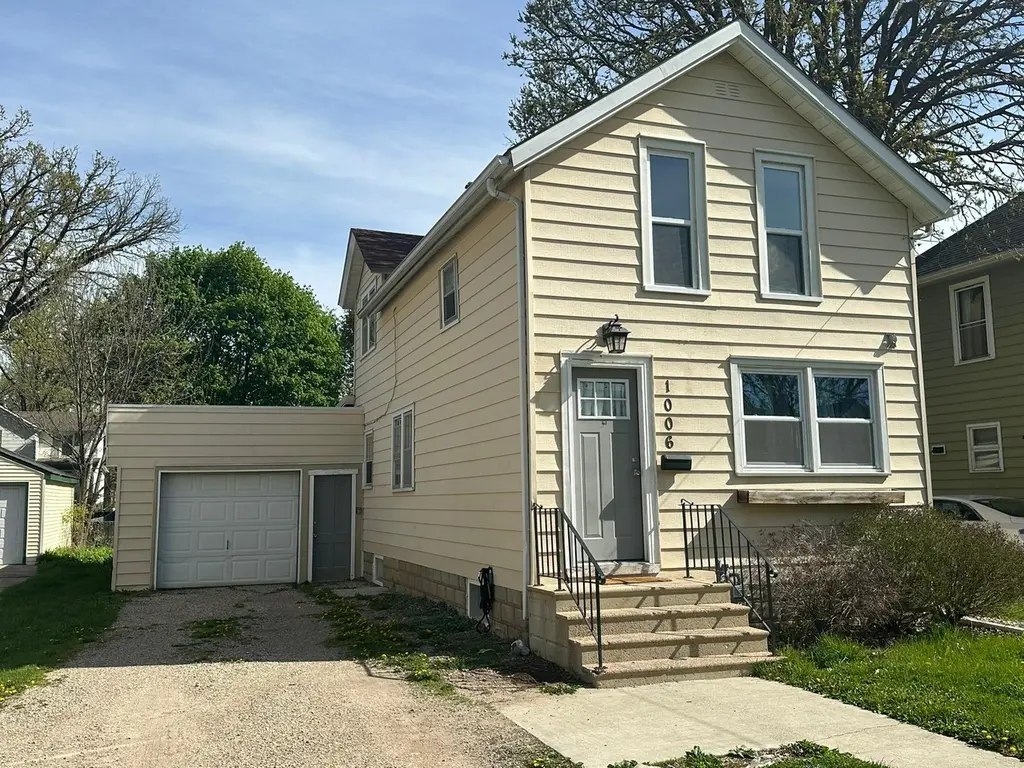
1006 6th Ave NW · Austin, MN
Flood risk 1/10 · Minimal
- FEMA flood zone
- X (unshaded)
- Chance of flooding over 30 yrs
- 0.0%
- Est. flood insurance / yr
- $473 – $860
Fire risk 1/10 · Minimal
- Est. fire insurance / yr
- $888 – $1,650
Heat risk 1/10 · Minimal
- Hot days now (above 98°F)
- 7 days/yr
- Hot days in 30 yrs
- 16 days/yr
Wind risk 2/10 · Minimal
- Chance of severe wind over 30 yrs
- —
Air-quality risk 1/10 · Minimal
- Unhealthy air days now
- 0 days/yr
- Unhealthy air days in 30 yrs
- 0 days/yr
Risk factors via First Street. Map © Google.
Why this score? — see what drove the D grade
The composite is a weighted blend of 9 inputs, each scored 0–100. Each bar is that input's sub-score; the figure is the points it added to the 100-point composite (weight × sub-score).
- Cash flow +13.8/30.0
- ARV discount +6.1/15.0
- Rent growth +5.0/5.0
- DSCR +4.2/10.0
- Livability +4.0/5.0
- 1% rule +2.9/10.0
- Schools +2.5/10.0
- Condition / age +2.5/5.0
- Appreciation +0.0/10.0
$160,000
🖨 Deal sheet (PDF) 📄 Offer letter ✓ Due diligence
Listing remarks MLS
Super starter home or move up to this 3 bedroom two bath home with many recent updates in the kitchen and baths, plus new paint and carpet plus hardwood floors. Attached garage, permanent siding, a very nice affordable and comfortable home!
Key facts
- Steel siding
- Functional layout
- Nice-sized yard
Tags
Property features AI
Exterior
- Parking: Attached garage (1 car)
- Utilities: City water connected; City sewer connected; Natural gas
- Home design: Residential property; Two levels; Main level entry
- Construction: Living area about 1,540 sq ft; Above-grade finished area 1,440; Below-grade finished area 100; Total building area 2,052; Foundation: block
- Exterior features: Lot approximately 0.14 acres (45 x 135)
Interior
- Bedrooms: 3 bedrooms
- Bathrooms: 1 full bath; 1 three-quarter bath
- Heating & cooling: Forced air heating; No central air
- Interior features: Partial basement; Block foundation
Neighborhood map
What this means for you Summary
Snapshot
- This is a 2-bed/2.0-bath single-family listed at $160k.
Deal economics
- At list price, monthly cash flow is $13 ($159/yr) — positive.
- The deal already cash-flows at list — no discount required.
- To meet the 1% rule (rent ≥ 1% of price), the offer needs to be $126k (21.3% below list).
- Recommended offer: $126k (21.3% below list) — sets the bar for 1% rule.
- Cap rate 6.4% vs local median 4.5% in Austin — top-decile yield for the area; either an underpriced asset or a hidden risk that comps aren't pricing in. Stress-test before assuming the spread holds.
Location & tenants
- Location reads 80/100 on livability (#77 in MN, #1,829 nationally) — a professional / high-income tenant draw. Strengths: cost of living A+, housing A+, health & safety A+; Watch: schools C-, commute F.
- Austin Public School District (town): math 24% / reading 34% proficiency, ranked #267 of 301 in MN (top 89%) — low school quality limits family demand, transient renter base, plan for 1-2y turnover.
- Market conditions: Rents rising fast (+11.6%/yr); 191 active listings in the ZIP; 4 comparable units currently listed for rent nearby; rentals lingering (median 45d on market — plan ~5-8 weeks vacancy on turnover, expect pricing pressure); 100% of comp listings sitting > 30 days — soft ceiling on asking rent; 53 units permitted in Mower County in 2024 (0 in 5+ unit buildings).
Forward outlook
- Local home prices are declining (-3.0%/yr); year-one equity from $1k of loan paydown is wiped out by about $5k of value loss. Plan a longer hold.
Negotiation context
- It's been on market 48 days — a 3% lower offer ($155k) is reasonable based on typical stale-listing flexibility.
- 4 sale attempts since 21y ago with the ask held roughly flat each time — persistent listings suggest the price (not the market) is what's stuck; bring a comps-based counter.
Risks & watch-outs
- Watch-outs: built in 1907 — expect roof / HVAC / electrical / plumbing capex.
Questions for the listing agent
- It's been on market 48 days. Have you received any prior offers? Is the seller open to a 21% concession, seller financing, or rate buy-down credit?
- Built in 1907 — when were the roof, HVAC, electrical panel, plumbing, and water heater last replaced?
- Is there a deadline driving the sale (1031 exchange, divorce, estate, relocation)? That informs how much negotiation room exists.
- The area grade is low — what's the realistic commute time and amenity access for the typical tenant pool here? Any planned neighborhood developments (good or bad) we should know about?
- What's the average days-on-market for RENTAL listings here right now (not sales)? A rising rental-DOM trend means longer vacancies and softer asking-rent achievability than the comps imply.
- What's the recent tenant-quality profile in this submarket — average credit score on applications, eviction rate, late-payment / NSF rate, and stable-employment percentage? A property-management company in the area should have these aggregated.
- How much new for-sale + rental construction is in the pipeline within 1–3 miles? Heavy new supply typically softens prices + rents 12–24 months out; constrained supply supports both.
Investment metrics
- 1% rule
- 0.79% ✗
- Cap rate
- 6.39%
- Cash-on-cash
- 0.36%
- DSCR
- 1.02
- GRM
- 10.6
CMA / ARV
- ARV (median comp)
- $155,167
- List price
- $160,000
- Delta
- 3.11%
- Verdict
- FAIR
- Comps
- 4 within 1.0 mi
Show comp detail 1 sale within ~0.75 mi
| Address | Dist | Beds/Ba | Sqft | Sold | Price | $/sf | Match |
|---|---|---|---|---|---|---|---|
| 1303 NW 10th St | 0.38mi | 2/2.0 | 1,403 (-3%) | 22mo | $164,900 | $118 | 60 |
Match score weights: distance 35% · size 25% · config 20% · recency 20%. Top-matched comps best support the ARV.
Projected returns pro-forma
-3.0% appreciation · 8.0% rent growth · sell at horizon
- IRR
- -10.9%
- Equity multiple
- 0.59×
- Total profit
- $-18,487
- Equity at exit
- $23,857
- IRR
- 3.8%
- Equity multiple
- 1.34×
- Total profit
- $15,035
- Equity at exit
- $13,834
Cash invested: $44,800 (down + closing). Projections, not guarantees.
Landlord ↔ Tenant lean methodology
- Overall (STATE)
- 46 Balanced
- State Minnesota
- 46 Balanced · D+2
- County
- — inherits STATE
- City
- — inherits STATE
ZIP-level market 55912
- Home prices YoY
- -34.4%
- Rents YoY
- 11.6%
- Active inventory
- 191
- Price-to-rent
- 10.6×
Monthly cashflow live
- Estimated rent
- $1,259 medium interval (Pro) →
- Mortgage (P&I)
- −$839
- Tax from tax record
- −$76 /mo · $906/yr
- Insurance
- −$67
- HOA
- −$0
- Vacancy / Maint / Mgmt
- −$264
- Net cashflow
- $13
Break-even live
Sensitivity live
| Price | -10% $104 | -5% $59 | +0% $13 | +5% $-32 | +10% $-77 |
|---|---|---|---|---|---|
| Rent | -10% $-86 | -5% $-36 | +0% $13 | +5% $63 | +10% $113 |
| Rate | -1.0pp $94 | -0.5pp $54 | base $13 | +0.5pp $-28 | +1.0pp $-70 |
UW: 25.0% down · 7.5% · 30yr · 1.5% tax · 5.0% vac · 8.0% maint · 8.0% mgmt
Financing live
Cash to close
- Down payment
- $40,000
- Closing costs
- $4,800
- Reserves months
- —
- Total cash needed
- —
Loan-product check · same deal, 3 products live
Conventional
25% down · 7.5% · 30yr
- Down + closing
- —
- Monthly P&I
- —
- Monthly cashflow
- —
- DSCR
- —
- Eligible?
- —
Personal DTI + credit; lowest rate.
DSCR
20% down · 8.5% · 30yr
- Down + closing
- —
- Monthly P&I
- —
- Monthly cashflow
- —
- DSCR
- —
- Eligible?
- —
No personal income docs; deal must DSCR.
Hard money
10% down · 12.0% · 12mo
- Down + closing
- —
- Monthly P&I
- —
- Monthly cashflow
- —
- DSCR
- —
- Eligible?
- —
Short-term bridge; refi at stabilization.
Rent comps 4 comps
| Address | Beds | Baths | Sqft | Rent | $/sqft | DOM | Units | Dist |
|---|---|---|---|---|---|---|---|---|
| 609 11th St NW Austin, MN | 2.0 | 2.0 | 925 | $1,300 | $1.41 | 44d | 1 | 0.10mi |
| 704 1st Dr NW Austin, MN | 3.0 | 1.0–2.0 | 981 | $2,082 | $2.12 | 44d | 96 | 0.55mi |
| 202 11th Ave NW Unit 602 Austin, MN | 2.0 | 1.0 | 1000 | $950 | $0.95 | 44d | 1 | 0.65mi |
| 1204 1st Ave NE Austin, MN | 3.0 | 2.0 | 1200 | $1,600 | $1.33 | 44d | 1 | 1.48mi |
Listing history 27 events
-
2026-06-21days on market $160,000 Active 48 DOM
-
2026-06-19days on market $160,000 Active 46 DOM
-
2026-06-18days on market $160,000 Active 45 DOM
-
2026-06-17days on market $160,000 Active 44 DOM
-
2026-06-16days on market $160,000 Active 43 DOM
-
2026-06-15days on market $160,000 Active 42 DOM
-
2026-06-14days on market $160,000 Active 40 DOM
-
2026-06-12days on market $160,000 Active 39 DOM
-
2026-06-09days on market $160,000 Active 36 DOM
-
2026-06-08days on market $160,000 Active 35 DOM
-
2026-06-07days on market $160,000 Active 34 DOM
-
2026-06-05days on market $160,000 Active 31 DOM
-
2026-06-02days on market $160,000 Active 29 DOM
-
2026-06-01days on market $160,000 Active 28 DOM
-
2026-05-31days on market $160,000 Active 27 DOM
-
2026-05-30days on market $160,000 Active 26 DOM
-
2026-05-04$165,000 Active 331-char remark
-
2022-08-30soldstatus $150,000
-
2022-08-05soldstatus $150,000 Sold 242-char remark
Show marketing remark (242 chars)
Super starter home or move up to this 3 bedroom two bath home with many recent updates in the kitchen and baths, plus new paint and carpet plus hardwood floors. Attached garage, permanent siding, a very nice affordable and comfortable home!
-
2022-05-24status Pending 242-char remark
Show marketing remark (242 chars)
Super starter home or move up to this 3 bedroom two bath home with many recent updates in the kitchen and baths, plus new paint and carpet plus hardwood floors. Attached garage, permanent siding, a very nice affordable and comfortable home!
-
2022-05-20historical Contingent - Inspection 242-char remark
Show marketing remark (242 chars)
Super starter home or move up to this 3 bedroom two bath home with many recent updates in the kitchen and baths, plus new paint and carpet plus hardwood floors. Attached garage, permanent siding, a very nice affordable and comfortable home!
-
2022-05-18$139,900 Active 242-char remark
Show marketing remark (242 chars)
Super starter home or move up to this 3 bedroom two bath home with many recent updates in the kitchen and baths, plus new paint and carpet plus hardwood floors. Attached garage, permanent siding, a very nice affordable and comfortable home!
-
2018-12-10historical
-
2008-10-16$52,000
-
2005-08-30$52,900
-
1998-11-27soldstatus $34,000
-
1998-11-27soldstatus $31,000
ⓘ Source: listings_history table (triggers on properties + properties_extension) + one-shot
backfill from property_details.listing_events for pre-trigger history.
Tax reassessment forecast MN · Partial reset (capped growth)
- Current annual tax
- $906 · $76/mo
- Projected year-2 tax
- $1,349 · $112/mo
- Expected delta
- +$443/yr (+$37/mo · 48.9%)
ⓘ Screening estimate from a state-policy table — verify with the county assessor before closing.
Climate risk First Street
- Flood 1/10 Low FEMA zone X (unshaded) · 0% chance over 30 yrs
- Wildfire 1/10 Low
- Heat 1/10 Low 7 d/yr ≥98°F today · 16 d/yr by 30 yrs out
- Wind 2/10 Low
- Air quality 1/10 Low 0 unhealthy d/yr today · 0 by 30 yrs out
Nearby sold comps map
Loading sold comps map…
Walkable amenities ~0.75 mi
Loading nearby amenities…
Taxation est. · year 1
- Rental income
- $15,106
- − Mortgage interest
- −$8,962
- − Property taxes
- −$906
- − Insurance
- −$800
- − Repairs & maintenance
- −$1,208
- − Management
- −$1,208
- − Depreciation
- −$4,655
- Taxable loss
- −$2,634
- Est. tax savings @ 24.0%
- +$632
- After-tax cash flow
- $791/yr
For passive investors: Depreciation is non-cash, so a rental often shows a tax loss while cash-flowing — sheltering income. Rental losses are passive: they offset passive income freely, and up to $25,000/yr can offset ordinary (W-2) income if you actively participate and your MAGI is under $100k (phasing out to $0 by $150k); unused losses carry forward. On sale, claimed depreciation is recaptured at up to 25%, and gains may owe capital-gains tax (a 1031 exchange can defer both). Figures are a year-1 estimate at your 24.0% rate — not tax advice; consult a CPA.
Schools (NCES district)
- District
- Austin Public School District
- NCES district ID
- 2703450
- Math proficiency
- 24% ▼ -12.00%
- Reading proficiency
- 34% ▼ -9.00%
- Median HH income
- $43,818
- Composite
- 24.75/100
- National rank
- #7604
- State rank
- #267 of 301 in MN
Livability — Austin
- Score
- 80/100
- State rank
- #77
- US rank
- #1829
Category grades
Schools grade is shown separately in the Schools card above.
Census & demographics
- Census place
- Austin, MN
- County
- Mower County · 29,632 people
- City population
- 29,632
- Metro
- Austin, MN
- Population (ZIP)
- 29,632
- Household income
- $70,177
- Rent vs Own
- Severe rent burden
- 759.0
Population outlook (Mower County) Hauer SSP2
- Today (2025)
- 39,967 people
- By 2030
- 40,204 · +0.6%
- By 2040
- 40,509 · +1.4%
- By 2050
- 40,841 · +2.2%
- By 2075
- 42,029 · +5.2%
- By 2100
- 42,272 · +5.8%
Race, ethnicity, and origin ACS 2023
- Neighborhood character
- Predominantly White (67%)
- Race & ethnicity
- White 67% Hispanic / Latino 16% Asian 8% Two or more races 7% Black 5%
- Hispanic origin (detail)
- Mexican 12%
- Common ancestry
- Portuguese 16% Lithuanian 2% Iranian 2%
- Foreign-born
- 15% · Canada, Philippines, China
- Languages at home
- 76% English-only · Spanish 14% Other Asian/Pacific 5% German/W. Germanic 1%
Political lean MEDSL · Mower
- 2024 margin
- R (+10.5) · D 43.9% · R 54.4% · Other 1.7%
- 2008→2024 swing
- -34.1pp toward R · 2008: 23.6pp · 2024: -10.5pp
- All cycles
- 2024: R+10.5 2020: R+5.8 2016: R+7.8 2012: D+22.7 2008: D+23.6
Not yet ingested
- Civics
- —
Market trends
- HPI YoY
- ▼ -142.60%
- Current HPI
- 271.4199
- Rent YoY
- ▲ 11.62%
- Metro
- Austin, MN
- State GDP YoY
- ▲ 2.41%
- F500 in state
- 34
Industry mix (Fortune 500 HQ in MN)
| Industry | F500 HQs | Revenue |
|---|---|---|
| Healthcare | 2 | $407B |
|
||
| Retail | 2 | $150B |
|
||
| Consumer Goods | 2 | $32B |
|
||
| Industrial Machinery | 2 | $6B |
|
||
| Agriculture | 1 | $40B |
|
||
| Healthcare / Medical Devices | 1 | $32B |
|
||
Price history
+370.6% since first listed12 events — show timeline
- 2026-05-22 Price Changed $160,000 NORTHSTARMLS as Distributed by MLS Grid
- 2026-05-04 Listed $165,000 NORTHSTARMLS as Distributed by MLS Grid
- 2022-08-30 Sold (Public Records) $150,000 Public Records
- 2022-08-05 Sold (MLS) $150,000 NORTHSTARMLS as Distributed by MLS Grid
- 2022-05-24 Pending — NORTHSTARMLS as Distributed by MLS Grid
- 2022-05-20 Contingent — NORTHSTARMLS as Distributed by MLS Grid
- 2022-05-18 Listed $139,900 NORTHSTARMLS as Distributed by MLS Grid
- 2018-12-10 Listing Removed — NORTHSTARMLS as Distributed by MLS Grid
- 2008-10-16 Listed $52,000 NORTHSTARMLS as Distributed by MLS Grid
- 2005-08-30 Listed $52,900 NORTHSTARMLS as Distributed by MLS Grid
- 1998-11-27 Sold (Public Records) $31,000 Public Records
- 1998-11-27 Sold (Public Records) $34,000 Public Records
Property tax history
+1.5%/yrLatest (2025): $906 · +10.8% YoY. Source: county tax records.
Cash-flow waterfall
monthlySold comps — $/sqft
last 12 mo · ≤1 miLoading sold comps…