 🌊 Lakefront
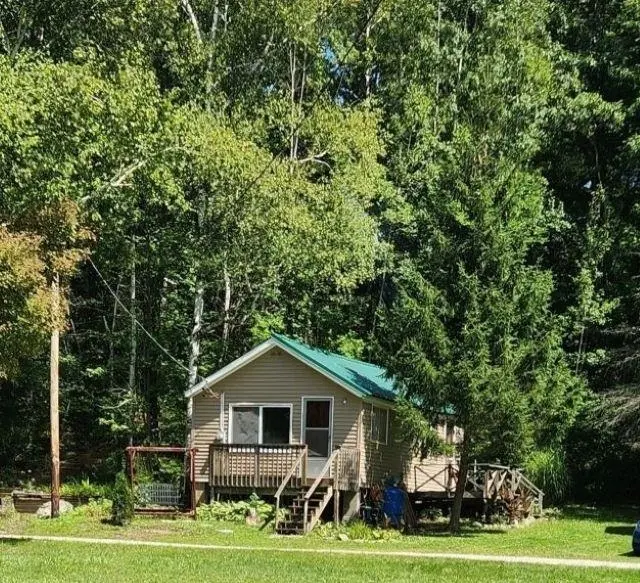
5319 S Lakeview · Grout, MI
Flood risk 1/10 · Minimal
- FEMA flood zone
- X (unshaded)
- Chance of flooding over 30 yrs
- 0.0%
- Est. flood insurance / yr
- $507 – $1,088
Fire risk 3/10 · Minor
- Est. fire insurance / yr
- $784 – $1,456
Heat risk 2/10 · Minimal
- Hot days now (above 96°F)
- 7 days/yr
- Hot days in 30 yrs
- 14 days/yr
Wind risk 1/10 · Minimal
- Chance of severe wind over 30 yrs
- —
Air-quality risk 2/10 · Minimal
- Unhealthy air days now
- 1 days/yr
- Unhealthy air days in 30 yrs
- 1 days/yr
Risk factors via First Street. Map © Google.
Why this score? — see what drove the B grade
The composite is a weighted blend of 9 inputs, each scored 0–100. Each bar is that input's sub-score; the figure is the points it added to the 100-point composite (weight × sub-score).
- Cash flow +29.9/30.0
- ARV discount +12.6/15.0
- DSCR +10.0/10.0
- 1% rule +8.4/10.0
- Schools +3.3/10.0
- Rent growth +2.5/5.0
- Livability +2.5/5.0
- Condition / age +2.2/5.0
- Appreciation +0.0/10.0
$89,900
🖨 Deal sheet 📄 Offer letter ✓ Due diligence
Listing remarks MLS
COZY 2 BEDROOM CABIN just across from nice common area at Frost Lake. Home needs some work but you could fix it up with your own touches the way you like for a perfect getaway. Home is also just across from the common dock for swimming and fishing or you could relax and enjoy the lakefront views from your front door!
Key facts
- Front deck
- Frost lake access
- Private dock
Tags
Property features AI
Exterior
- Utilities: Private well water; Septic tank
- Home design: Single-family residence; One level
- Construction: Vinyl siding
- Exterior features: Front porch; Shed(s); Cleared lot; Waterfront access on Frost Lake; Has view
Interior
- Kitchen: Oven; Range; Refrigerator
- Bedrooms: Total of 4 rooms (includes bedrooms and living spaces)
- Bathrooms: 1 full bathroom
- Heating & cooling: Electric heating; Forced air; Hot water heating; No central cooling
- Interior features: Window treatments; Electric water heater
Neighborhood map
What this means for you Summary
Snapshot
- This is a 2-bed/1.0-bath single-family listed at $90k. Condition is rated fair.
Deal economics
- At list price, monthly cash flow is $334 ($4k/yr) — positive.
- The deal already cash-flows at list — no discount required.
- Meets the 1% rule at list price ($1k rent vs $90k).
- Recommended offer: $89k (1.5% below list) — sets the bar for market timing.
Location & tenants
- Location reads: area grade B — affects rentability + tenant quality, not the cash-flow math above.
- Gladwin Community Schools (town): math 28% / reading 51% proficiency, ranked #232 of 540 in MI (top 43%) — families likely to look elsewhere, expect single-tenant / working-renter base with shorter leases.
- Market conditions: 104 active listings in the ZIP; 90 units permitted in Gladwin County in 2024 (0 in 5+ unit buildings).
Forward outlook
- Local home prices are declining (-3.0%/yr); year-one equity from $622 of loan paydown is wiped out by about $3k of value loss. Plan a longer hold.
- Gladwin County population projected at -25% by 2050 — secular population decline; favor cash flow + early exit over multi-decade hold.
- At projected returns (-3.0% appreciation + 3.0% rent growth), your $25k cash investment doubles in ~8 years — after that, you're playing with house money.
Negotiation context
- It's been on market 16 days — a 2% lower offer ($89k) is reasonable based on typical stale-listing flexibility.
- 2 sale attempts since 3y ago with the ask held roughly flat each time — persistent listings suggest the price (not the market) is what's stuck; bring a comps-based counter.
- Current owner paid $49k; list at $90k implies a 83% gain — meaningful room to come down on a strong offer.
Risks & watch-outs
- Watch-outs: built in 1954 — expect roof / HVAC / electrical / plumbing capex.
Questions for the listing agent
- Have any recent inspections been done? Can we get a copy of the seller's disclosures and any deferred-maintenance estimates?
- Built in 1954 — when were the roof, HVAC, electrical panel, plumbing, and water heater last replaced?
- Is there a deadline driving the sale (1031 exchange, divorce, estate, relocation)? That informs how much negotiation room exists.
- This sits on a lake — are riparian / water-frontage rights deeded with the parcel? Any dock permits, shoreline easements, or HOA water-use restrictions?
- What's the documented flood / surge / shoreline-erosion history here (FEMA AND non-FEMA — e.g., storm surge, creek backup, septic-field saturation)?
- Any water-quality or seasonal algae-bloom issues that affect tenant satisfaction or short-term-rental demand?
- What's the average days-on-market for RENTAL listings here right now (not sales)? A rising rental-DOM trend means longer vacancies and softer asking-rent achievability than the comps imply.
- What's the recent tenant-quality profile in this submarket — average credit score on applications, eviction rate, late-payment / NSF rate, and stable-employment percentage? A property-management company in the area should have these aggregated.
- How much new for-sale + rental construction is in the pipeline within 1–3 miles? Heavy new supply typically softens prices + rents 12–24 months out; constrained supply supports both.
Investment metrics
- 1% rule
- 1.34% ✓
- Cap rate
- 10.75%
- Cash-on-cash
- 15.91%
- DSCR
- 1.71
- GRM
- 6.2
CMA / ARV
- ARV (on-the-fly)
- $101,360
- Comps found
- 1
Show comp detail 1 sale within ~0.75 mi
| Address | Dist | Beds/Ba | Sqft | Sold | Price | $/sf | Match |
|---|---|---|---|---|---|---|---|
| 4632 Northland Dr | 0.22mi | 2/1.0 | 552 (-1%) | 1mo | $100,000 | $181 | 87 |
Match score weights: distance 35% · size 25% · config 20% · recency 20%. Top-matched comps best support the ARV.
Projected returns pro-forma
-3.0% appreciation · 3.0% rent growth · sell at horizon
- IRR
- 6.8%
- Equity multiple
- 1.27×
- Total profit
- $6,706
- Equity at exit
- $13,404
- IRR
- 16.2%
- Equity multiple
- 2.32×
- Total profit
- $33,283
- Equity at exit
- $7,773
Cash invested: $25,172 (down + closing). Projections, not guarantees.
Landlord ↔ Tenant lean methodology
- Overall (STATE)
- 62 Landlord-Friendly
- State Michigan
- 62 Landlord-Friendly · EVEN
- County
- — inherits STATE
- City
- — inherits STATE
ZIP-level market 48661
- Home prices YoY
- -21.1%
- Active inventory
- 104
- Price-to-rent
- 6.2×
Monthly cashflow live
- Estimated rent
- $1,209 medium interval (Pro) →
- Mortgage (P&I)
- −$471
- Tax est. 1.5%
- −$112 /mo · $1,348/yr
- Insurance
- −$37
- HOA
- −$0
- Vacancy / Maint / Mgmt
- −$254
- Net cashflow
- $334
Break-even live
UW: 25.0% down · 7.5% · 30yr · 1.5% tax · 5.0% vac · 8.0% maint · 8.0% mgmt
Financing live
Cash to close
- Down payment
- $22,475
- Closing costs
- $2,697
- Reserves months
- —
- Total cash needed
- —
Loan-product check · same deal, 3 products live
Conventional
25% down · 7.5% · 30yr
- Down + closing
- —
- Monthly P&I
- —
- Monthly cashflow
- —
- DSCR
- —
- Eligible?
- —
Personal DTI + credit; lowest rate.
DSCR
20% down · 8.5% · 30yr
- Down + closing
- —
- Monthly P&I
- —
- Monthly cashflow
- —
- DSCR
- —
- Eligible?
- —
No personal income docs; deal must DSCR.
Hard money
10% down · 12.0% · 12mo
- Down + closing
- —
- Monthly P&I
- —
- Monthly cashflow
- —
- DSCR
- —
- Eligible?
- —
Short-term bridge; refi at stabilization.
Listing history 12 events
-
2026-06-18days on market $89,900 Active 16 DOM
-
2026-06-17days on market $89,900 Active 15 DOM
-
2026-06-16days on market $89,900 Active 14 DOM
-
2026-06-15days on market $89,900 Active 13 DOM
-
2026-06-13days on market $89,900 Active 11 DOM
-
2026-06-12days on market $89,900 Active 10 DOM
-
2026-06-09days on market $89,900 Active 7 DOM
-
2026-06-08days on market $89,900 Active 6 DOM
-
2026-06-07days on market $89,900 Active 5 DOM
-
2026-06-07days on market $89,900 Active 4 DOM
-
2026-06-03remarks 457-char remark
-
2026-06-03$89,900 Active 1 DOM
ⓘ Source: listings_history table (triggers on properties + properties_extension) + one-shot
backfill from property_details.listing_events for pre-trigger history.
Climate risk First Street
- Flood 1/10 Low FEMA zone X (unshaded) · 0% chance over 30 yrs
- Wildfire 3/10 Moderate
- Heat 2/10 Low 7 d/yr ≥96°F today · 14 d/yr by 30 yrs out
- Wind 1/10 Low
- Air quality 2/10 Low 1 unhealthy d/yr today · 1 by 30 yrs out
Nearby sold comps map
Loading sold comps map…
Walkable amenities ~0.75 mi
Loading nearby amenities…
Taxation est. · year 1
- Rental income
- $14,506
- − Mortgage interest
- −$5,036
- − Property taxes
- −$1,348
- − Insurance
- −$450
- − Repairs & maintenance
- −$1,161
- − Management
- −$1,161
- − Depreciation
- −$2,615
- Taxable income
- $2,736
- Est. tax owed @ 24.0%
- −$657
- After-tax cash flow
- $3,348/yr
For passive investors: Depreciation is non-cash, so a rental often shows a tax loss while cash-flowing — sheltering income. Rental losses are passive: they offset passive income freely, and up to $25,000/yr can offset ordinary (W-2) income if you actively participate and your MAGI is under $100k (phasing out to $0 by $150k); unused losses carry forward. On sale, claimed depreciation is recaptured at up to 25%, and gains may owe capital-gains tax (a 1031 exchange can defer both). Figures are a year-1 estimate at your 24.0% rate — not tax advice; consult a CPA.
Condition & rehab AI · 12 photos
This property requires moderate renovations to update the kitchen and bathroom, and improve the interior walls and flooring. The location offers a private dock and access to Frost Lake, making it a great getaway property.
Repairs flagged
- Major kitchen appliances — outdated and worn
- Major bathroom fixtures — dated and worn
- Major flooring — worn and outdated
- Major interior walls/paint — dated and peeling
Value-add opportunities
- Both paint interior walls — enhances curb appeal and interior aesthetics
- Both replace kitchen appliances — modernizes the space and improves functionality
- Both repair flooring — improves the overall look and feel of the home
- Both update bathroom fixtures — modernizes the space and improves functionality
Renovation cost estimate screening
| Repair item | Severity | Est. cost |
|---|---|---|
| kitchen appliances · outdated and worn | Major | $15,000–50,000 |
| bathroom fixtures · dated and worn | Major | $15,000–50,000 |
| flooring · worn and outdated | Major | $15,000–50,000 |
| interior walls/paint · dated and peeling | Major | $15,000–50,000 |
| Total estimated repair cost · 4 items | $60,000–200,000 |
Value-add ROI direction
- Both paint interior walls — enhances curb appeal and interior aesthetics ↑
- Both replace kitchen appliances — modernizes the space and improves functionality ↑
- Both repair flooring — improves the overall look and feel of the home ↑
- Both update bathroom fixtures — modernizes the space and improves functionality ↑
ⓘ Cost ranges are severity-bucket heuristics (US national rule-of-thumb). Get contractor quotes + a written scope before underwriting a rehab budget.
Schools (NCES district)
- District
- Gladwin Community Schools
- NCES district ID
- 2615990
- Math proficiency
- 28% ▼ -13.00%
- Reading proficiency
- 51% ▼ -2.00%
- Median HH income
- $38,917
- Composite
- 32.93/100
- National rank
- #5595
- State rank
- #232 of 540 in MI
Livability — Grout
No livability data for this city. (Only ~50 U.S. cities are tracked.)
Census & demographics
- Population (ZIP)
- 10,744
Population outlook (Gladwin County) Hauer SSP2
- Today (2025)
- 23,440 people
- By 2030
- 22,281 · -4.9%
- By 2040
- 19,867 · -15.2%
- By 2050
- 17,667 · -24.6%
- By 2075
- 12,909 · -44.9%
- By 2100
- 8,629 · -63.2%
Race, ethnicity, and origin ACS 2023
- Neighborhood character
- Predominantly White (92%)
- Race & ethnicity
- White 92% Two or more races 4% Hispanic / Latino 2% Asian 1%
- Common ancestry
- Romanian 10% Lithuanian 4% Slovak 3%
- Foreign-born
- 2% · Canada
- Languages at home
- 97% English-only · Other Indo-European 1% Spanish 1%
Political lean MEDSL · Gladwin
- 2024 margin
- Solid R (+40.7) · D 29.1% · R 69.8% · Other 1.1%
- 2008→2024 swing
- -42.2pp toward R · 2008: 1.5pp · 2024: -40.7pp
- All cycles
- 2024: R+40.7 2020: R+36.8 2016: R+34.7 2012: R+7.2 2008: D+1.5
Not yet ingested
- Civics
- —
Market trends
- HPI YoY
- ▼ -67.99%
- Current HPI
- 253.6665
- Rent YoY
- —
- Metro
- —
- State GDP YoY
- ▲ 1.37%
- F500 in state
- 28
Industry mix (Fortune 500 HQ in MI)
| Industry | F500 HQs | Revenue |
|---|---|---|
| Automotive Parts | 3 | $48B |
|
||
| Automotive | 2 | $372B |
|
||
| Chemicals | 1 | $45B |
|
||
| Automotive Retail | 1 | $29B |
|
||
| Healthcare / Medical Devices | 1 | $23B |
|
||
| Automotive Technology | 1 | $20B |
|
||
Price history
+83.5% since first listed4 events — show timeline
- 2026-06-01 Listed $89,900 REALCOMP
- 2023-08-14 Sold (MLS) $49,200 REALCOMP
- 2023-07-17 Contingent — REALCOMP
- 2023-06-29 Listed $49,000 REALCOMP
Cash-flow waterfall
monthlySold comps — $/sqft
last 12 mo · ≤1 miLoading sold comps…